
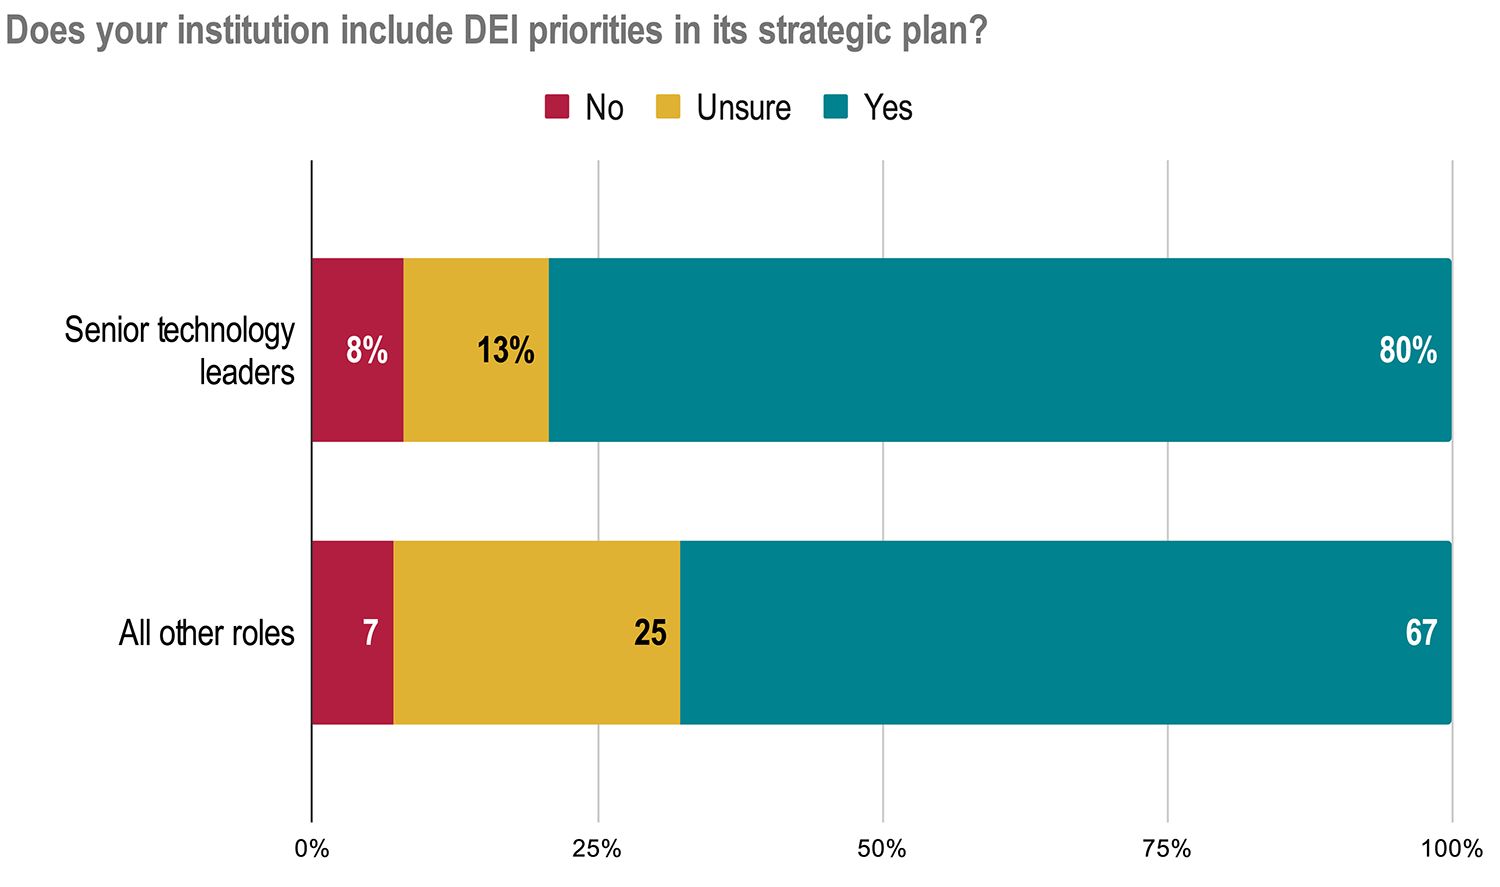
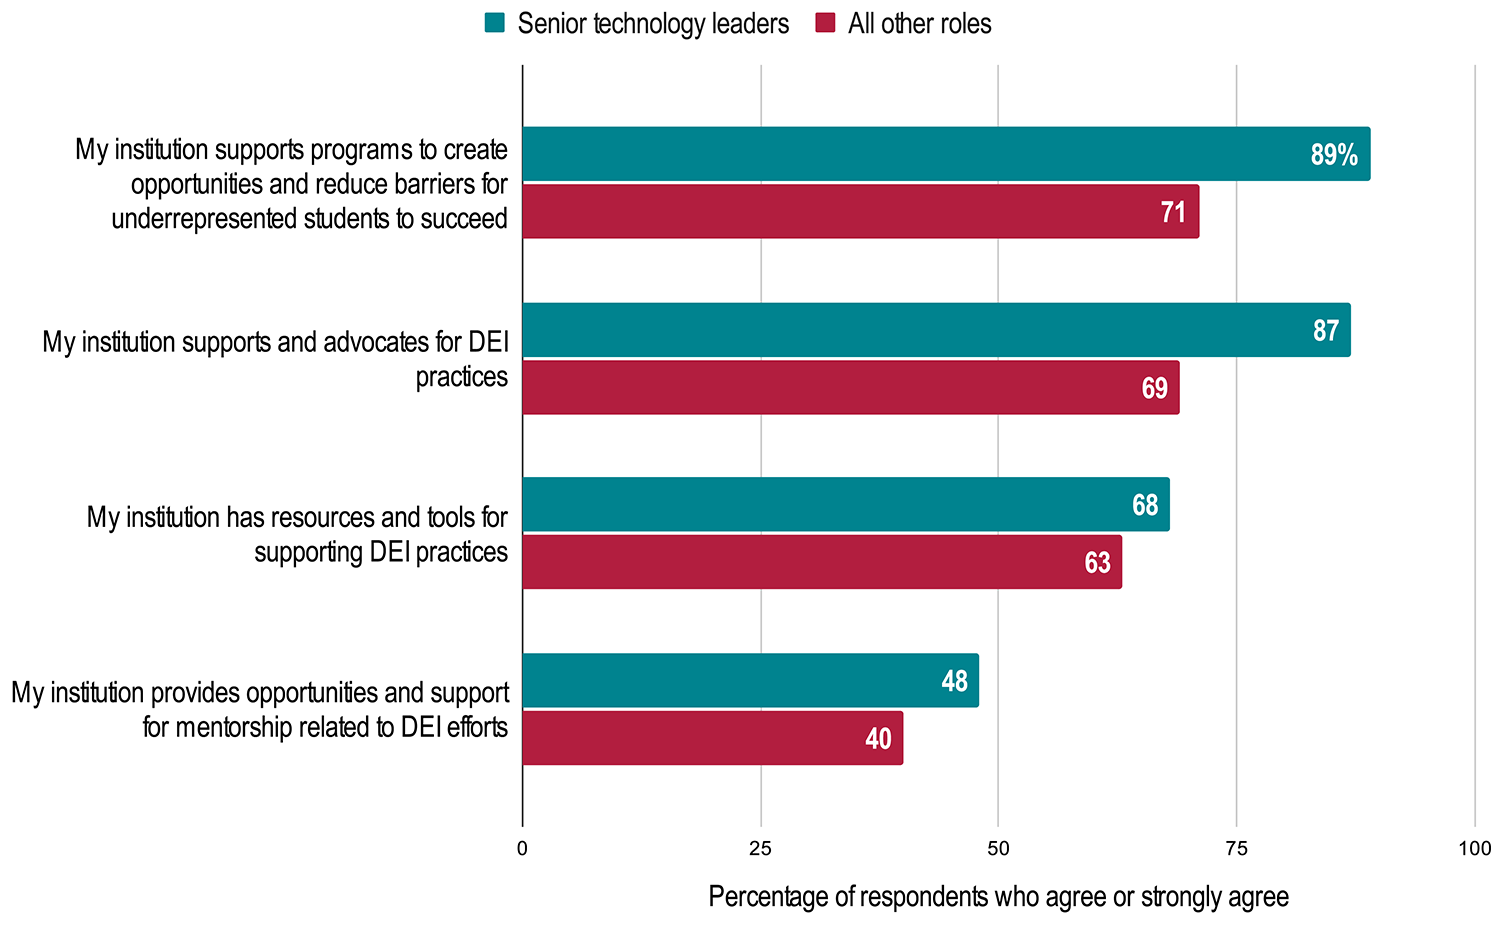
As stakeholders translate intention into action, data indicate that senior technology leaders feel more optimistic about diversity, equity, and inclusion (DEI) progress than do middle management and frontline staff.

EDUCAUSE is helping institutional leaders, technology professionals, and other staff address their pressing challenges by gathering and sharing data. This report is based on an EDUCAUSE QuickPoll. QuickPolls enable us to rapidly gather, analyze, and share input from our community about specific emerging topics.Footnote1
The graphs presented here are drawn from the QuickPoll conducted for the previously published "EDUCAUSE QuickPoll Results: Leadership and Action for Diversity, Equity, and Inclusion."Footnote2 They provide additional findings not included in that article and focus on the responses of senior technology leaders as compared with the responses of middle management and frontline staff. Nearly one in five respondents (17%) to this QuickPoll reported holding a senior technology leadership role at the level of a CIO (chief information officer) or a deputy CIO (see table 1).
| Job Role | Percentage of Respondents |
|---|---|
|
CIO or Deputy CIO level (e.g., CIO, CTO, AVP/VP of IT, executive/senior director of IT, deputy CIO, associate CIO) |
17 |
|
IT professional or specialist |
24 |
|
IT director or assistant director |
12 |
|
Director or lead of academic computing or instructional technology |
9 |
|
IT manager |
9 |
|
Instructional designer |
8 |
|
Other or prefer not to answer |
20 |
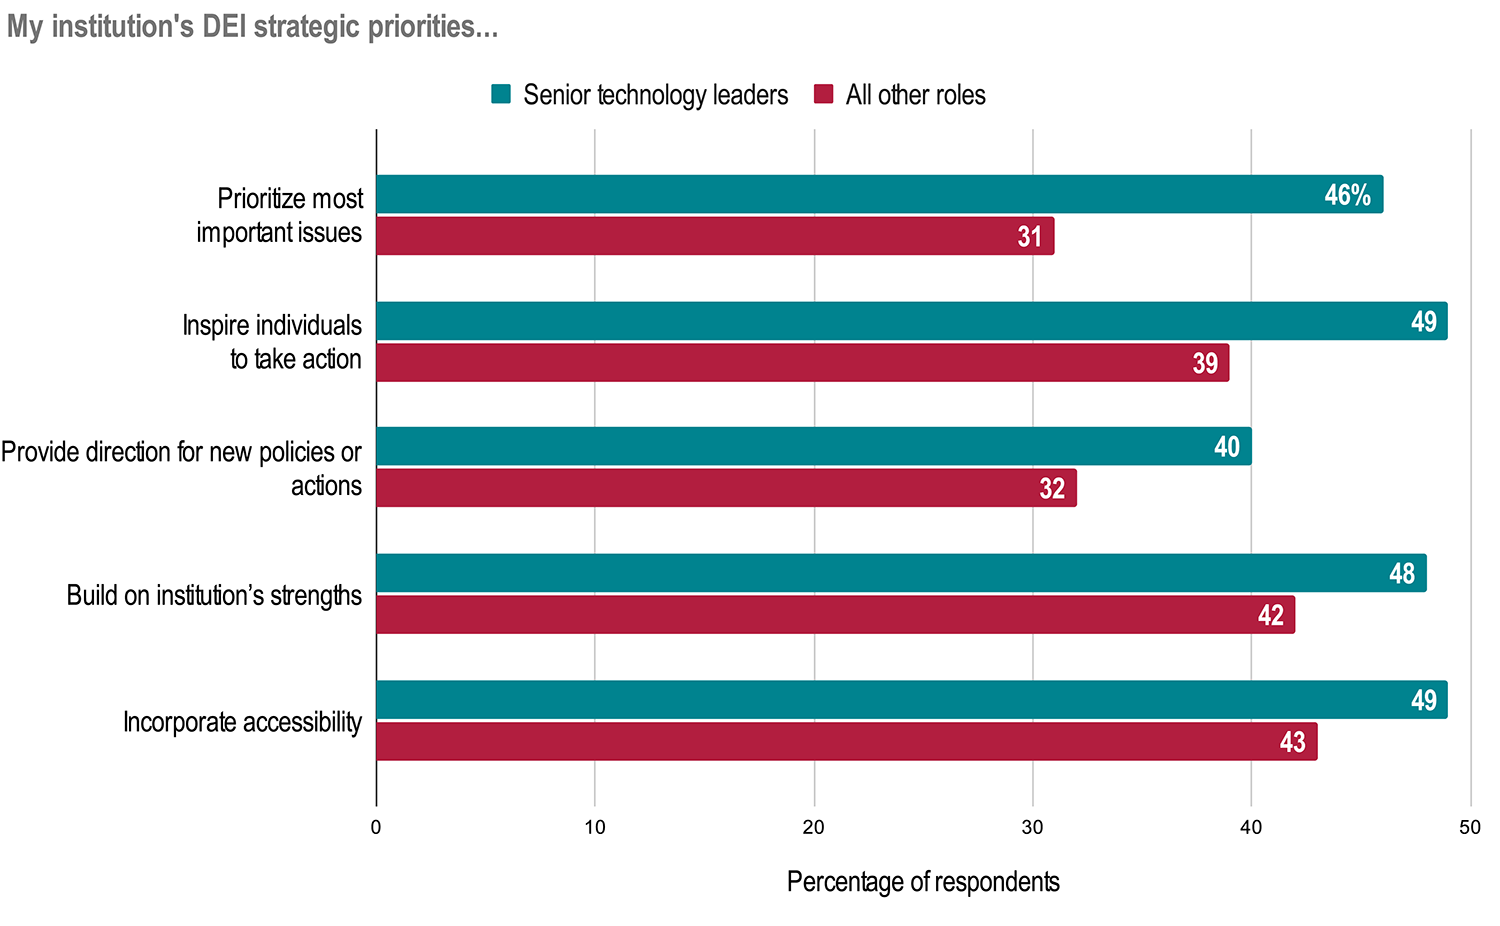
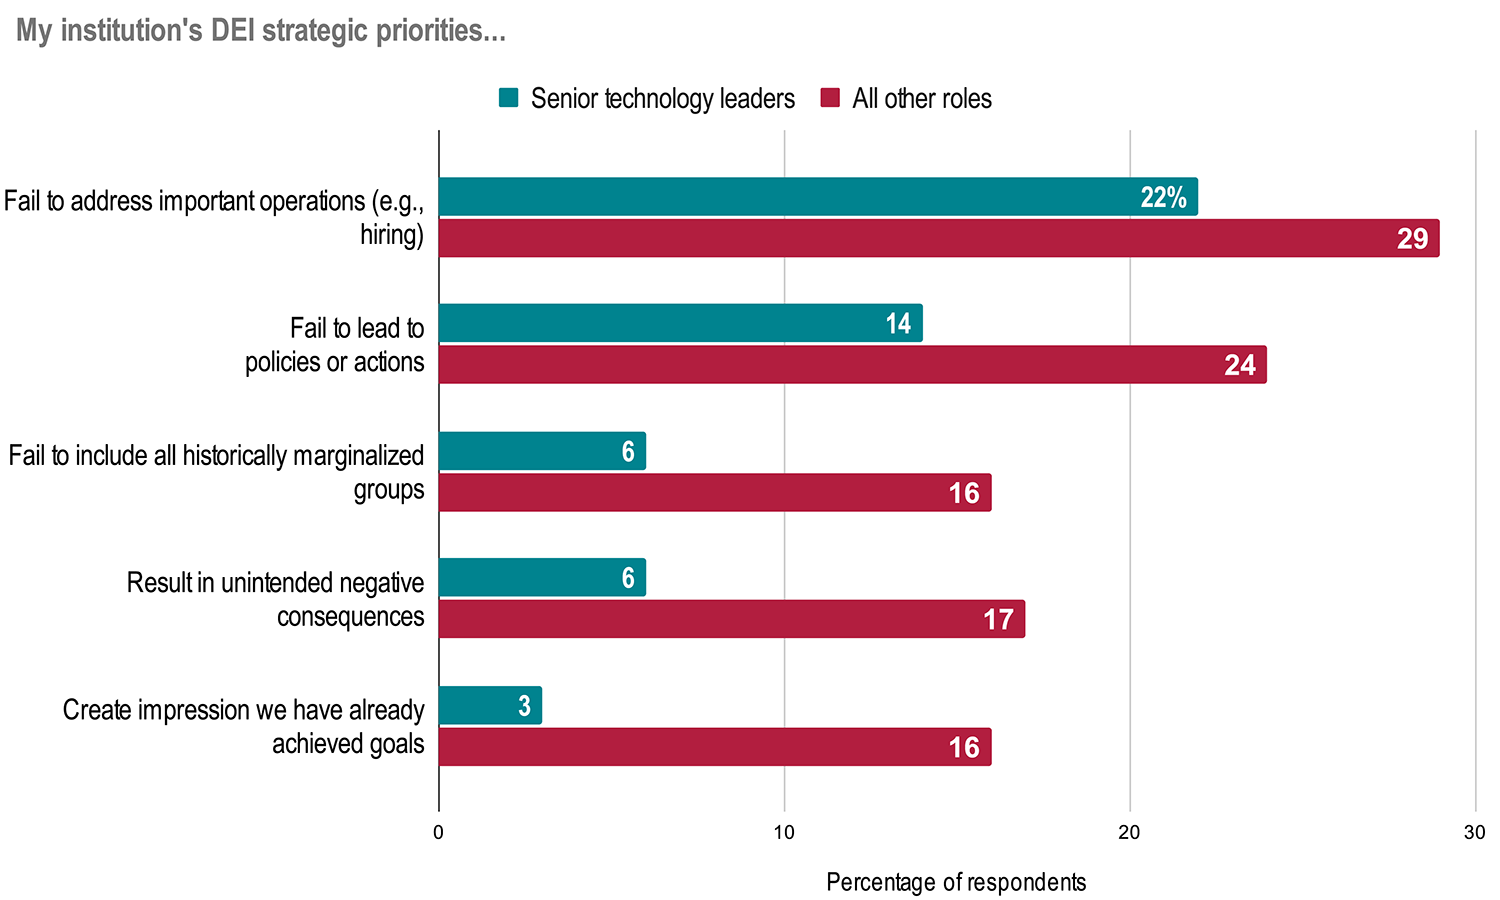
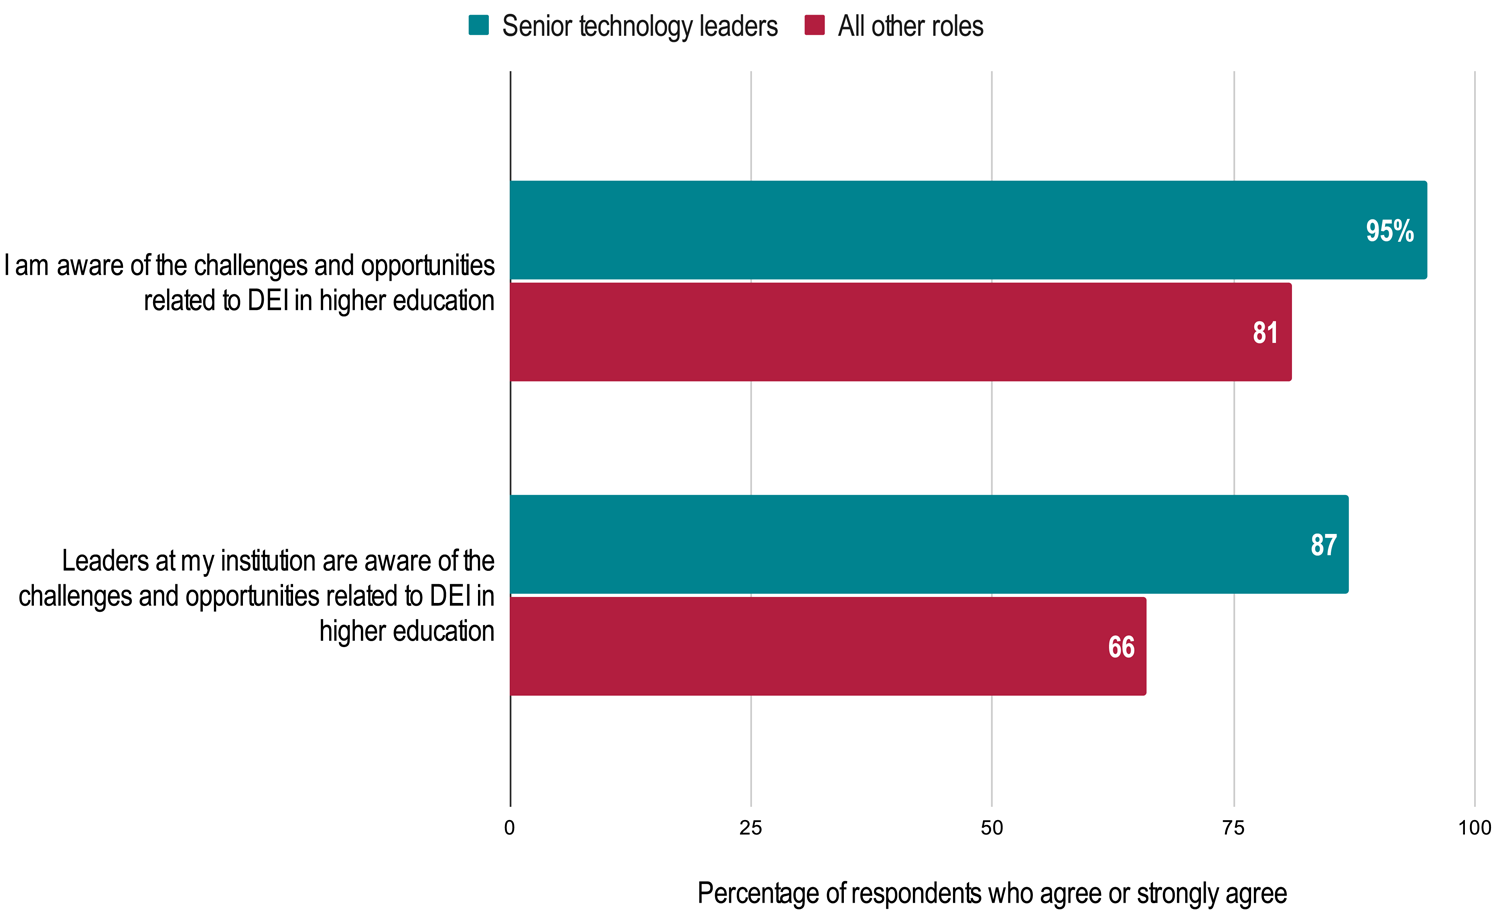
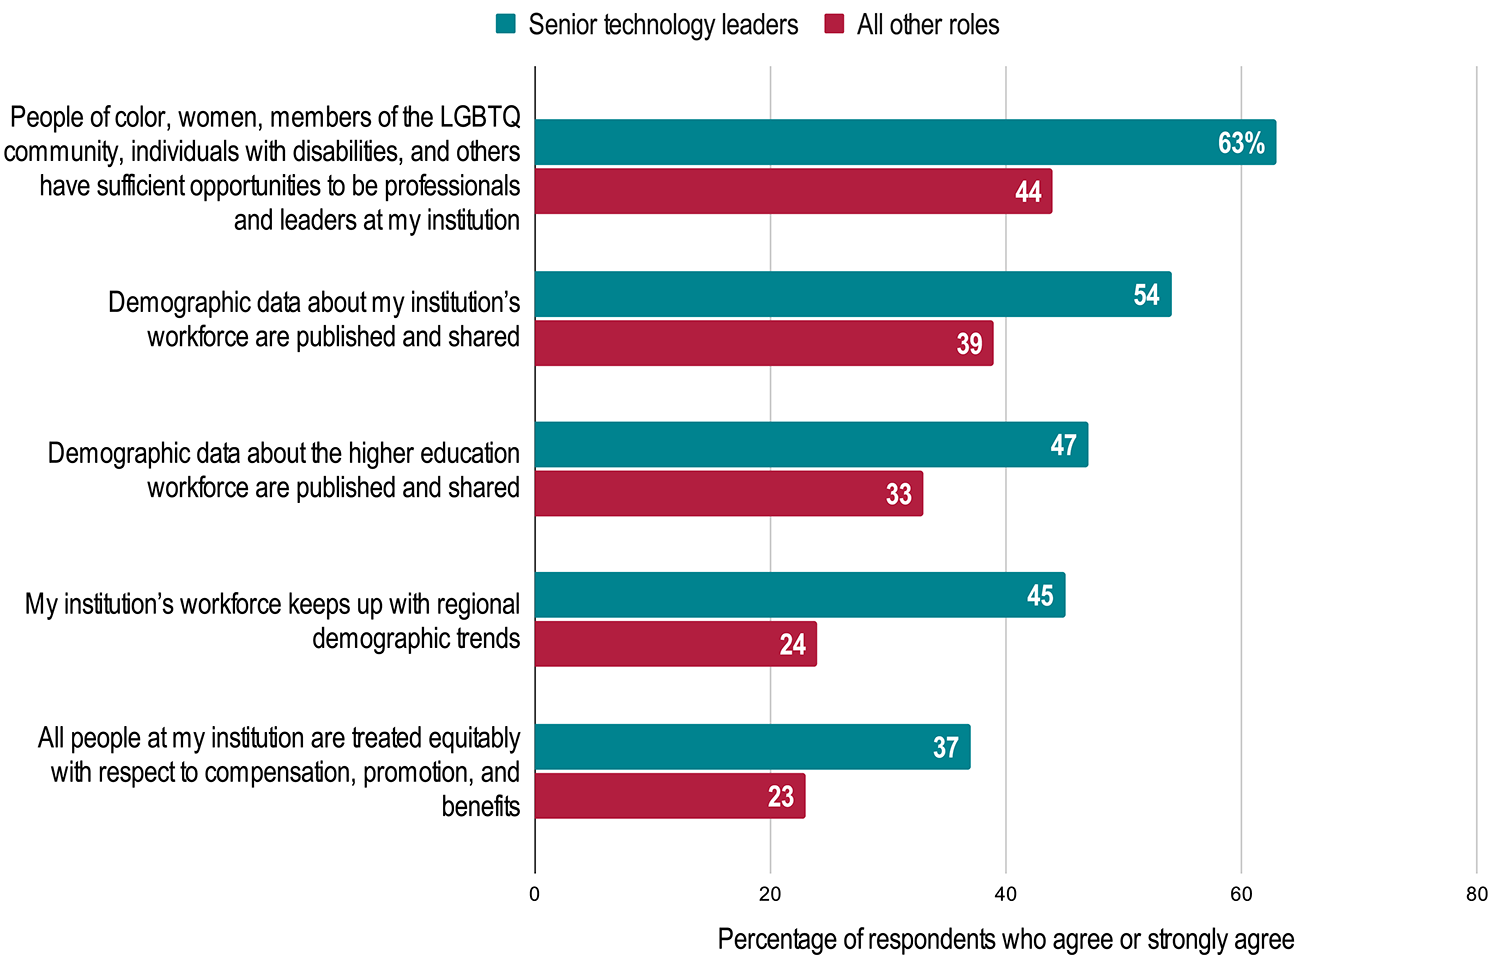
An exploration of these senior technology leaders' responses to the QuickPoll revealed a consistent trend across almost all data: senior technology leaders are more optimistic about DEI progress at their institutions. The reasons for this difference were beyond the scope of the QuickPoll, and these data lead to only more questions. For example, are technology leaders more optimistic because they are not aware of the challenges middle managers and frontline staff face on a day-to-day basis? Given that higher education technology leaders are more likely to be white and male,Footnote3 how do their personal experiences influence their impressions of DEI progress? Are institution-wide DEI conversations or initiatives at the executive level not effectively communicated to lower levels of management and staff or not otherwise noticeably impacting the workplace experiences of middle and frontline staff?
Whatever the reasons for these gaps in perception, they point to a need for technology leaders to bridge those gaps. For ideas on how to do so, see the "Promising Practices" section in the earlier report drawn from this QuickPoll.Footnote4
All QuickPoll results can be found on the EDUCAUSE QuickPolls web page. For more information and analysis about higher education IT research and data, please visit the EDUCAUSE Review EDUCAUSE Research Notes topic channel, as well as the EDUCAUSE Research web page.
Notes
- QuickPolls are less formal than EDUCAUSE survey research. They gather data in a single day instead of over several weeks and allow timely reporting of current issues. This poll was conducted between May 16 and May 17, 2022, consisted of 11 questions, and resulted in 454 complete responses. The poll was distributed by EDUCAUSE staff to relevant EDUCAUSE Community Groups rather than via our enterprise survey infrastructure, and we are not able to associate responses with specific institutions. Our sample represents a range of institution types and FTE sizes. Jump back to footnote 1 in the text.
- Jenay Robert, "EDUCAUSE QuickPoll Results: Leadership and Action for Diversity, Equity, and Inclusion," EDUCAUSE Review, May 20, 2022. Jump back to footnote 2 in the text.
- Joseph Galanek, Dana C. Gierdowski, and D. Christopher Brooks, The Higher Education IT Workforce Landscape, 2019, EDUCAUSE Research Report, February 28, 2019. Jump back to footnote 3 in the text.
- Robert, "EDUCAUSE QuickPoll Results: Leadership and Action for Diversity, Equity, and Inclusion." Jump back to footnote 4 in the text.
Jenay Robert is Researcher at EDUCAUSE.
© 2022 Jenay Robert. The text of this work is licensed under a Creative Commons BY-NC-ND 4.0 International License.