
The majority of higher education institutions and the units within them have now developed strategic plans and goals related to diversity, equity, and inclusion. Stakeholders are asking leaders to move from aspiration to action, translating intentions into tangible outcomes.

EDUCAUSE is helping institutional leaders, IT professionals, and other staff address their pressing challenges by gathering and sharing data. This report is based on an EDUCAUSE QuickPoll. QuickPolls enable us to rapidly gather, analyze, and share input from our community about specific emerging topics.Footnote1
The Challenge
Higher education stakeholders seek to effect institutional change in the area of diversity, equity, and inclusion (DEI). It’s a big, important job, and no shortage of roadblocks attends the work. With fundamental differences in how individuals even define DEI, an essential element of this work is that the higher education community continue to engage in tough conversations and participate in actions that lead to meaningful progress.
The Bottom Line
Institutional strategies and goals use all the right words but frequently lead to little action. Nearly half (46%) of respondents disagreed or strongly disagreed that all people at their institution are treated equitably with respect to compensation, promotion, and benefits. Further, open-ended comments from respondents consistently highlighted the lack of action and measurable outcomes related to DEI strategic goals at their institution, referring to such goals as “lip service” with “very little actual action.”
Institutional change requires both top-down and bottom-up efforts. Higher education leaders can take these actions:
- Help your unit discuss and agree upon a shared understanding of what DEI is and how it should be supported.
- Link goals, strategic plans, and other aspirational statements to concrete action plans, and evaluate progress regularly.
- Collect and share data related to differential experiences in your unit. This requires disaggregated analysis of institutional data, including climate surveys, hiring and retention data, and student success data.
In conjunction with support from leadership, everyone can help move the needle:
- Engage in professional development designed to explore personal beliefs and practices.
- Stay updated on the changing landscape of DEI issues with newsletters, blogs, and social media.
- Get involved with affinity groups—those that align with your personal identity and groups in which you can learn to be an ally.
The Data: Institutional Practices
“DEI” means different things to different people. In open-ended data, many respondents reported that DEI is included in strategic plans, goals, policies, and programs. Some provided deeper context for what DEI means at their institution:
“DEI is practiced at my university by allowing so many different groups of cultural designation to practice and observe their traditions and religions right within the school’s boundaries, including myself. My school is always at the forefront of heritage appreciation initiatives, exploring and teaching distant cultures and supporting the equity of student-body initiatives.”
“Diversity is actively promoting and supporting a community of different people and ideas.”
“There are restorative practices and affinity groups to help everyone find a place to be heard while DEI goals are being met.”
Actions speak louder than words. The EDUCAUSE CIO’s Commitment on Diversity, Equity, and Inclusion and the upcoming EDUCAUSE Guide to Diversity, Equity, and Inclusion outline several key actions that individuals can take to promote DEI in their workforce. In this QuickPoll we asked respondents about their level of agreement with a list of statements related to the degree to which the CIO commitment is being put into practice at their institution. Notable findings include the following:
- Most respondents (83%) agreed or strongly agreed with the statement “I am aware of the challenges and opportunities related to DEI in higher education.” Fewer (70%) agreed or strongly agreed that leaders at their institution are aware of these challenges and opportunities.
- Nearly three-quarters of respondents agreed or strongly agreed that their institution supports programs to create opportunities and reduce barriers for underrepresented students to succeed (74%) or supports and advocates for DEI practices (72%). Fewer (64%) agreed or strongly agreed that their institution has resources and tools for supporting DEI practices.
- Fewer than half of respondents (48%) agreed or strongly agreed that members of historically underrepresented groups, including people of color, women, members of the LGBTQIA+ community, and individuals with disabilities, have sufficient opportunities to be professionals and leaders at their institution. The rest of the respondents were nearly evenly split between those who disagreed (27%) and those who were neutral or said they didn’t know (26%).
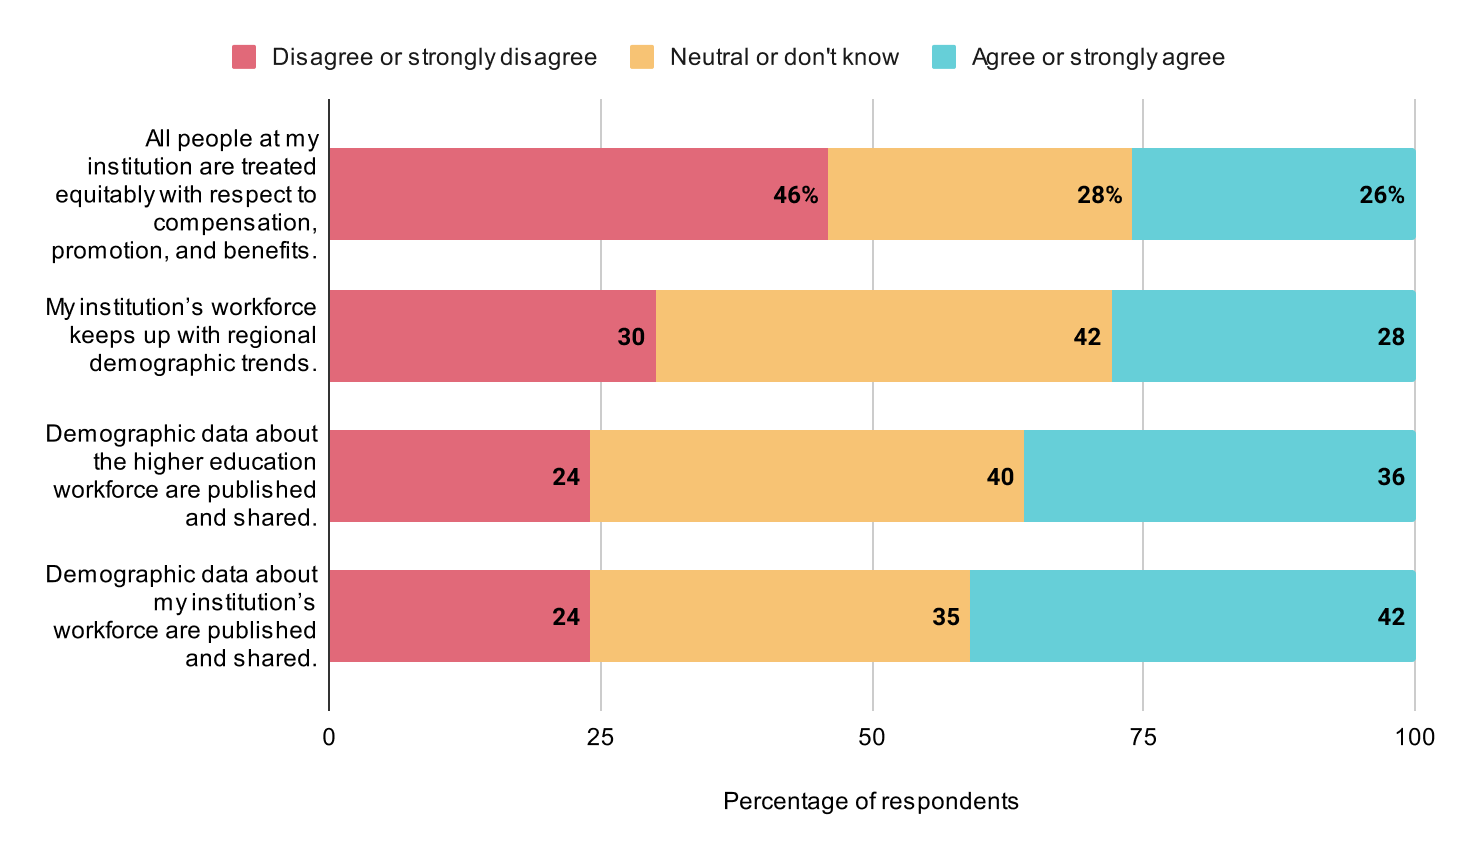
Show me the data! Only 26% of respondents agreed or strongly agreed that all people at their institution are treated equitably with respect to compensation, promotion, and benefits (see figure 1). Similarly, just 28% agreed that their institution’s workforce keeps up with regional demographic trends. Meanwhile, only 36% agreed that demographic data about the higher education workforce are published and shared, while 42% agreed that demographic data about their institution’s workforce are published and shared, making it difficult for stakeholders to really know how their institution measures up.Footnote2
As institutions work toward inclusion, a lot of people are left out. One of the biggest challenges for institutional leaders is ensuring that DEI efforts are truly inclusive. Respondents explained that many types of diversity are left out of DEI policies and programs at their institution.
“DEI is present in…aspects that are popular to recognize at this time (race, gender, sexual orientation). However, underlying and less popular issues (religion and age bias) are not addressed, and therefore diversity, equity, and inclusion are not fully practiced at my institution.”
“We have a diversity and inclusion team that strives to make our university more inclusive towards various [ethnic groups]. It needs to include those with disabilities as well.”
The biases baked into institutional processes and a lack of diversity among decision-makers were top concerns for respondents who were not satisfied with their institution’s DEI efforts.
“The mentalities of the administration and staff continue to reflect outdated beliefs, including racial prejudice, sexism, and other forms of clique-formation and social stratification. The amount of support and resources is largely contingent upon the sentiments and biases of the resource-granting department/personnel.”
The Data: Strategic Plans
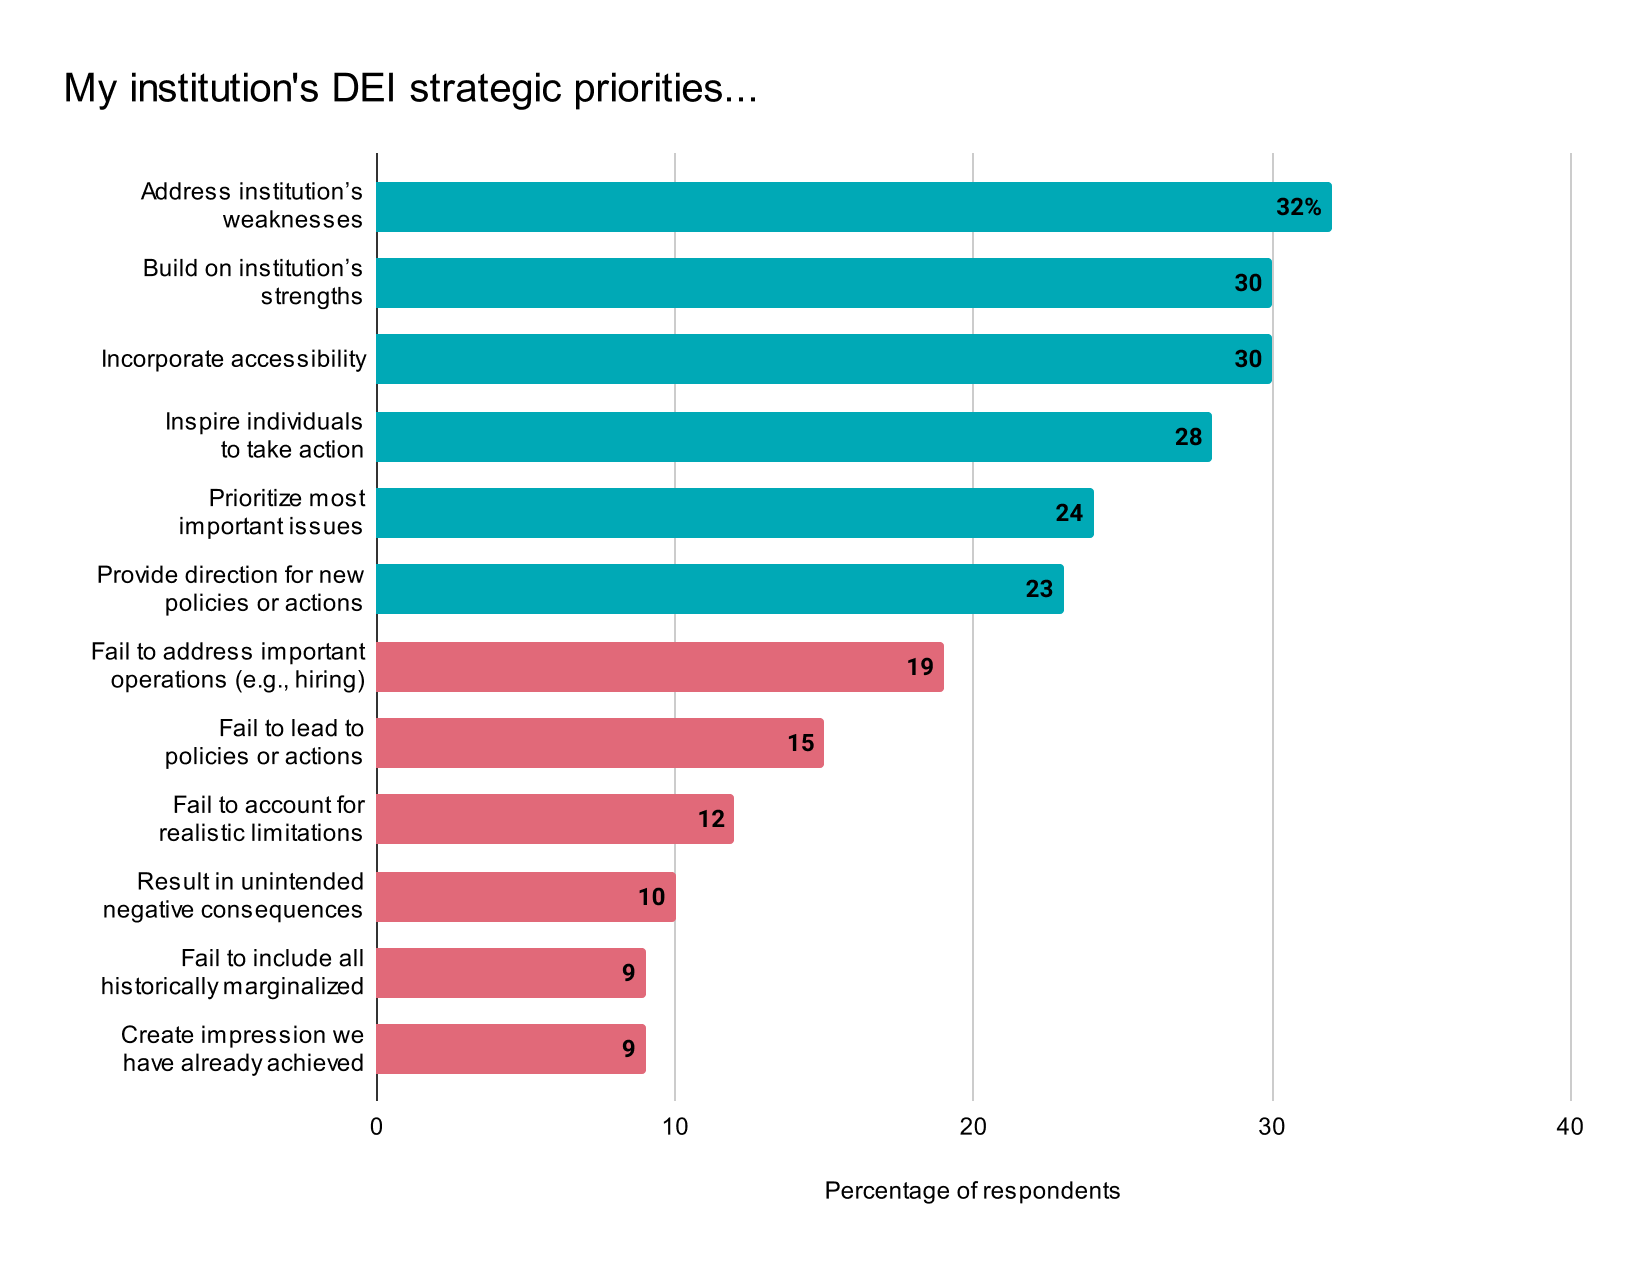
The inclusion of DEI priorities (possibly) improves strategic plans. Most respondents (69%) reported that DEI is included as part of their institution’s strategic plan. When asked about their impressions of what these DEI priorities actually accomplish, respondents more commonly selected positive outcomes—such as addressing their institution’s weaknesses (32%) or building on their institution’s strengths (30%)—than they did negative outcomes (see figure 2). At the same time, though, respondents indicated that there is work to be done. Nearly a fifth (19%) indicated that the DEI priorities in their institution’s strategic plans fail to address important operational aspects such as hiring and retention. Some respondents reported that DEI priorities fail to lead to relevant policies or actions (15%) or fail to account for the realistic limitations at their institution (12%). These concerns are supported by open-ended responses asserting that DEI statements tend to be performative and lack tangible impacts.
“In practice, it feels like a lot (not all) of it is for optics.”
“It’s preached but not demonstrated. We’re forced to do it as an ‘also’ rather than as a core part of our work. So, it’s a checkbox for the administration.”
“There is a good deal of pomp and circumstance with no actual practice to back things up. The university published broad goals with no actions behind them. There are no visible resources, no goals, guidance, or oversight that trickles down to individuals…. DEI ‘initiatives’ are a checkbox, not a priority at all levels.”
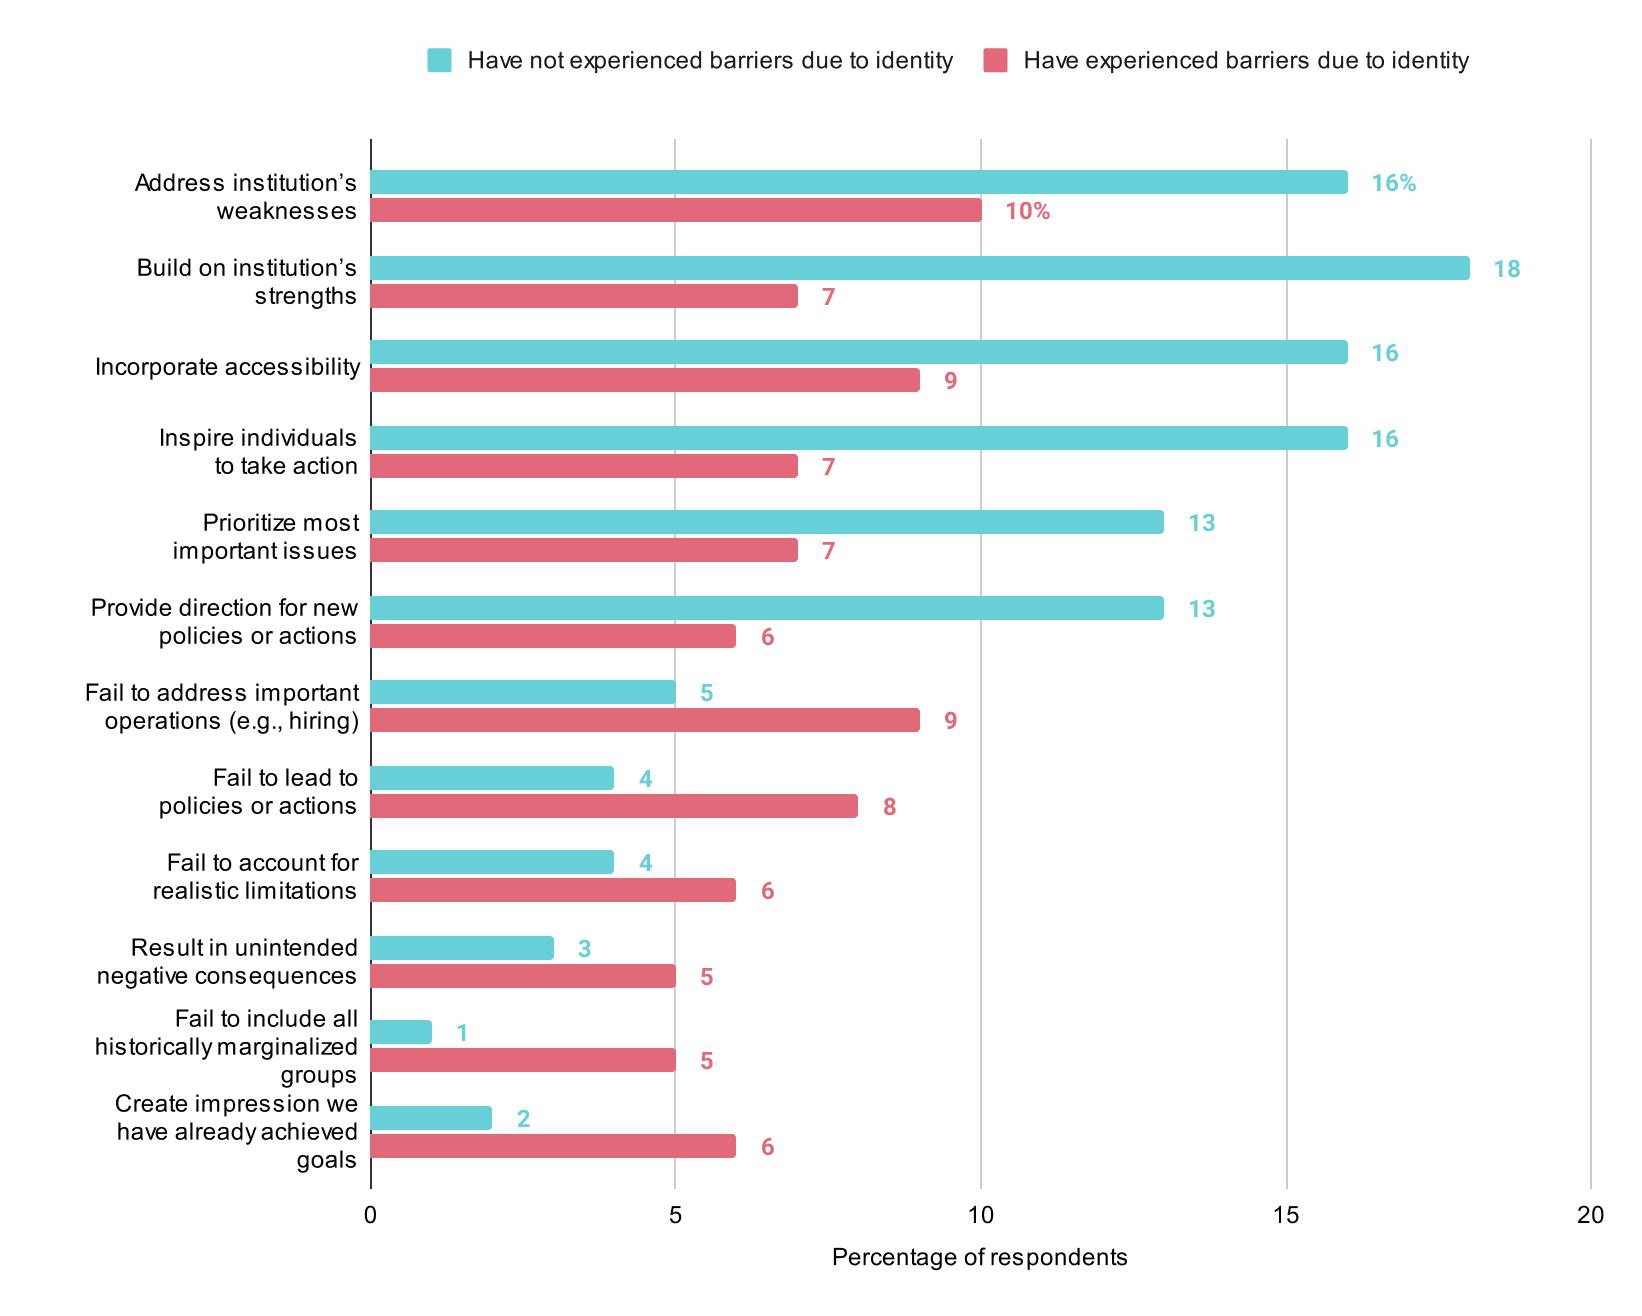
If you know, you know. Respondents’ impressions of the actual outcomes of institutional strategic DEI plans were linked to their firsthand experiences in the workplace. More than one-third of respondents (35%) reported that they had encountered professional barriers or limitations due to certain aspects of their identity. Every positive response option about the real outcomes of DEI priorities was roughly twice as likely to be selected by respondents who had not faced professional barriers due to their identity. Among the negative options, the proportions are flipped—every item was more likely to be selected by respondents who had experienced professional barriers due to their identity (see figure 3). In particular, respondents who had confronted such barriers were five times more likely to report that their institution’s DEI priorities fail to include all types of historically marginalized groups and three times more likely to report that the DEI statements create the impression that members of their institution have already achieved DEI goals. These results underscore the importance of disaggregating data to understand the differential experiences of people from marginalized groups.
Common Challenges
A prominent theme in these data was the absence of tangible activities and measurable outcomes related to institutional DEI goals and strategic plans, a concern that has been echoed in EDUCAUSE research findings for years.Footnote3 Additionally, respondents expressed that DEI efforts tend not to be truly inclusive, addressing popular topics but overlooking certain historically marginalized groups. This is another persistent EDUCAUSE research finding.Footnote4
Promising Practices
Institutional change requires coordinated top-down and bottom-up action. Respondents described the following institutional elements that support DEI at their institution:
- Tangible support (i.e., resources for action) from leadership, including presidents, chancellors, cabinets, and advisory boards
- High-level administration (e.g., vice president, vice provost), mid-level administration (e.g., deans, directors), and staff positions dedicated to supporting DEI activities
- Action plans to support DEI goals at every level, from institution-wide to unit-specific
- HR policies that both improve hiring practices (e.g., recruiting from diverse groups of communities) and extend beyond hiring practices (e.g., integrating DEI goals into formal evaluations)
- Faculty development addressing specific actions (e.g., equitable syllabi) and courses that teach students about inclusion and accessibility
- Staff professional development addressing specific actions (e.g., modifying professional vocabulary to eliminate inappropriate legacy terms)
- Regular check-ins with faculty, staff, and students; disaggregation and publication of institutional data for all analyses
- Small-scale discussion groups, affinity groups, and communities of practice; peer listening sessions conducted by trained facilitators
- External consultants for activities such as training programs and climate surveys
- DEI advocates on search committees
- Fellowships supporting members of underrepresented groups
Respondents described the following personal actions they have taken or are taking to support DEI at their institution:
- Adhering to the CIO’s Commitment on Diversity, Equity, and Inclusion
- Mentoring new staff
- Learning how microaggressions are experienced and how to prevent them
- Reflecting on personal biases that can influence workplace interactions
- Revising syllabi and student assessments to be more authentic and inclusive
- Participating in affinity groups such as Women in Technology (WIT)
- Making sure that all employees feel welcome and are visible in meetings and celebrating employees’ accomplishments as often as possible
- Using a style guide, such as the EDUCAUSE Inclusive Language Guide, and raising concerns about discriminatory or offensive language used by anyone in the workplace, including third-party representatives (e.g., vendors)
- Actively listening to colleagues and asking questions with the intent to understand
- Participating in DEI-focused committees and advisory groups
- Engaging with action-oriented professional development such as Anti-Racism in Academia (ARiA): A Learning Journey
- Applying for grants to support DEI work
- Wearing a pronoun pin and verifying a colleague’s pronouns before talking or writing about them in the third person
- Including disability and other dimensions of underrepresentation as a component of DEI efforts
Visit the EDUCAUSE Showcase Steering Analytics Toward an Equitable Future for resources on using analytics tools to support DEI goals.
All QuickPoll results can be found on the EDUCAUSE QuickPolls web page. For more information and analysis about higher education IT research and data, please visit the EDUCAUSE Review EDUCAUSE Research Notes topic channel, as well as the EDUCAUSE Research web page.
Notes
- QuickPolls are less formal than EDUCAUSE survey research. They gather data in a single day instead of over several weeks and allow timely reporting of current issues. This poll was conducted between May 16 and May 17, 2022, consisted of 11 questions, and resulted in 454 complete responses. The poll was distributed by EDUCAUSE staff to relevant EDUCAUSE Community Groups rather than via our enterprise survey infrastructure, and we are not able to associate responses with specific institutions. Our sample represents a range of institution types and FTE sizes. Jump back to footnote 1 in the text.
- Exact response rates for this item are as follows. Disagree or strongly disagree: 23.8%; Neutral or don’t know: 34.7%; Agree or strongly agree: 41.6%. Jump back to footnote 2 in the text.
- Susan Grajek, “EDUCAUSE QuickPoll Results: The CIO’s Role in Diversity, Equity, and Inclusion,” EDUCAUSE Review, July 17, 2020. Jump back to footnote 3 in the text.
- Mark McCormack and Jamie Reeves, “EDUCAUSE QuickPoll Results: Diversity, Equity, and Inclusion,” EDUCAUSE Review, April 30, 2021. Jump back to footnote 4 in the text.
Jenay Robert is Researcher at EDUCAUSE.
© 2022 Jenay Robert. The text of this work is licensed under a Creative Commons BY-NC-ND 4.0 International License.