
Discrimination continues to be a challenge for the higher ed IT profession, but the events of the past year have raised awareness of DEI and may present opportunities for concerted action.

EDUCAUSE is helping institutional leaders, IT professionals, and other staff address their pressing challenges by gathering and sharing data. This report is based on an EDUCAUSE QuickPoll.Footnote1
EDUCAUSE would like to acknowledge and thank members of the Diversity in IT Community Group for their collaboration on this week's QuickPoll survey and report—their leadership in initiating this research, helping craft the survey questions, and reviewing this article.
The Challenge
The challenge of diversity, equity, and inclusion (DEI) in higher education IT continues to be too little of each of those characteristics in the profession.Footnote2 Women are underrepresented in positions of senior IT leadership. Higher ed IT is predominantly White. Younger professionals are overlooked and undervalued. These disparities are stubborn and pervasive, but in the spirit of ongoing exploration and learning—and our stubborn and pervasive hope—we undertake a fresh examination of DEI issues in this QuickPoll.
The Bottom Line
Patterns of systemic discrimination in the higher ed IT profession persist, following well-worn paths of gendered and racial injustices and showing no signs of becoming any less pervasive and complex than they have been in decades past. And yet as higher education emerges from an extraordinary period of disruption and heightened awareness around issues of DEI, there may be no better moment for catalyzing change.
The Data: Forms of Discrimination
For this week’s QuickPoll we asked an additional series of demographic questions to better understand who responded to the survey and, where possible,Footnote3 to enable reporting along important dimensions of identity:
- Age: 36% of our respondents were age 44 or younger, 31% were between the ages of 45 and 54, and 32% were age 55 or older.
- Gender: The majority of respondents identify as female (62%); about a third (35%) identify as male and another 3% as nonbinary.
- LGBTQ+: 19% of our sample identified as being members of the LGBTQ+ community.
- Ethnicity: Over two-thirds (69%) of respondents self-reported as White, 7% as Black / African American, 5% as Asian, and 3% as Hispanic/Latinx, with another 16% identifying as other or multiple ethnicities.
- Disability: 12% of our sample identified as having a disability.
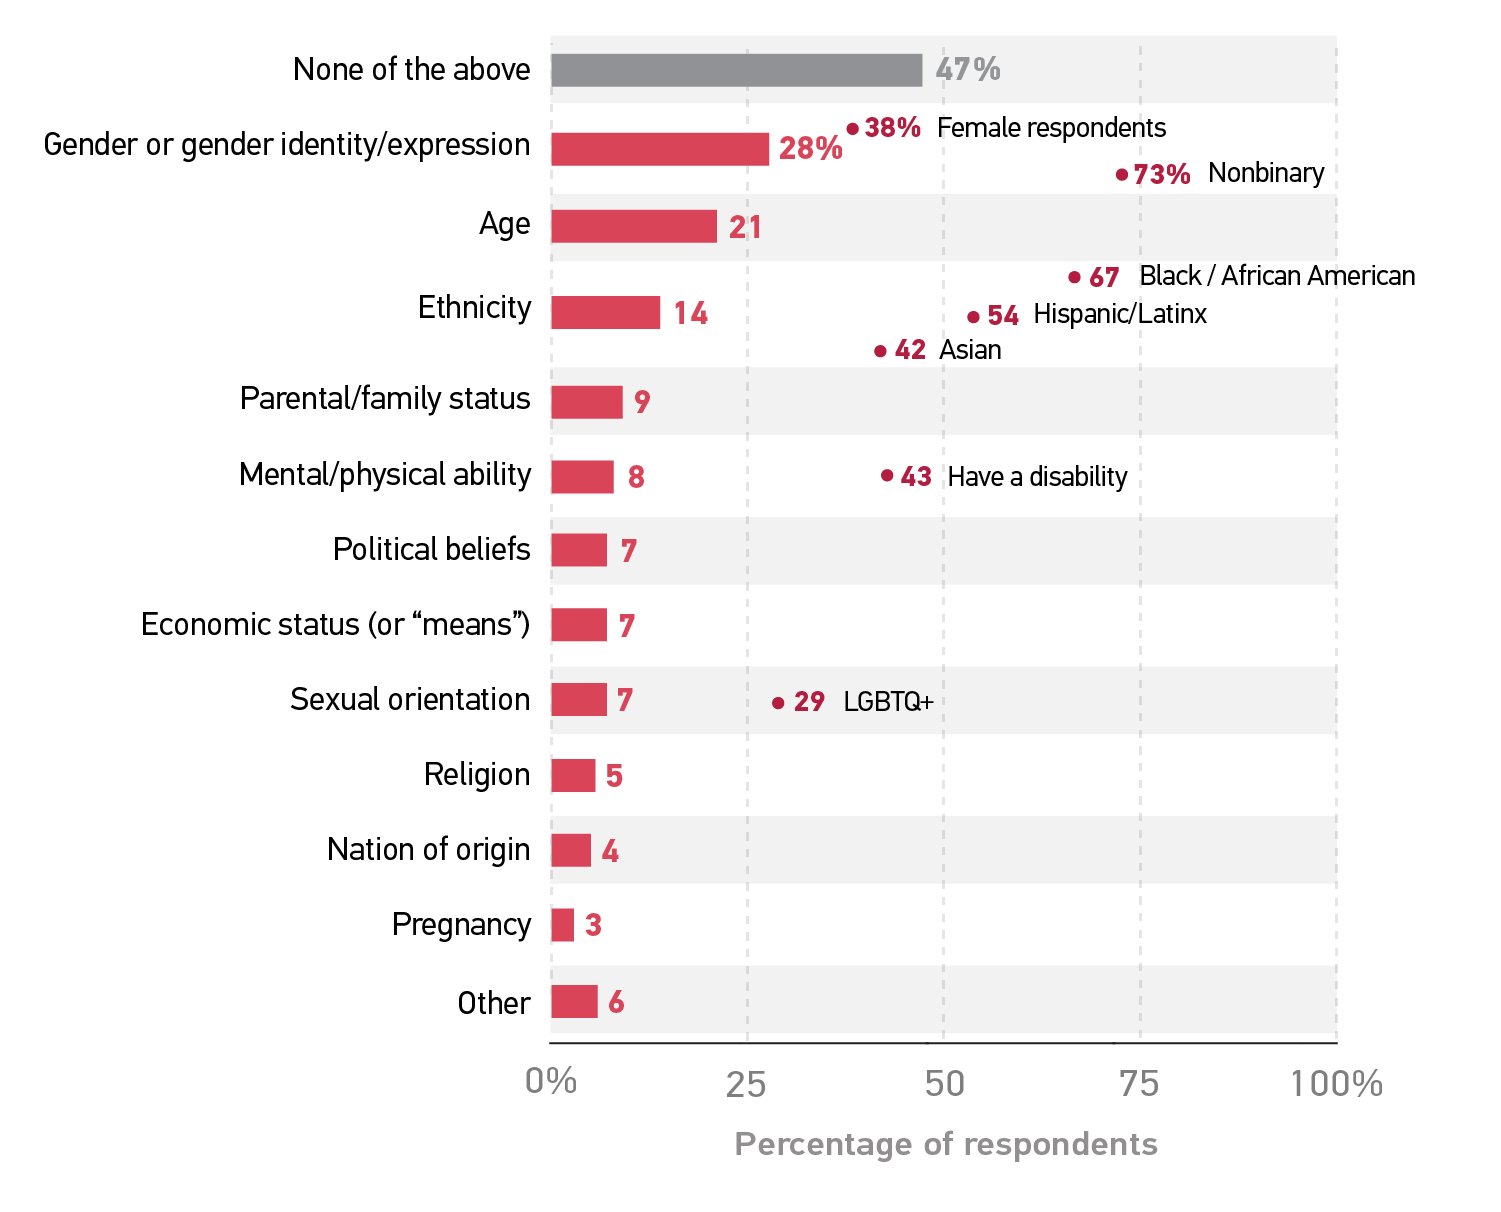
Key identity markers are associated with primary forms of discrimination. Respondents most commonly reported experiencing discrimination on the basis of gender, age, and ethnicity, though “None of the above” received the plurality of responses (see figure 1). Certain identity markers, however, are more salient than others—gender discrimination, for example, is far more common among female and nonbinary respondents (38% and 73%, respectively, compared with 7% among males), while ethnicity-based discrimination is more common among Asian, Hispanic/Latinx, and Black / African American respondents (42%, 54%, and 67%, respectively) than among those who identify as White (2%).
The Data: Experiences of Discrimination
Roles and opportunities are restricted. Answering phones, taking notes, and retrieving coffee are all tasks historically assigned to women in office settings, positioning them as subservient to their male colleagues. Traditions often hinder growth, and in this survey women were nearly twice as likely as men to report being assigned to roles or tasks that conform to a stereotypical identity (40% versus 21%), while also being slightly more likely to report being held to a higher performance standard (42% versus 35%). Potential for growth in an organization is a driving motivation for most employees, but being overlooked for a job opportunity or promotion is a reality for more than half (52%) of Black / African American respondents, compared with 36% of White respondents.
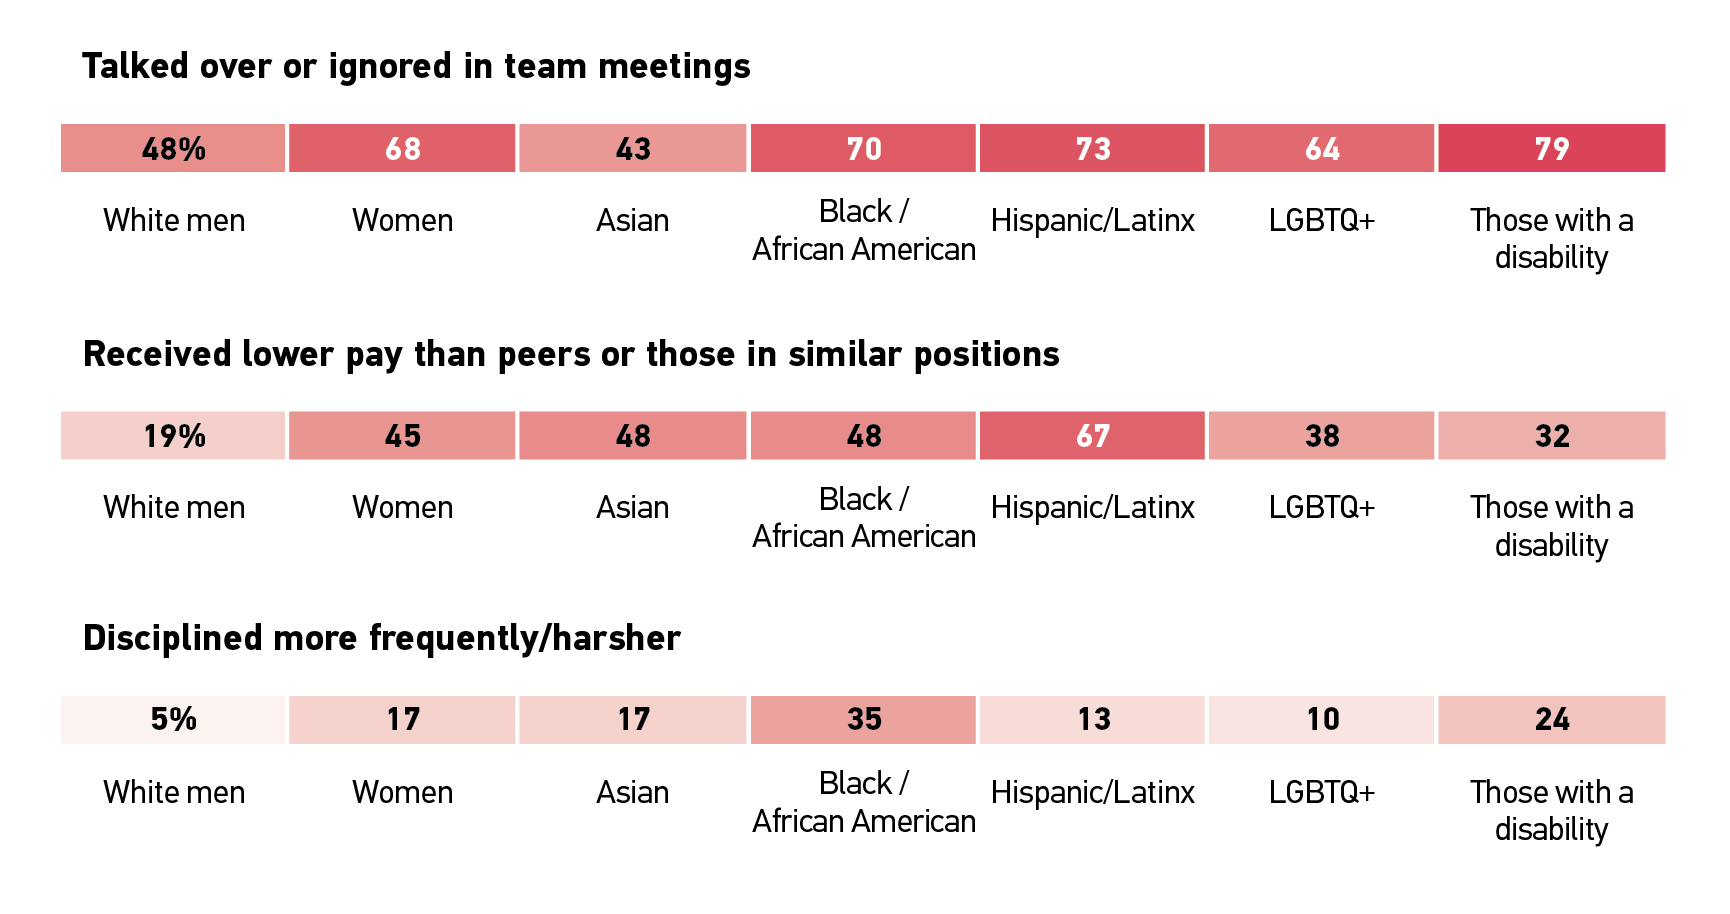
Institutional benefits and supports are restricted. Only 19% of White men reported receiving lower pay than peers or those in similar positions, compared with 45% of women, 48% of Black / African American and Asian respondents, and 67% of Hispanic/Latinx respondents (see figure 2). Although the Americans with Disabilities Act became law over 30 years ago, many still encounter obstacles. Among those with a disability, almost a third (32%) said they were denied accommodations for their disability, and 79%—the highest of any group—reported being talked over or ignored in team meetings. Reports of inequitable discipline were far more common among those with a disability and Black / African American respondents than among other respondents.
The Data: What Are Institutions Doing?
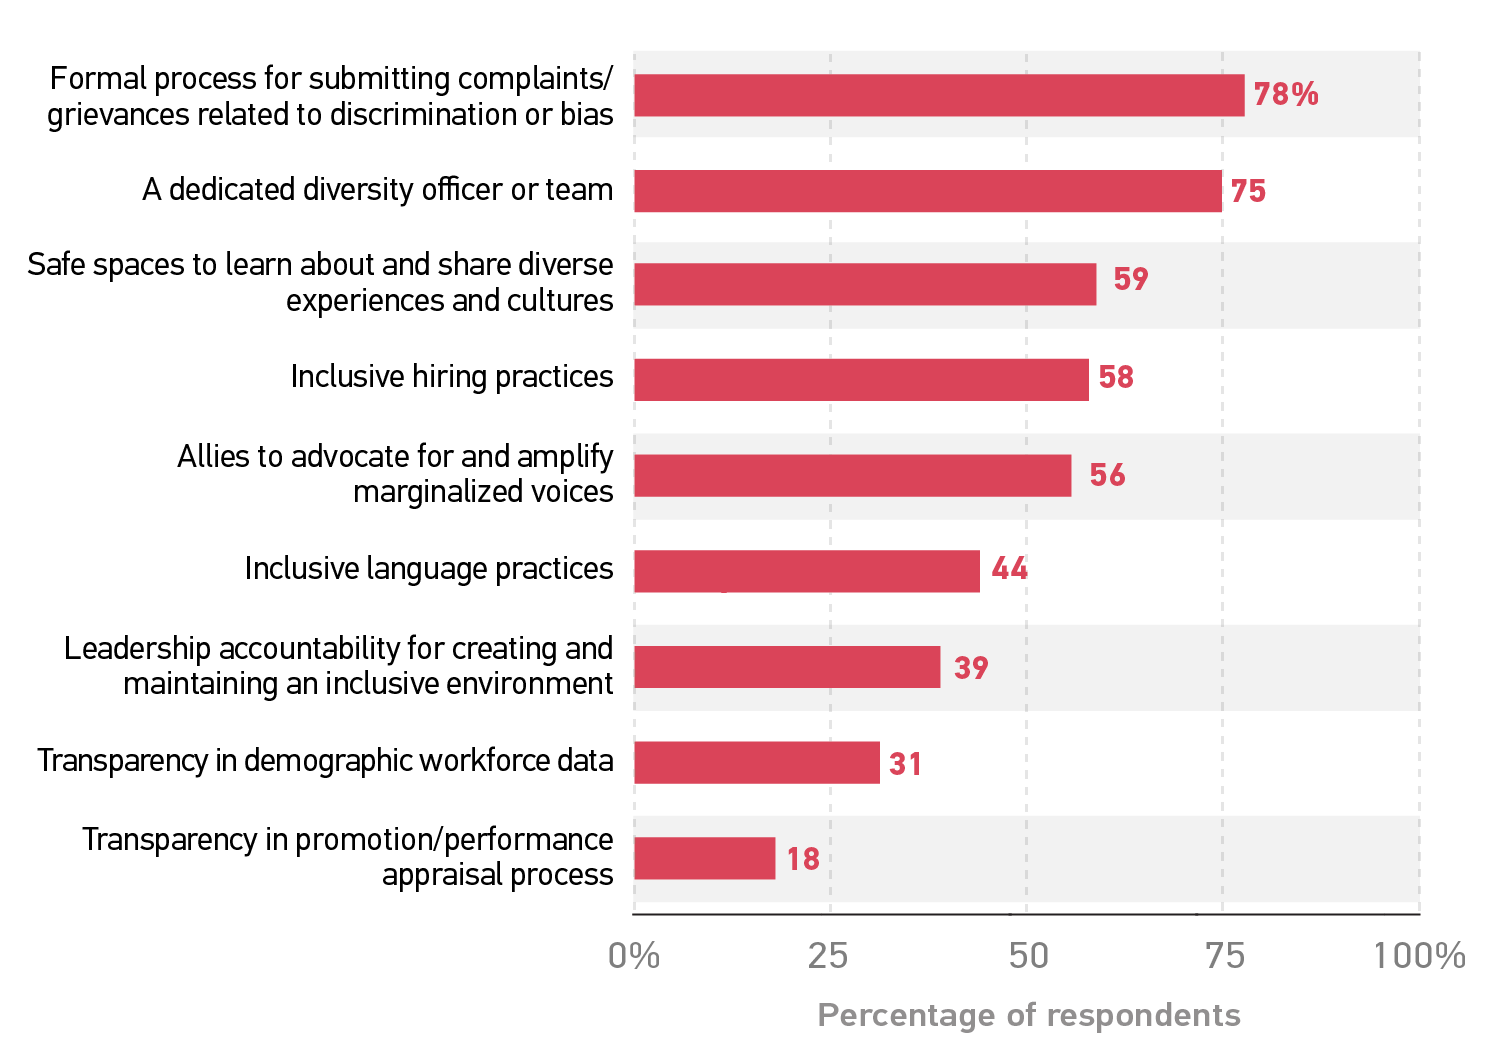
Institutions need to implement deeper and more systemic practices. Asked about DEI practices currently in place, the majority of respondents indicated that their institution has a formal complaint process (78%) and a dedicated diversity officer or team (75%) (see figure 3). Far fewer respondents reported practices that may be indicative of a deeper and more systematic commitment to DEI, including transparency in demographic workforce data and in promotion/performance appraisals (31% and 18%, respectively) and leadership accountability for creating and maintaining an inclusive environment (39%).
Institutions are doing okay … depending on who is being asked. For certain DEI practices, answers from White respondents were considerably more favorable than those from their Black / African American and Hispanic/Latinx counterparts (see table 1), likely reflecting very real differences in the lived experiences of these groups.
Table 1. Perceptions of Institutional DEI Practices, by Race/Ethnicity
| Institutional Practice | White | Black / African American | Hispanic/Latinx |
|---|---|---|---|
|
Safe spaces to learn about and share diverse experiences and cultures |
64% |
47% |
46% |
|
Leadership accountability for creating and maintaining an inclusive environment |
43% |
24% |
15% |
|
Allies to advocate for and amplify marginalized voices |
61% |
42% |
38% |
|
Inclusive hiring practices |
64% |
34% |
42% |
|
Inclusive language practices |
47% |
29% |
35% |
Events of the past 12 months have raised awareness. If ever there is an ideal moment for institutions to press forward with meaningful change in creating equitable and inclusive work environments, our present moment of disruption and increased awareness may very well be it. When asked whether they’ve observed an increased awareness around DEI at their institution over the past 12 months, 87% of respondents agreed or strongly agreed. Importantly, agreement with this sentiment generally holds across demographic categories—90% among women, 94% among LGBTQ+ respondents, 81% among respondents with a disability, 89% among Asian respondents, 84% among Black / African American respondents, 86% among Hispanic/Latinx respondents, and 87% among white men.
Common Challenges
The higher education workforce and leadership should be more diverse. Many respondents commented that institutional staff and leaders are not as diverse as they could and should be. Perhaps nothing is as revealing of an institution’s commitment to this issue as the DEI reflected in the persons to whom it has entrusted its leadership and operations. Far from being left to chance or goodwill, building a diverse and inclusive workforce requires intentionality and measurable goals—factors sorely lacking at many institutions in their hiring and personnel practices.
What do the data show? Improvements in hiring and personnel management will rely on data and transparency around institutions’ staff demographics, pay, and other indicators of a truly diverse, equitable, and inclusive workforce. These practices are lacking at most institutions (see figure 3), but respondents think that workforce data transparency is an area where their institution could do better to advance DEI.
The institution is willing, but the coordination is weak. Your president shares inspiring messages of equity and inclusivity, and your institution has hired a diversity officer as point person for DEI programming. Yet day-to-day implementation of DEI best practices is evident in only a few departments, and “middle management” is not consistently functioning as a conduit of the president’s vision. Absent strategies for cross-department communication and coordination, these “on the ground” realities can be barriers to meaningful DEI advancements.
Promising Practices
Training makes a measurable difference. Previous EDUCAUSE research has advocated for DEI training at institutions, finding that “DEI training has a positive and significant impact on the affective and attitudinal dispositions of higher education IT employees.”Footnote4 Comments from this poll further support these findings, with many highlighting routine staff and faculty training as evidence that their institution is making measurable progress in advancing DEI.
Leadership matters. When the institution’s president and senior leadership explicitly make DEI a priority, the staff take notice. When presidents share personal messages about DEI experiences, or share openly about where they’ve fallen short, or establish personal DEI-related goals, such actions help establish DEI as a part of the institution’s culture. Many respondents noted that their institution had recently hired a diversity officer or similar position, but they also observed that the additional steps of situating that position on the president’s cabinet or integrating it into the institution’s strategic operations helped ensure that the position wasn’t merely symbolic.
DEI isn’t an isolated initiative—it’s a part of everything we do. When DEI programs seem tacked-on or otherwise isolated from the normal running of the institution, they can be met with skepticism, and perhaps rightly so. On the other hand, some respondents shared experiences of a DEI focus deeply woven into the fabric of their work—as a guiding value in hiring practices or as a foundational element of their curriculum. When DEI is no longer a “box we check” but instead a consistent feature of “the way we do things,” staff recognize it as something ingrained into the institution’s identity and as core to the mission of higher education.
All QuickPoll results can be found on the EDUCAUSE QuickPolls web page. For more information and analysis about higher education IT research and data, please visit the EDUCAUSE Review EDUCAUSE Research Notes topic channel, as well as the EDUCAUSE Research web page.
Notes
- QuickPolls gather data in a single day instead of over several weeks, are distributed by EDUCAUSE staff to relevant EDUCAUSE Community Groups rather than via our enterprise survey infrastructure, and do not enable us to associate responses with specific institutions. Jump back to footnote 1 in the text.
- The poll was conducted on April 27, 2021, consisted of 15 questions, and resulted in 530 complete responses. Poll invitations were sent to participants in EDUCAUSE Community Groups focused on IT leadership and diversity in IT. Our sample represents a range of institution types and FTE sizes, and most respondents (98%) represented US institutions. Jump back to footnote 2 in the text.
- Statistical confidence in some of these findings may be diminished in certain areas, especially where additional layers of variables (e.g., isolating by ethnicity and then by gender) significantly reduced our sample size. We urge a reasonable level of caution in interpreting and generalizing from these results, and we encourage responsible use of these findings as rough and preliminary approximations. Jump back to footnote 3 in the text.
- Dana C. Gierdowski and D. Christopher Brooks, Diversity, Equity, and Inclusion in the IT Workforce, 2019, research report (Louisville, CO: EDUCAUSE, August 2019). Jump back to footnote 4 in the text.
Mark McCormack is Senior Director of Analytics & Research at EDUCAUSE.
Jamie Reeves is Senior Product and Portfolio Manager at EDUCAUSE.
© 2021 Mark McCormack. The text of this work is licensed under a Creative Commons BY-NC-ND 4.0 International License.