
Data analytics can be used to inform the design of faculty professional development programs, ensuring that educational content is aligned with faculty interests and needs, ultimately strengthening engagement and completion rates.

In today's data-driven higher education landscape, institutions are increasingly leveraging data analytics to enhance teaching and learning practices, improve administrative efficiency, and boost program effectiveness.Footnote1 As digital transformation accelerates, faculty development programming must adapt to support rapidly changing technological demands. In this context, data analytics provides actionable insights that inform strategic planning and resource allocation, both of which are crucial for effective faculty development.Footnote2 Colleges and universities can leverage data analytics to gather and analyze faculty feedback, using these insights to shape faculty development programs and ensure that faculty members' needs and interests are at the forefront of program planning. This article describes a project, conducted at a nonprofit private university, that used data analytics to guide faculty development programming.
Integrating Data Analytics into Faculty Development
Participants and Apparatus
This project began with a survey distributed to all faculty members at the university, which at the time employed nearly 250 faculty members. The university comprises three colleges: the College of Medicine (COM), the College of Nursing (CON), and the College of Science and Health (COSH).
A total of eighty-nine faculty members participated in the survey, including nineteen who were part of the initial cohort that completed the faculty development program. This faculty development program, funded by the Thurgood Marshall College Fund (TMCF) and in partnership with the Association of College and University Educators (ACUE), aims to strengthen student success and equity through quality instruction. The participating faculty members held various academic rankings, such as instructor (N=15), assistant professor (N=25), associate professor (N=13), and professor (N=17).
The goals of the survey were to identify the number of faculty members interested in participating in the faculty development program, gather their academic information (such as affiliations and academic rankings), and assess their interest in specific microcredential topics. The survey results will be used to strategically plan future faculty development initiatives.
Data Collection and Preparation
To assess faculty interest in participating in the program and their preferences for microcredentialing, the project team conducted a six-item interest survey. The survey was primarily composed of multiple-choice questions designed to collect the following information:
- Items one through four: faculty members' academic information (e.g., academic ranking, affiliations)
- Item five: faculty members' ranked interest in the following microcredential topics: promoting active learning online, inspiring inquiry and lifelong learning in your online course, designing learner-centered courses, and creating a productive online learning environment.
- Item six: faculty members' interest in participating in the program, with options of "yes," "maybe," and "no."
The survey was administered electronically over a two-week period with no incentives for participation. The collected data was downloaded into a spreadsheet and analyzed using Power BI, the university's standard tool for conducting institutional and program effectiveness analysis. The data preparation steps included the following:
- Data cleaning and transformation. Unnecessary columns (e.g., start time and completion time) were removed, and data types were verified to ensure accuracy.
- Data filtering. Redundant submissions by the same faculty were identified and removed. Responses from faculty members who were part of the initial cohort were also identified and removed using a data merging function, resulting in seventy valid responses.
- Data structuring. To effectively structure the survey data, we used a star schema model. This model consisted of a central fact table (the survey responses) and two dimension tables for academic rankings and microcredential preferences. This approach established the necessary relationships for data analysis and is detailed in figure 1.

Data Analysis and Visualization
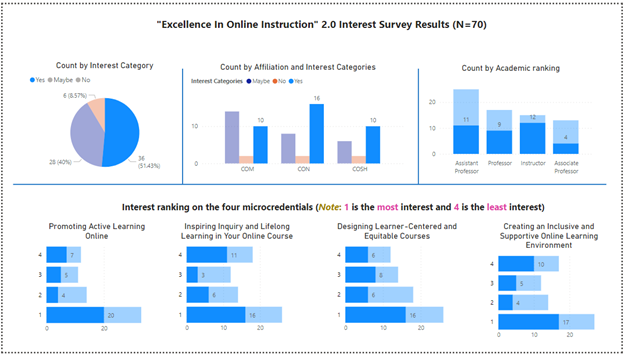
Preliminary analysis involved using count data for each survey item. This data helps provide insight into the number of faculty members interest in participating in the faculty development program, the distribution of their academic information, and their ranked interest in the microcredential topics. A dynamic dashboard was created to help senior academic administrators understand the data and inform decision-making and program planning. For this project, the data was categorized by faculty interest in participating in the faculty development program (i.e., interest category). The interest category was used as a filter to refine the count of other data for program decision-making and planning. The dashboard includes the following visuals (see figure 2):
- Pie chart. This chart displays the count and percentage of faculty interest in participating in the program across three categories (yes, maybe, and no).
- Clustered column charts. These charts show the count of faculty based on their affiliations and academic rankings.
- Clustered bar charts. These charts illustrate the count of faculty interested in the various microcredentials.

Results and Strategic Implications
The data-driven approach had positive outcomes and informed the next phase of the faculty development program at the institution:
- Informed decision-making. The survey results indicated that thirty-six faculty members were interested in participating in the program, and another twenty-eight expressed a "maybe" interest. These faculty members came from different colleges within the university and held various academic rankings (see figure 3). This data was crucial for senior academic administrators, who decided to apply for a grant to continue recruiting faculty enrolled in the program. The report generated from the business analytics platform was included in the grant application as evidence of faculty interest. Figure 3. Data of Faculty Interested in Participating in the Program
- Strategic program planning. The faculty development program administrators used the faculty data as guidelines during discussions to select two microcredentials for the program. This ensured that the offerings aligned with faculty needs and preferences.
- Successful recruitment and completion rates. The program administrators successfully recruited thirty-two faculty members who agreed to participate, and the resulting cohort achieved a 97 percent completion rate for the first course. Twenty-four faculty members from the first-course completers were recruited for the second course, and all of them agreed to participate. This cohort achieved a 92 percent completion rate. Several key factors contributed to these high completion rates, including the dedication and hard work of faculty members, their self-regulation strategies such as time management and effort regulation, and the relevance and quality of the microcredentials.Footnote3 Additionally, the strong partnership between the program stakeholders facilitated smooth course delivery and support.
- Enhanced faculty engagement. The use of data analytics fostered a culture of evidence-based practice, encouraging the university to integrate faculty ownership into professional development opportunities. This approach strengthened faculty engagement and commitment, contributing to the overall success of the program.
Conclusion
This project showcases the transformative potential of data analytics in faculty development, enabling institutions to make informed decisions that improve educational outcomes and program effectiveness. In the context of digital transformation in higher education, analytics play a crucial role in enhancing program planning, efficiency, and instructional quality. By leveraging data analytics, this private nonprofit university was able to gather and systematically analyze faculty feedback, guiding decisions about the direction of faculty development programs while keeping faculty interests central to the planning process. Strong recruitment and high completion rates demonstrate how data-driven approaches can foster engagement and commitment. As institutions continue to navigate the complexities of faculty development, analytics remain indispensable for promoting continuous improvement and evidence-based practice. Looking ahead, embedding data analytics as a core component of strategic planning ensures programs are more responsive, effective, and tailored to the evolving needs of educators and students alike.
Notes
- Zilong Pan et al.,"A Systematic Review of Learning Analytics: Incorporated Instructional Interventions on Learning Management Systems," Journal of Learning Analytics 11, no. 2 (2024): 52–72.Jump back to footnote 1 in the text.
- Ana Stojanov and Ben Kei Daniel,"A Decade of Research into the Application of Big Data and Analytics in Higher Education: A Systematic Review of the Literature," Education and Information Technologies 29 (2024): 5807–5831. Jump back to footnote 2 in the text.
- Dongho Kim et al., "Self-Regulated Learning Strategies and Student Video Engagement Trajectory in a Video-Based Asynchronous Online Course: A Bayesian Latent Growth Modeling Approach," Asia Pacific Education Review 22 (2021): 305–317.Jump back to footnote 3 in the text.
Hua Zheng is Assistant Professor and Curriculum Manager at Charles R. Drew University of Medicine and Science.
William Shay is Associate Provost and Accreditation Liaison Officer at Charles R. Drew University of Medicine and Science.
© 2025 Hua Zheng and William Shay. The content of this work is licensed under a Creative Commons BY-SA 4.0 International License.