
Officials at UC Irvine and Unicon used the EDUCAUSE Student Success Analytics Rubric to evaluate the UCI Compass initiative, generating valuable insights that can assist other institutions as they assess their own student success initiatives.

In 2023, the Student Success Analytics Rubric (SSA Rubric) was developed to support the Framework for Student Success Analytics, as part of the work of the EDUCAUSE Student Success Analytics Community Group to advance research and provide tools to institutions seeking to better understand and improve their use of analytics to improve student outcomes. The rubric, which addresses the areas of Preparedness, Outcomes, Analysis, and Decisions, helps academic institutions as they work to become data-driven decision-making organizations.
The UC Irvine Comprehensive Analytics for Student Success (UCI Compass) initiative at the University of California, Irvine, was born out of efforts beginning in 2016 of leadership engaging intentionally with data evidence around student success. These original efforts were formally endorsed by the Undergraduate Student Senate as essential for supporting their own success, thus forming a vital bond in data-driven student success based on equity and excellence. At its core, Compass aims to integrate diverse data resources, organizational capacities, and interdisciplinary efforts to tailor and enhance the academic and personal journey of students. This initiative represents a pivotal step toward promoting educational equity and redefining the aspirations of the American Dream.
"We are an organization, a business with over 50,000 constituents, in the form of students, patients, faculty members, doctors, staff, who are making decisions every day. In a data-driven organization, we have to make better decisions today than we did yesterday, consistently make them better, make them faster, and increasingly at scale."Footnote1
—Tom Andriola, UC Irvine
Using the SSA Rubric, staff at UC Irvine joined forces with the EDUCAUSE Student Success Analytics Community Group and Unicon Inc. to assess the current state and maturity of the UCI Compass initiative. Cross-departmental UCI Compass champions convened a workshop, leveraging the rubric, to provide a means for continuous improvement in institutional analytics that focused on student success. This case study showcases UCI's use of the rubric to identify key practices and how staff there have used results to define priorities and build process improvement plans moving forward. It also serves as a model for practitioners, offering applicable insights into both the Compass initiative and the SSA Rubric for other institutions.
What Is Compass?
The UCI Compass initiative guides data-driven decisions. Compass "[brings] together data assets, organizational capabilities, and interdisciplinary collaboration [and] seeks to personalize and improve the student journey and their ultimate success and serve as a model for advancing educational equity." UCI Compass is guided and powered by strong communities of practice, under the leadership of Astrud Reed, Community of Practice Manager. Leaders at UCI understand that data-driven student success is not something that can be achieved solely by a select group of analysts.
Overseen by the UCI Office of Data and Information Technology, UCI Compass is a campus-wide endeavor to amalgamate relevant data collection and analysis to bolster student achievement throughout the university. Several components contribute to this goal:
- Comprehensive reporting by the Teaching and Learning Analytics (TLA), Enrollment Management Analytics (EMA), Student Affairs Assessment, Research & Evaluation, Career Readiness Analytics, and Office of Institutional Research (OIR) groups
- Foundational research from the UCI Metrics for Undergraduate Student Transitions (MUST) and the Public Evaluation & Research Initiative (PERI²) projects
- Essential collaborations between the School of Education and the Office of the Vice Provost for Teaching and Learning
- Development of an in-house Student Data Warehouse by the OIT Decision Support – Business Intelligence and Data Warehouse team
Through these collective efforts, Compass articulates a model that not only advances educational equity but also sets a benchmark for other institutions aiming to revolutionize the academic experience and success of their students.
What Was Done
The team engaged in various preparatory planning sessions with Compass leaders. During these sessions, the rubric was introduced with its purpose in informing and strengthening the continuous quality improvement cycle. Recognizing that there would be challenges as early adopters, it was emphasized that participants were invited because of their expertise and contributions toward improving services and experiences for UCI students.
An overview of the rubric was presented to the group. The approach was to assess the Compass initiative holistically across the four dimensions of the rubric, at an enterprise level, rather than solely on individual unit contributions. The workshop aimed to attain a broad understanding of the strategy, acknowledging that nuances specific to various units would surface. Detailed discussions were encouraged and were incorporated into overall takeaways and subsequent individual unit reviews.
After the group completed the rubric assessment, results from each individual participant were compiled and displayed in a dashboard. During the review, facilitators utilized visuals to pinpoint subcategories and select questions to engage thematic conversations. Specific selections were examined in more detail based on general consensus of importance within a particular category or a wide spectrum of responses. Each unit identified areas of success and/or challenges through these conversations. The manager of the UCI Compass Community of Practice gathered feedback for review during subsequent Compass meetings.
Observations and Learnings for Compass
UCI operates with a "holistic and longitudinal" approach in its data-driven analytics framework. Highlights of the UCI Compass initiative that surfaced while using the SSA Rubric are the inclusion of student voice, multidimensionality of data, data governance, and the collaborative, multi-divisional data ecosystem.
Student Voice: As described by Patty Morales, UCI Vice Provost for Enrollment Management, in the podcast "Supporting Student Progress through Analytics," students are at the heart of the initiative.Footnote2 Students are part of the decision-making process and are included in many conversations along the way. Multiple types of data are used to inform decisions, and this data comes from a rich ecosystem that allows for access by organization-wide constituents. Faculty members use data to inform conversations they have with their students about educational choices to be made. Specifically, providing transparency about the collection of data and how it is used to inform teaching aids students in understanding the impact that data can have, empowering them to be an integral part of a data-enhanced learning process. Showing students the data and allowing them to be part of the decision-making process in how their data is used—and whether or not they want their data to be used—is important.
In the podcast "Student Success, Deeper Insights Enabled by Data," Morales said:
I felt we had an obligation to make our university receptive to [our students] to ensure that we are keeping pace with who our students are [and] what they're telling us about themselves. […] There's just a wealth of information that, when it's pieced together, helps develop a picture that then can be shared with other colleagues, faculty and deans, and campus planners to ensure that we're keeping ahead of what the students will need.Footnote3
In the same podcast, Diane O'Dowd, UCI Vice Provost for Academic Personnel, HHMI Professor of Developmental and Cell Biology, discussed a teaching initiative that leveraged data to empower student success and change institutional practices:
I think it's really important to know how students are reacting to [changing practices], but it's [also] really important to know how faculty are thinking about these practices and using them. In some of the courses that we taught, there are always things that the students don't like to do, but if you find out that this increases their performance on a summative or formative exam, then they're much more willing to do it. For example, I introduced class cards into my class 20 years ago where they had to write a response with a group and turn it in. The first year they wrote, "We hate these class cards, they're just a pain." So, the next year, I did class cards for every other assignment, associated with a set of assessments that we would do, and the ones where they did class cards, they did much better. I showed them the data and the next year they said, "Well, we hate these class cards, but we know it improves our learning, so we like having them." Then [I showed] the faculty that data with the same students—my students in freshman year are their students in sophomore year, where we have 400 students in the classroom. Providing that kind of information to faculty, as well as to students, can really help change practice, but also, it's part of our research mission to look at things in an evaluative and critical way.
This is one example of how students are included throughout the practice of data-informed analytics at UCI. Student voice is part of each subsection of the SSA Rubric and is critical in order for an institution to have an initiative that is impactful, equitable, and sustainable.
Multidimensionality of Data: Data is used to inform decision-making in the Compass initiative. One example features the use of traditional persistence/outcome data, which is disaggregated and used to inform faculty teaching efforts. In this scenario, faculty members use data related to student learning to inform their pedagogical approach, coupled with conversations and input from students about the results of analysis of their data. For an institution to be prepared to use this data effectively to make informed decisions, faculty, staff, and leadership need access to the appropriate data. This involves selecting data elements that are multidimensional in nature. Referring to the example above, this team used student outcome data as well as qualitative inquiry in the classroom through interview and conversation to inform a pedagogical strategy.
Communities of Practice and Collaboration: Another critical component of the Compass initiative is the campuswide Community of Practice, which serves the initiative in a number of important ways. The UC Irvine Compass Community of Practice fosters the same spirit of data-driven enthusiasm, with a forward-thinking mindset that embraces—and is powered by—the notion that a campus community can act as a living curriculum through collaboration, connectivity, equity, and increased data and digital literacy. The goal is to effectively use data to support all students throughout their collegiate journeys. Together, they are revolutionizing institutional thinking, policies, and behavior—igniting a campus-wide transformation.
One tenet of the SSA Rubric is the aspect of de-siloing workstreams. At UCI, the organization and commitment of resources to building a data culture around a communities-of-practice framework has led to effective and productive cross-departmental collaboration, subsequently resulting in impactful student success efforts. Another subcategory of the rubric involves the culture and collaborative nature around data-informed decision-making.
Tasha Almond-Dannenbring, Lead Data and Analytics Consultant at Unicon, described her discoveries about the UCI Compass initiative during the SSA Rubric Workshop:
During my short time at UC Irvine, engaging with this group, I had the opportunity to experience what Tom Andriola [Vice Chancellor for Information Technology and Data and Chief Digital Officer] describes as "a culture of care in a technology-focused world."Footnote4 One important aspect of this is that the UCI Compass team all appreciate and embrace a culture of inquiry, in a space that is safe for all to have open conversations around the work being done with the Compass initiative.
Data Governance/Ecosystem: Data governance is critical to any initiative, as noted in several areas of the rubric. At UCI, and specifically in Compass, data governance, data literacy, and a robust ecosystem are at the heart of the work in using analytics to drive decision-making. UCI partners with AWS as a strategic thought partner, and, using the AWS suite of tools, UCI has moved from data warehouse to data lake and, finally, to data resort—a robust data ecosystem where people want to go, a place where they can use data to add value to their work. Next in the realm of governance is the shift from data hoarding to sharing. This is critical in a healthy and collaborative data enterprise. Within the UCI data resort, there are many opportunities for deep thought on how data is shared across the enterprise and how organizations are connected to one another. As Andriola said, "We didn't know, and we still don't completely know, what student 3.0 should look like, but working backwards was a great framework for us to redefine a future state and how we needed to enable it, what competencies we need in the organization, and the data we need to bring it together."Footnote5
Outcomes for Compass
During the SSA Rubric Workshop, participants made the following observations related to dimensions of the rubric and solutions that could be implemented to address ecosystem inadequacies:
Silos: The group concluded that the initiative includes many moving parts but that there is no overall roadmap. All of the pieces are present for creating a roadmap, but it would help to put things into an institutional strategic roadmap, providing a big picture for perspective.
Data Governance: The group agreed that no data governance meeting is currently happening at an appropriate frequency and that the responsibilities are not clear. To that end, they have had differing levels of success working across silos, as demonstrated in the workshop and the overall success of the initiative. Although the Compass Student Data Governance Council (SDGC) was already in existence, these findings showed that more work was needed to communicate this information to both the Compass team and the campus. The SDGC mission and site link are now included in Compass strategy meetings and embedded into the UCI Compass story:
The protection and stewardship of student data is critical. Our Student Data Governance Council oversees the collection, generation, analysis, management, and dissemination of institutional student data. It is staffed with institutional leaders and subject matter experts to create a forum for thoughtful and robust dialogue. Together we ensure that data is used for good—verifying that data-driven insights and actionable analytics are consistent with our mission and values and aligned with our dedication to helping our students succeed.
Stakeholder Lens: Discussion was held around the various units involved, acknowledging that Student Affairs is not as intertwined as some other units and, as a result, may lack uniformity and consistency in growth compared to others. The group also discussed the definition of "student success" and considered whether they have adequately addressed this definition collaboratively. In response to this and other areas that were lacking representation, the Compass group has grown to include Student Affairs officers, the Registrar FERPA Analyst, the Executive Director of Academic Advising in the Office of the Vice Provost for Teaching & Learning, and Postsecondary Education Research & Implementation Institute (PERI²) officers. Andriola has since clarified how UCI is defining and addressing student success:
Student Success 3.0 for us is really rethinking the model of how we drive student success in an increasingly digital world. […] What are all the digital touch points that we have and how do we think about that? Not just tracking the data about what happens in their classes but what student groups are they in, what internships and practicums have they gotten involved with as they develop their core competencies for career readiness? These are all holistic thinking ideas that we use from other industries but have not yet come into higher education. Also, how do we stop thinking about the class of 2024 and start thinking about each and every student as an individual on their own personal journey to get to the goals that they define and how we're empowering them through data to make better decisions?Footnote6
Decisions: Participants discussed structures that are in place but that could be tightened. Comments were made around how accountability is defined and whether this definition is true for the departments, the institution, or both. The UC Irvine Compass team decided that a consistent definition should be used for all organizational levels. Other institutions may decide differently. Both options can be effective if they are documented and employed in subsequent rubric reviews. Questions surfaced around the timing of these elements and how they looked in practice, as well. Tool and initiative metrics measurements have begun that will flow into a Compass metrics dashboard to address accountability and the strength of the Compass ecosystem.
Rubric Workshop Learnings
With the adoption of any new process comes the opportunity to improve processes and gather input from the end user. As an innovator in the field of student success analytics and an early adopter of the SSA Rubric, UC Irvine gained insights into the collection, delivery, and use of rubric data.
"The Student Success Analytics Rubric was a valuable tool to define and categorize specific areas in our data ecosystem once we identified our key terms and organizational versus unit perspective in scoring. The group's scores then clearly demonstrated area maturity, or where additional focus was needed."
—Astrud Reed, UC Irvine
Preparation and Data Collection: During the review of the rubric findings, discussion surrounded how the participants think about and interpret each question, specifically with respect to their personal experiences and their experiences in Compass at the enterprise level. One suggestion was to collect rubric data in two ways. First, for enterprise use, a group discussion format might be more meaningful. Through this delivery, the group would collectively discuss and agree on a rating. Second, with respect to the personal experience of each Compass team member, qualitative rubric data could be collected using a tool that is made up of participant statements.
If the team is focused on using this as a mechanism for agreement on prioritizing efforts, some additional training and focus in this area might be warranted prior to completing the rubric. Where there was variability around scores, the necessity for additional information around unified definitions, perspective, and initiative awareness was vital in order to fully use and discern rating meaning.
Data Visualizations: Rubric scores are recorded in a large table, and results can be presented in different visualizations for clarity. At UC Irvine we created several visualizations to illustrate the results. Figure 1 includes a dashboard with a packed bubble chart visualization that indicates each response with a key. The purpose behind this choice was for easy identification of questions that had a high level of agreement or a broad spectrum of variances. This method was chosen as a first pass through the group rubric scoring.
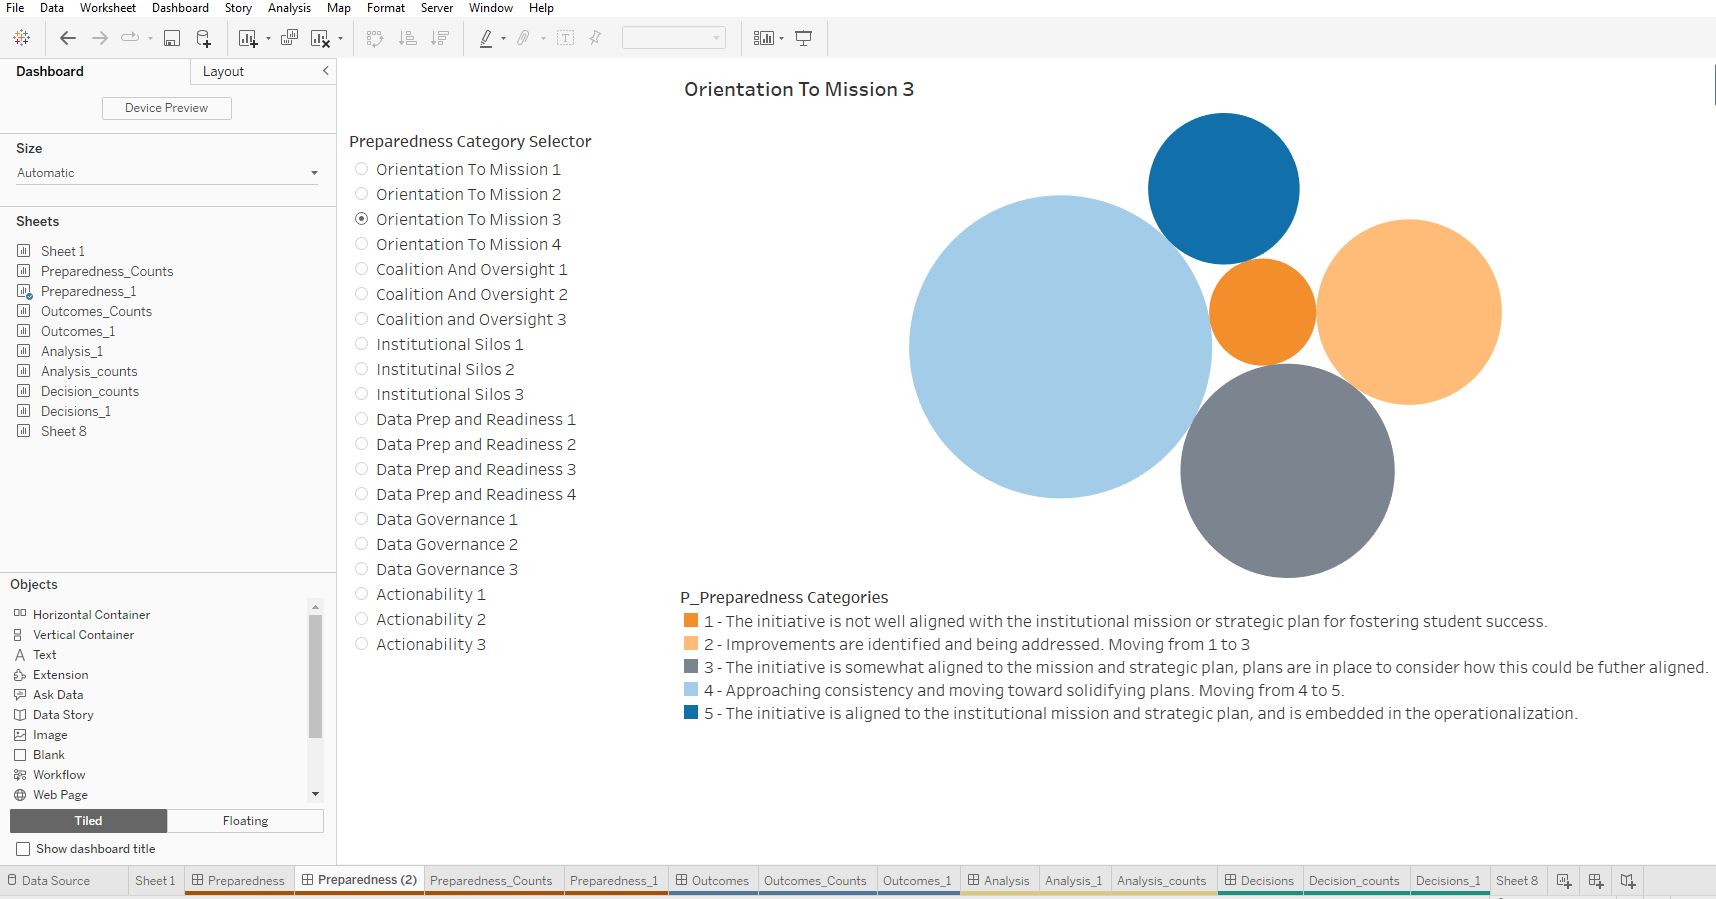
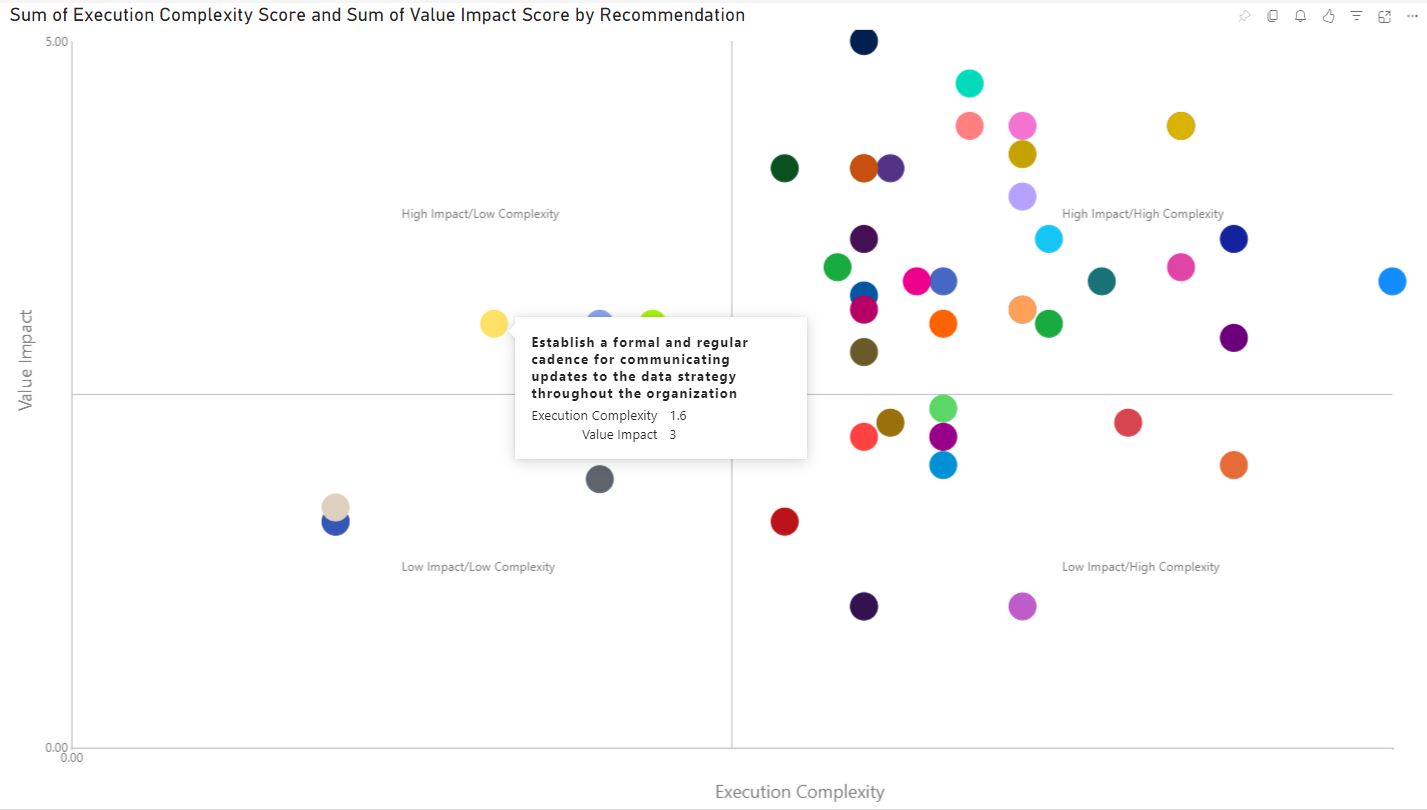
Figure 2 incorporates a Gartner Magic Quadrant framework to use on the second pass of the score evaluation to determine what areas are easy wins and the highest priorities.
Rubric Delivery: Other considerations that the group discussed included breaking up delivery and discussion by section, as well as by the context of response. For the purposes of understanding and agreeing on where the initiative is from an enterprise standpoint, one suggestion was that the group review each subsection/question and come to agreement on a score for each area. The rationale for this is that it can be a challenge for one person to score the initiative at an enterprise level, as well as the fact that the conversations that transpire are especially meaningful. The other side of this concept is the personal experience of each member of the team, and this is where the tool can be used for individual data collection and to assess how aware each team member is of the efforts of colleagues. This individual data collection could then be reviewed in a BI tool or tables. Next, in terms of the number of workshop sessions, it is possible and completely reasonable that each section could be broken into a separate meeting. In fact, this may be more feasible for many institutions seeking to use the rubric to improve their student success analytics practice.
With respect to preliminary training, the team determined that providing institution-specific definitions for terminology in the rubric, such as the term "coalition," would help with consistency in understanding and response. This could be done in the days leading up to the workshop or in an introductory training session that produces an initiative's key-terms dictionary. To reduce the amount of reading involved, plans are in place to revise the rubric format, converting it into shorter questions, potentially using a level-of-agreement scale. Finally, one other potential consequence that was discussed was that departments may conflate or inflate their responses; however, including various departments from across an institution would help to mitigate this concern.
Conclusion
One objective of the SSA Rubric within the EDUCAUSE Student Success Analytics Community Group is to discern and highlight exemplary practices in the field. Serving as a catalyst, the Compass initiative has yielded a multitude of best practices that have been integrated into standard operations at UCI. This integration signifies UCI's maturity in the adoption and implementation of communities of practice, student voice, and data governance/ecosystems, as illustrated by the aforementioned examples.
As the community group actively advocates for and supports the use of the rubric, the aspiration is to engage with other institutions keen on leveraging this invaluable tool to enhance their analytics strategy. The benefits derived from employing this rubric are abundant, including the establishment of a consistent cadence for continuous improvement and the creation of benchmarks to showcase advancements.
Conducting a thorough examination of institutional practices is a collaborative effort, involving experts from across departments and organizations, and provides institutions with fresh perspectives. This collaborative scrutiny not only yields insights from the rubric's outcomes but also fosters meaningful partnerships with industry experts. Ultimately, the rubric serves as a resource-building tool for institutions, affirming the judicious allocation of resources, data-informed decision-making, and the dedicated efforts invested in student success analytics.
Notes
- Tom Andriola, "University of California, Irvine: Boosting Student Success with AWS Analytics," YouTube, January 18, 2024. Jump back to footnote 1 in the text.
- David Naimie, Patty Morales, and Ella Lee, "Anteater Insider Podcast: Supporting Student Progress through Analytics," October 24, 2023; Jump back to footnote 2 in the text.
- Tom Andriola, Michael Dennin, Patty Morales, Diane O'Dowd, and Richard Arum, "Student Success, Deeper Insights Enabled by Data," Digital Squared, podcast, January 25, 2023. Jump back to footnote 3 in the text.
- Tom Andriola, "A Culture of Care in a Technology-Focused World," LinkedIn, October 3, 2023. Jump back to footnote 4 in the text.
- Andriola, "University of California, Irvine: Boosting Student Success with AWS Analytics." Jump back to footnote 5 in the text.
- Ibid. Jump back to footnote 6 in the text.
Tasha Almond-Dannenbring is Lead Data and Analytics Consultant at Unicon.
Tom Andriola is Vice Chancellor for Information Technology and Data (ODIT) and Chief Digital Officer at the University of California, Irvine.
Astrud Reed is the UC Irvine Compass Community of Practice Manager at the University of California, Irvine.
Xanat Hernandez is Director of Communications for Information Technology and Data (ODIT) at the University of California, Irvine.
© 2024 Tasha Almond-Dannenbring, Tom Andriola, Astrud Reed, and Xanat Hernandez. The content of this work is licensed under a Creative Commons BY-NC-ND 4.0 International License.