
Collecting data on the use of A/V technology in the classroom can put you on the path to a sustainable funding model.
Keeping up with audio/video (A/V) technology on a higher education campus is challenging because classrooms are, more often than not, being used, and the costs associated with updating and maintaining A/V technology are significant. "Sustainable funding" was ranked third on the EDUCAUSE 2020 Top 10 IT Issues, so it's clear that developing a sustainable approach to technology investments is an issue that many universities face.1 Institutions need to be strategic in their approach. There are many ways to be strategic, but the Wake Forest University Information Systems (IS) department multimedia team has found that collecting data on how multimedia technology is used in the classroom is the first step.
In 2015, Wake Forest University had more than ninety-five learning spaces that were not centrally managed and needed A/V upgrades. As the new assistant director of IT infrastructure, I was tasked with creating a strategic, yet budget-conscious technology-upgrade plan for those learning spaces. And it wasn't just those ninety-five classrooms—the plan needed to address the long-term needs of the more than three hundred learning spaces on campus that would require technology updates every six or seven years. To accomplish this, the IS multimedia team needed data on how faculty were using the existing technology in those learning spaces.
Each year, Wake Forest University puts out a call for capital requests where departmental chairs can request funds from the college for up to four projects or purchases. Under this funding model, if a department chair does not prioritize a technology refresh, the IS department would continue to implement Band-Aid repairs—potentially for years to come. Departments that do request technology refreshes typically ask for a duplicate of their existing analog setup but in a new digital form. So, for example, if a department requested a Blu-ray player and document camera, the IS multimedia team would provide the most up-to-date versions. In 2015, the default classroom technology package included a document camera, DVD player, cable TV, analog input, digital input, AUX video, widi, and Apple TV (and sometimes a VCR and LaserDisc player). Adding all the devices put the cost of a standard classroom technology upgrade between $27,000 and $35,000. To update all ninety-five-plus classrooms, be strategic, and set a plan for years to come, this model wasn't going to work due to the limited budget to upgrade our spaces. We needed to get the cost of the existing technology package down in order to create a financially sustainable plan.
The critical question was, how do we reduce the cost of upgrades without removing important pieces of A/V technology from the classroom? Before we could answer that question, we needed data on how the current technology was being used, so we implemented Resource Management Suite (RMS) for AMX Audio Video Control Systems. RMS is a data-collection and remote-monitoring tool that shows trends, source usages (document camera, DVD, etc.), and outages. We anticipated that the data from RMS would tell a story about how multimedia technology is used in each classroom, which would allow the IS department to have data-driven discussions with faculty about their technology needs. Department heads and professors respect data, and the IS department needed their support if we were going to streamline the technology used in the common classroom. Another benefit of remote monitoring is the ability to get real-time reports about technical problems—and potential problems—in a classroom before users experience them. These reports have allowed the technical team to repair the technology before a professor experiences an A/V problem in class.
After collecting data for one year, we determined that we could drastically reduce the costs for each upgrade. The data showed that all classrooms didn't need every technical option, as some departments and disciplines used certain components more than others. Figure 1 shows A/V technology use over eighteen months (July 2018–January 2020) in learning spaces that are connected to RMS.
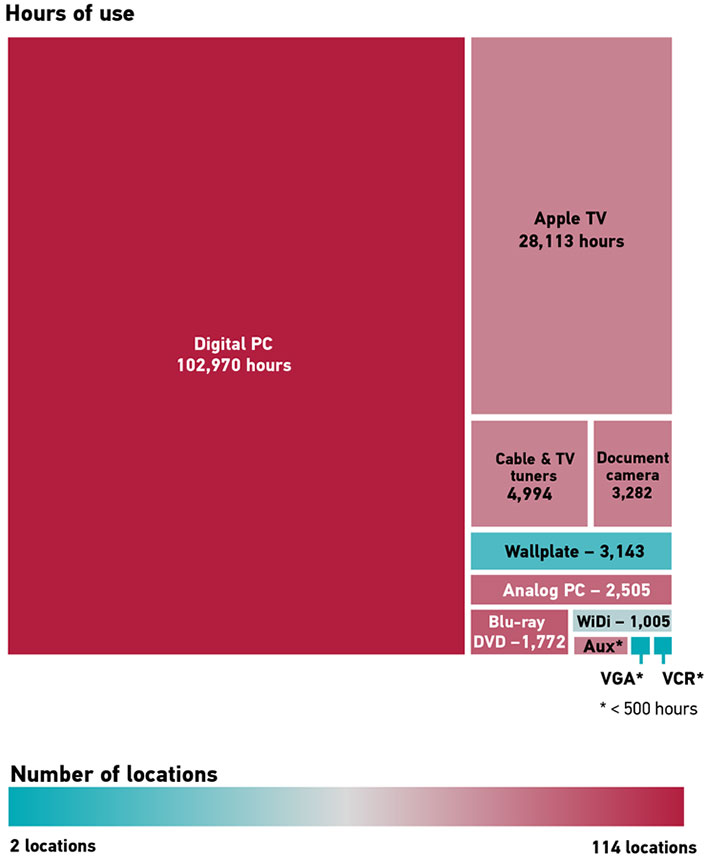
Before discussing classroom technology needs with faculty and department heads, the IS department used RMS data to identify low-hanging fruit. From this eighteen-month RMS data collection period, we found that:
- AUX A/V was used for only about 414 hours, which was less than 1 percent of the time—and that 1 percent was primarily us testing the system each semester.
- The analog PC was used for 2,505 hours (only about 2 percent of the time), and its use continues to dwindle with every semester and computer upgrade cycle.
- Cable TV tuners in the classroom were used for only 4,994 hours. Since the Wake Forest University cable TV contract was up, the college had the opportunity to select a streaming cable TV provider, which eliminated the need for a tuner in each classroom.
- Overall, document cameras and Blu-ray DVD players weren't used that much (3,282 and 1,772 hours, respectively) in common classrooms. We discovered that some departments used a document camera or DVD player regularly, but rarely did a classroom use both. Based on the RMS data, we determined that we needed to ask departments about their specific A/V technology use in the classroom. For the occasions when a faculty member needs both a document camera and a DVD player, we now provide portable devices for departments to use.
- Most faculty present video clips online or embed them in PowerPoint presentations. This practice confirmed our suspicion that advancements in technology had made the old ways of displaying content obsolete and unnecessary.
Our findings suggested that we could simplify the technology in 80 percent of Wake Forest University learning spaces and reallocate more than $500,000 to other areas while creating a sustainable technology upgrade plan for many years to come. Each year, we continue to collect and analyze the data to help shape discussions about technology trends in the classrooms and specific technology needs for the following year.
The classroom A/V standards the IS department has established as a result of the data collection have allowed us to double the number of upgrades we complete over semester breaks—an upgrade rate that aligns with our refresh target of six to seven years for all three hundred-plus learning spaces. And as of January 2020, we have fewer than thirty-five of the ninety-five remaining classrooms to upgrade. Our data is also influencing technology decisions in areas such as new buildings and renovated spaces. We share our data with other departments and committees to show them trends and to help them make decisions about technology in their learning spaces. For example, the WFU Learning Spaces Committee, which consists of faculty, staff, instructional technologists, and students, uses the data the IS department provides to make recommendations and set college standards for the A/V technology package used in learning spaces. The data the IS multimedia team is collecting helps us to be more confident about implementing technology in a learning space because we know the technology will be used.
For more information and analysis about higher education IT research and data, please visit the EDUCAUSE Review Data Bytes blog as well as the EDUCAUSE Center for Analysis and Research.
Note
- Susan Grajek and the 2019–2020 EDUCAUSE IT Issues Panel, "Top 10 IT Issues, 2020: The Drive to Digital Transformation Begins," EDUCAUSE Review, January 27, 2020. ↩
Brent Babb is Assistant Director of Infrastructure at Wake Forest University.
© 2020 Brent Babb. The text of this work is licensed under a Creative Commons BY-SA 4.0 International License.