
Many higher education IT budgets have been reduced, just as institutions are more dependent on IT than ever before, contributing to a growing institutional digital divide.

As the COVID-19 pandemic upends higher education in 2020, institutions are relying on digital alternatives to missions, activities, and operations. Challenges abound. EDUCAUSE is helping institutional leaders, IT professionals, and other staff address their pressing challenges by sharing existing data and gathering new data from the higher education community. This report is based on an EDUCAUSE QuickPoll. QuickPolls enable us to rapidly gather, analyze, and share input from our community about specific emerging topics.1
The Challenge
Technology has been essential to colleges' and universities' business continuity during the pandemic. Online services and virtual gatherings are enabling students to learn, faculty to teach and continue much of their research, staff to work, and prospective students to "visit" and apply to institutions safely from their homes. In many cases, institutions have had to make additional investments in technology to operate during the pandemic. Yet the pandemic and its widespread consequences have had a sizeable negative financial impact on higher education. What choices are institutions making about IT budgets when leaders need to reduce expenditures but somehow also maintain critical IT services?
The Bottom Line
As institutions tighten their belts, they are looking to their IT organizations to follow suit. The median IT budget decrease is 10%, and budget cuts have affected 65% of colleges and universities already this fiscal year.2 Belts may get tighter still—43% of respondents anticipate decreases are still to come. Respondents at institutions whose general fund reserves have dropped are most likely to be experiencing IT budget reductions.
So far, most institution have been able to avoid the cuts that directly damage staff and or services. Most reductions have been focused on travel, professional development, compensation freezes (rather than reductions), delaying planned work, and renegotiating contracts and licensing. Budgets are increasing for a few services, specifically those needed to bolster academic technologies and support.
An institutional digital divide has opened and is growing. About one-quarter (26%) of respondents said their IT budget has remained roughly the same, and a lucky 11% reported IT budget increases. A number of institutions are investing in new technologies and digital transformation (44%), while others are cutting services and staff salaries and forgoing technology upgrades. Higher education will need strong leadership, both within the institution and within the higher education ecosystem at large, to help institutions whose technology budgets have diminished survive.
The Data: IT Budgets
IT budgets are down this year. Almost two-thirds (63%) of the survey respondents reported overall IT budget decreases this academic year, and the median decrease is 10%. About one-quarter (26%) of respondents said their IT budget has remained roughly the same, and 11% reported IT budget increases. Taking all respondents into account, overall higher education IT budgets have decreased by 5% this year (see figure 1).
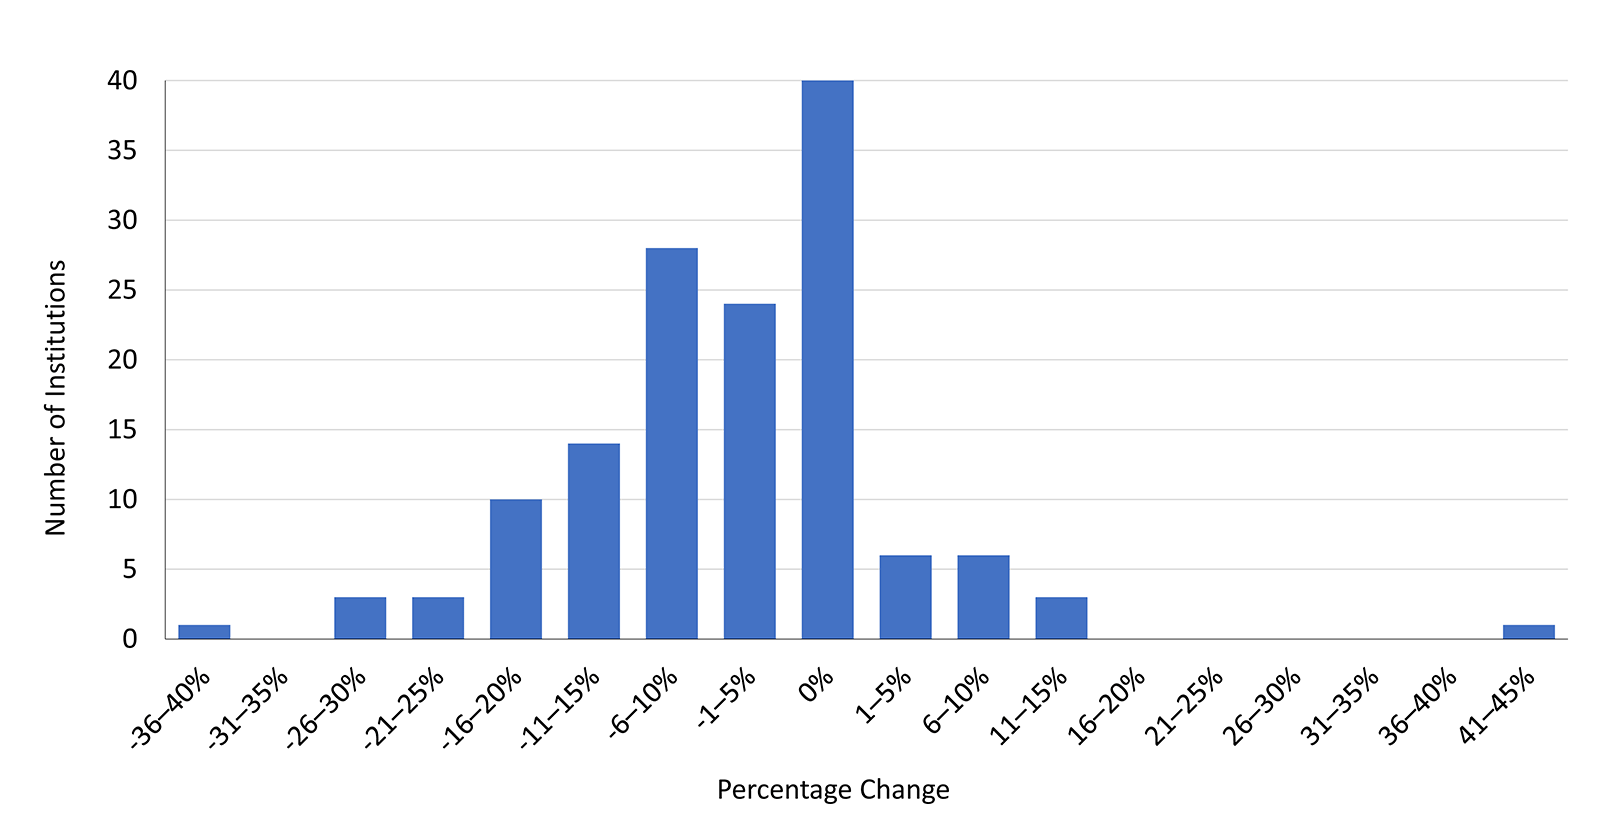
Some types of institutions have been hit harder than others. Large institutions (with 8,000–14,999 FTEs) were more likely to have IT budget decreases (79%, versus 63% for all institutional types), and the median IT budget change for large institutions was -10% (versus -5% for higher education overall). Only 30% of two-year colleges reported IT budget decreases, and the very smallest institutions (those with fewer than 2,000 FTEs) reported the most IT budget increases (33% of small-institution respondents).
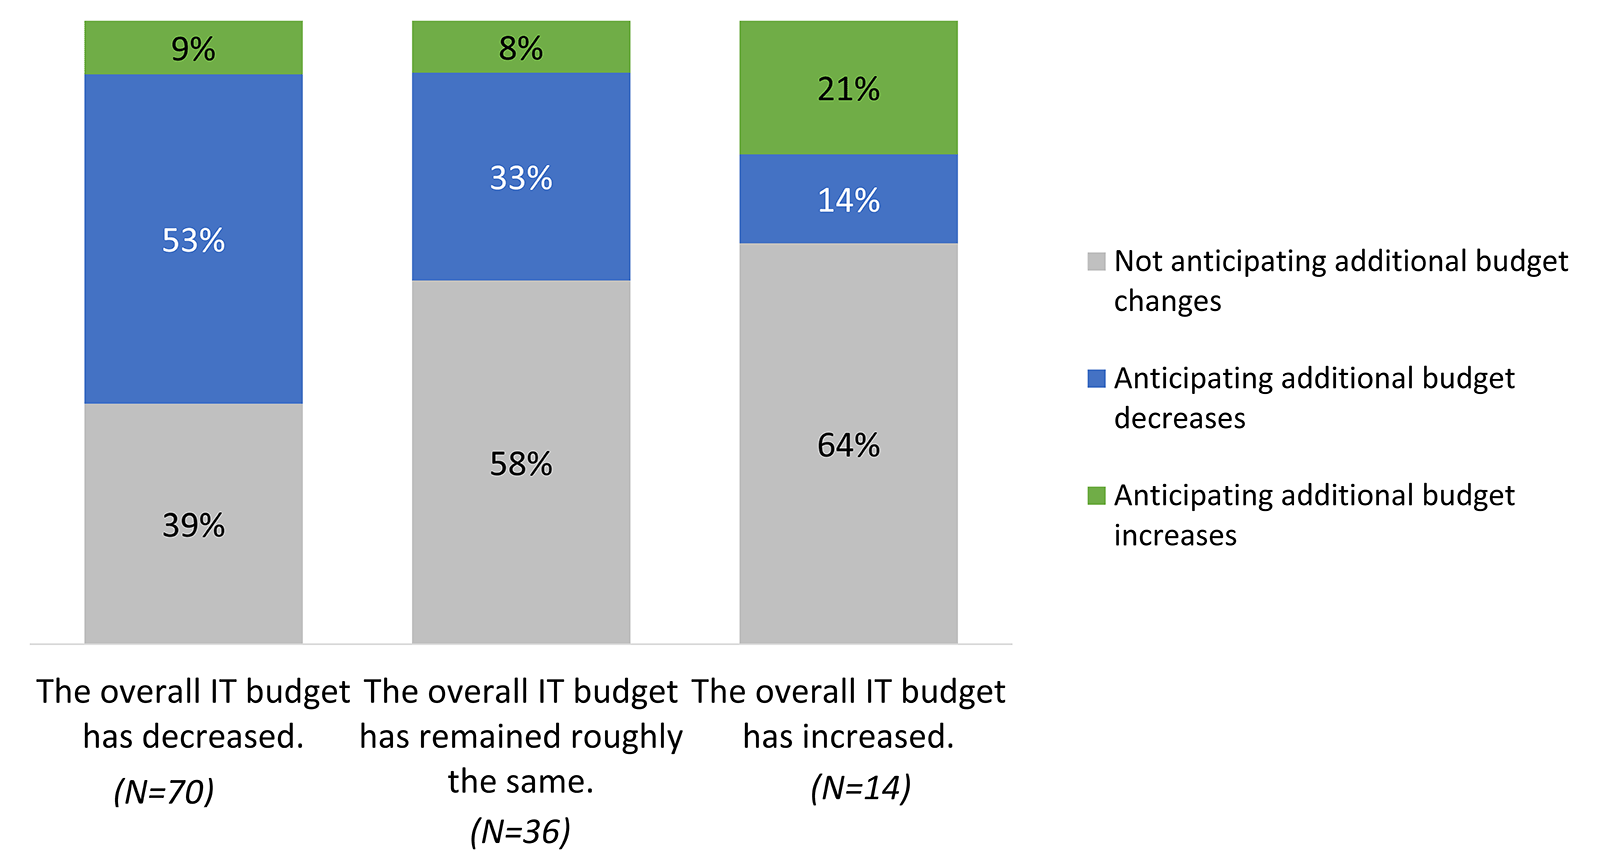
More belt-tightening lies ahead for many. More than half of respondents (53%) anticipate additional changes in the IT budget before the end of the current fiscal year, mostly decreases (43% expect IT budget decreases and 10% expect increases). Further decreases are more commonly anticipated by those who have already experienced decreases; similarly, those who have already experienced budget increases are more likely to anticipate further increases (see figure 2).
The Data: Institutional Finances and Leadership
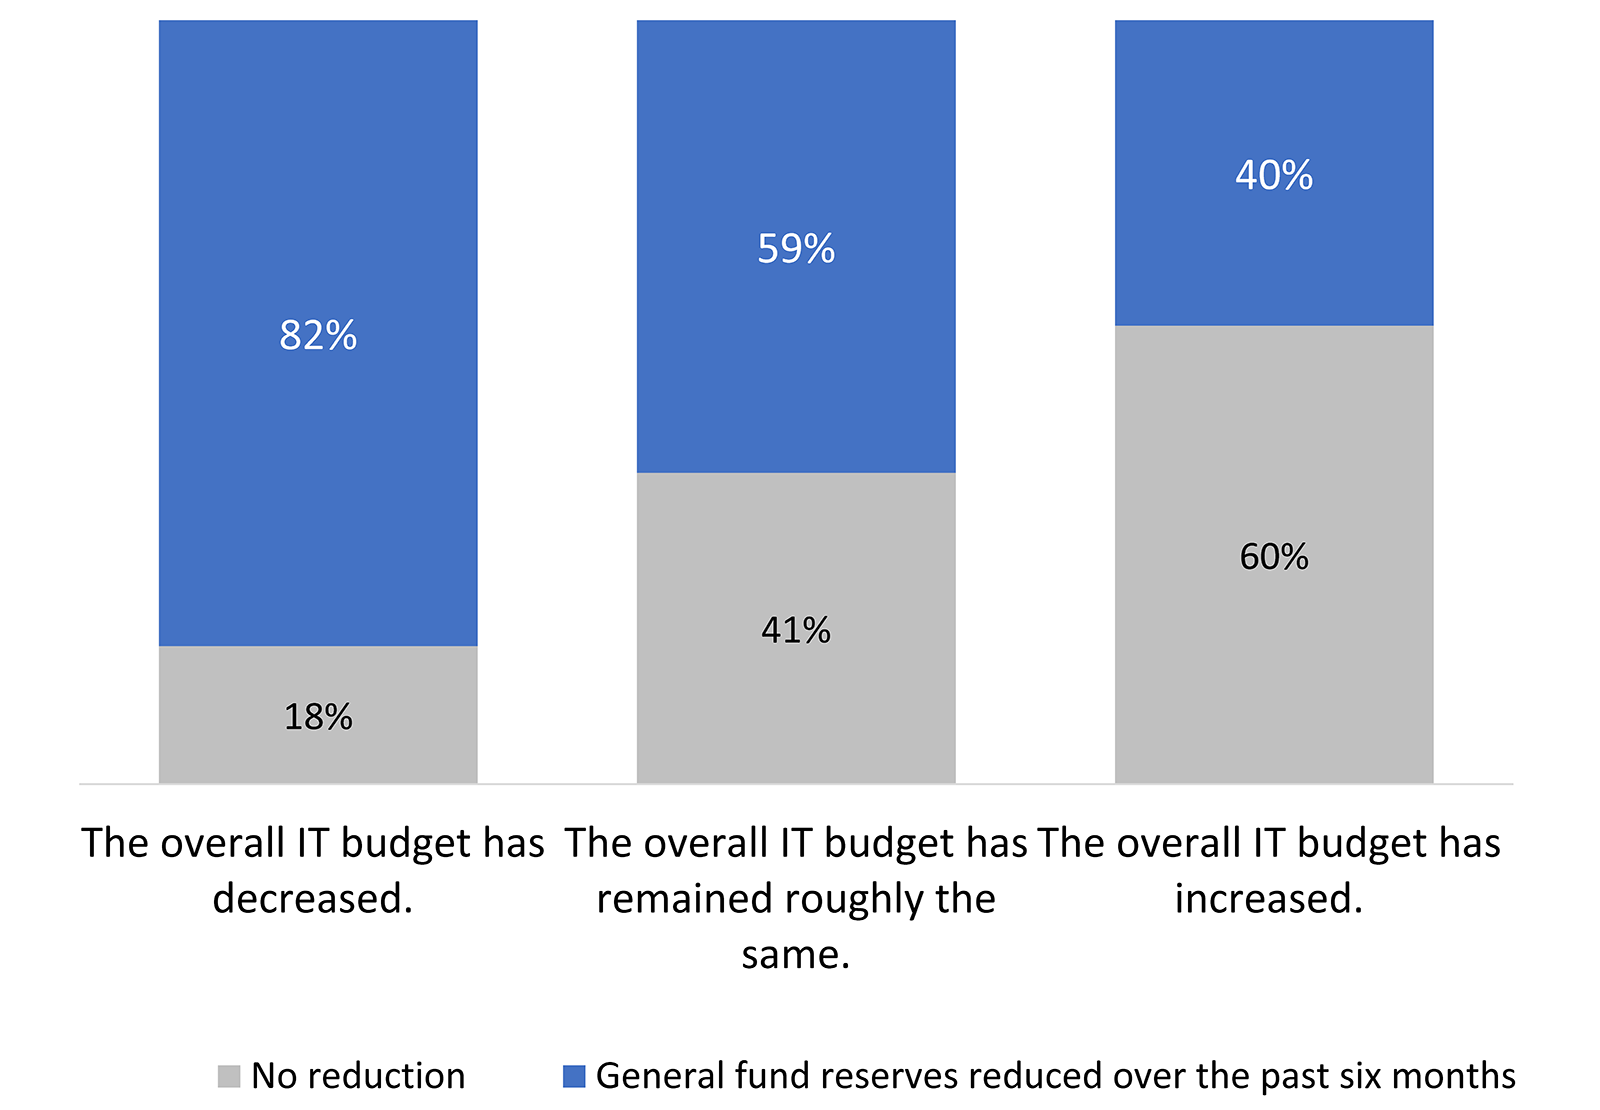
Most institutions general fund reserves have decreased. Three out of four respondents (73%) reported reductions in their institution's general fund reserves. IT budget decreases are most common among those institutions (see figure 3).
Many institutions that can operate on a deficit are doing so. More than half of resondents (58%) said their institution can operate on a deficit, and 48% of those institutions—or 28% of all respondents' institutions—are doing so.
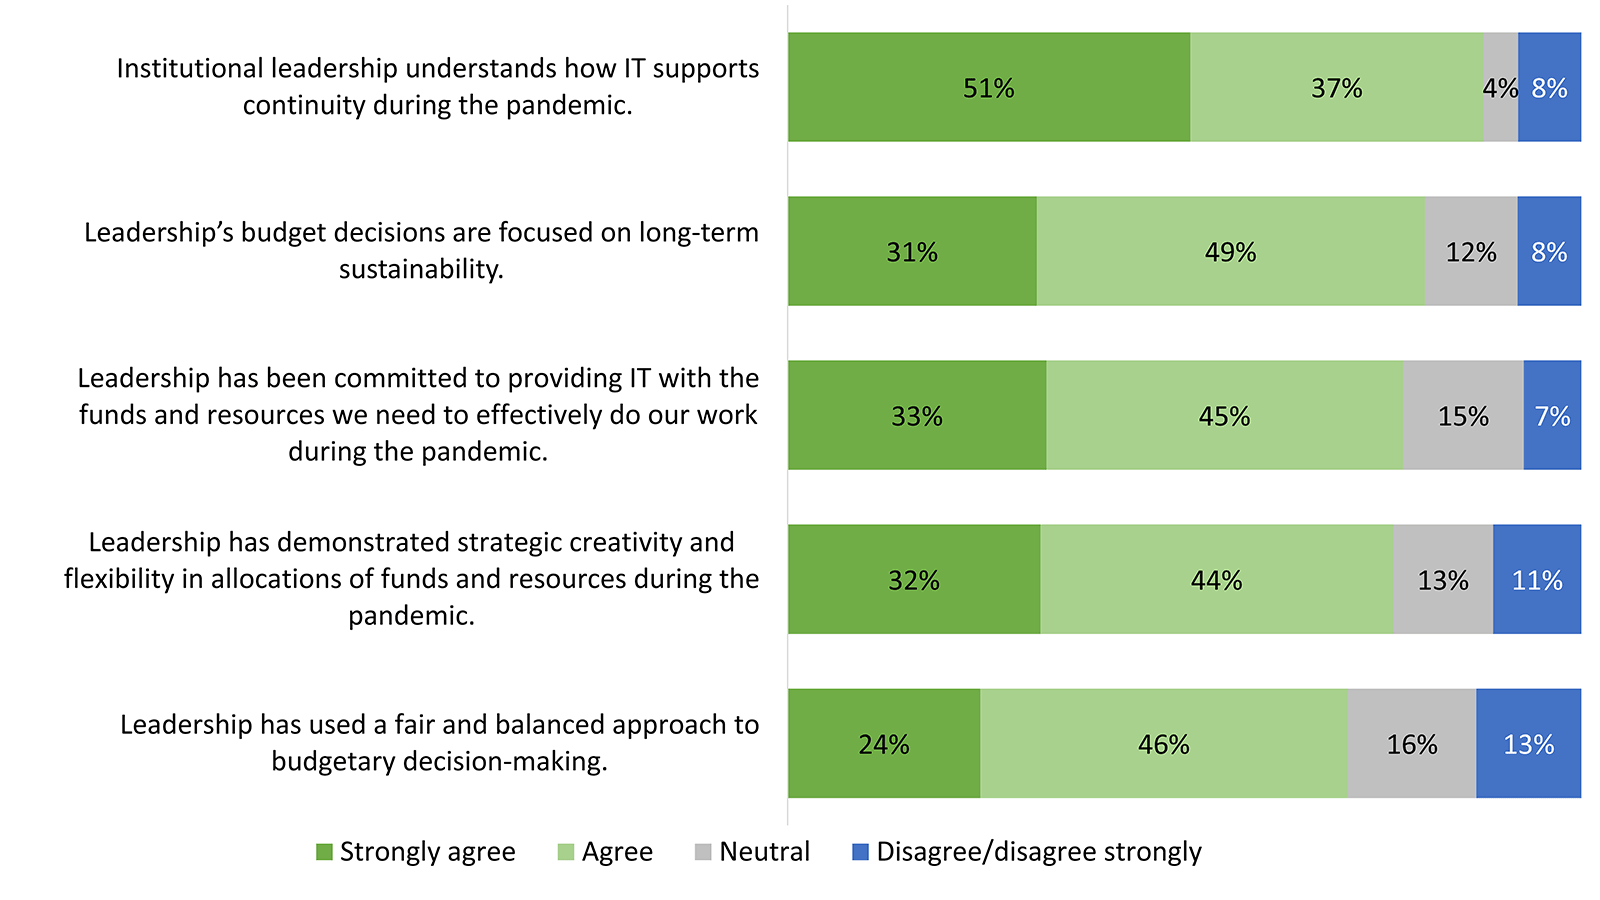
For most, institutional leadership is supportive of IT. We asked respondents to reflect on the role their institutional leaders have played as fiscal leaders (see figure 4). Most respondents have confidence in institutional leadership. We found some patterns in the data suggesting that confidence in institutional leadership is lower at institutions that have experienced IT budget decreases.3
The Data: Impact of IT Budget Changes on Staff and Services
IT leaders are doing their best to protect staffing levels and benefits. We asked respondents whether they were implementing or considering any of seventeen tactics to reduce institutional IT costs (see figure 5). More than half of respondents have already implemented at least one of these five tactics:
- Travel bans
- Hiring freezes
- Compensation level freezes
- Professional development reductions
- Delaying planned work
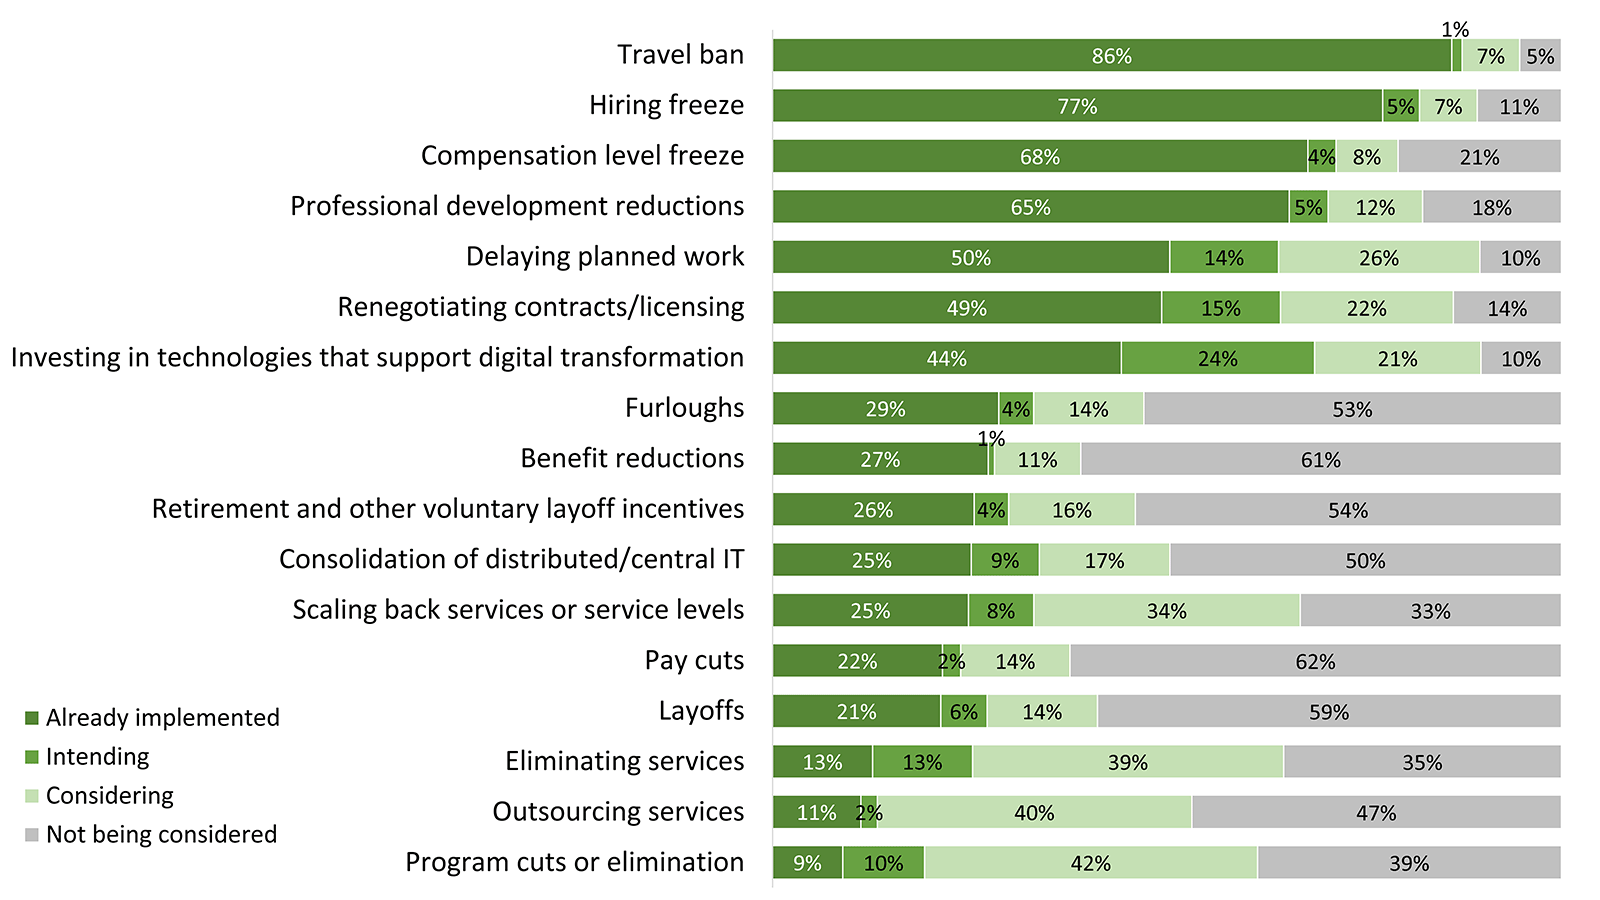
Renegotiating contracts or licenses and investing in technologies that support digital transformation were the other two most widely implemented tactics. Digital transformation is most likely to increase further, as 24% of respondents are considering this tactic.
More than half of respondents are not considering tactics that would be most disruptive to staff:
- Pay cuts
- Benefit reductions
- Layoffs
- Retirement and other voluntary layoff incentives
- Furloughs
- Consolidation of distributed/central IT
Almost half (47%) have also ruled out the possibility of outsourcing services.
IT budget cuts have affected few services…so far. Between 30% and 40% of respondents are not considering eliminating services or programs or scaling back services or service levels. However, similar percentages of respondents are still considering these tactics. Thus far, most respondents are hoping to reduce service costs without reducing service levels or are focusing reductions on infrastructure or auxiliary services (see figure 6).
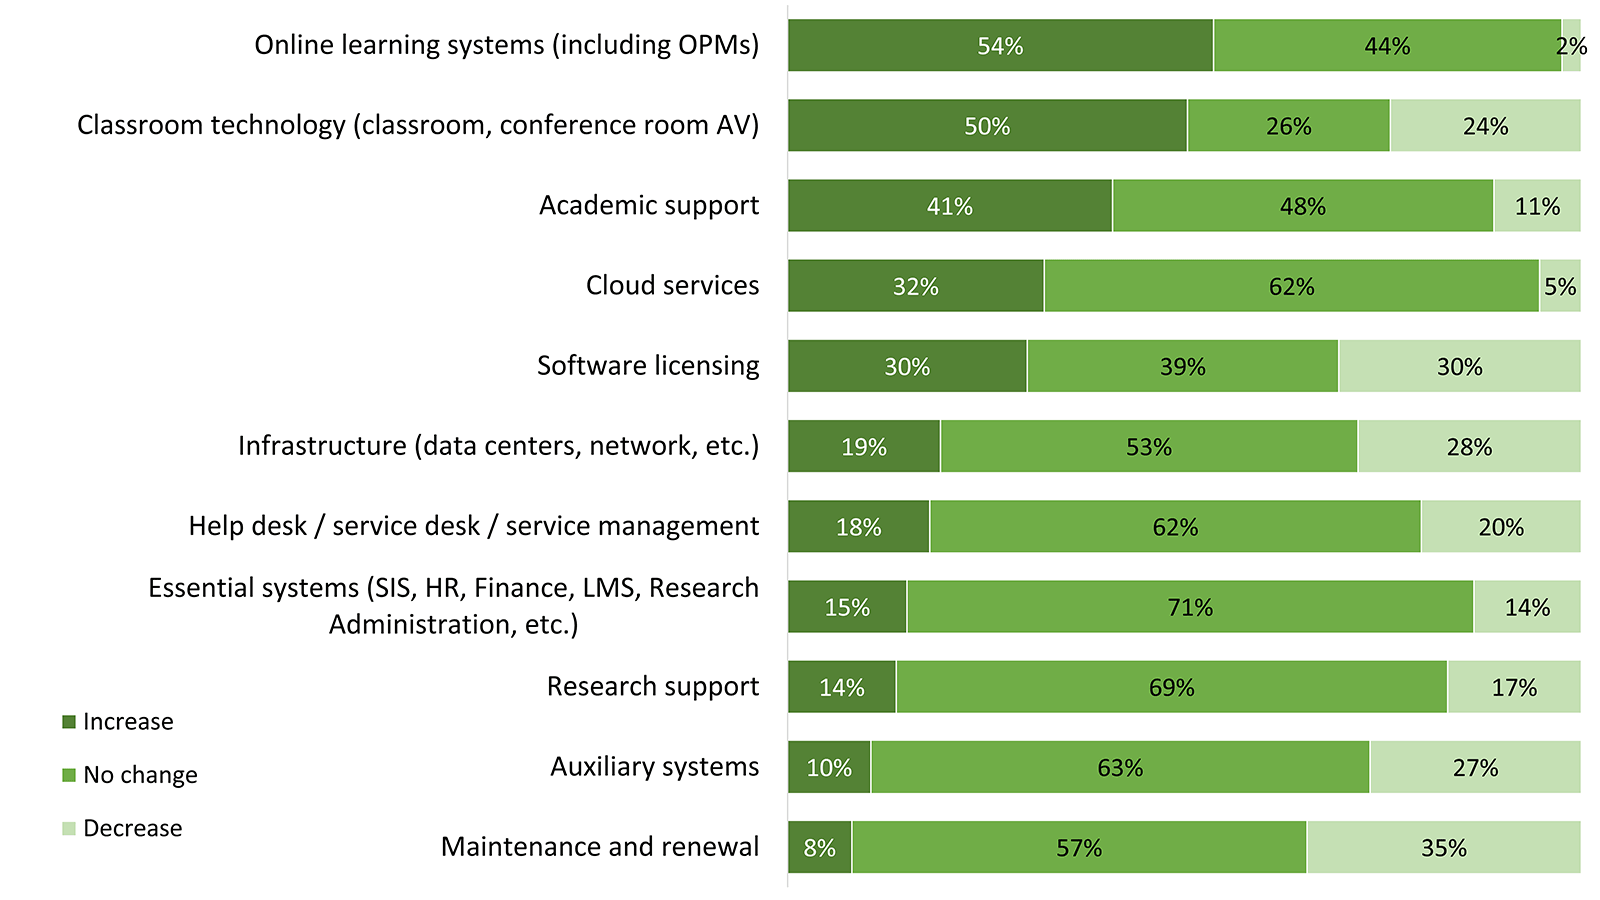
Institutions are still investing in teaching and learning technologies. The areas most likely to see budget increases concern academic technologies and support, which have been essential to enabling institutions to remain open.
Common Challenges
Today's financial realities will have lasting effects. Most commonly, according to our respondents, those effects will manifest in enduring changes in technology spending and management:
- "Increased use of outsourced services with IT shifting to more managing those contracts and deliverables than developing/maintaining in-house expertise."
- "Slowdown or reduction in overall staff, as there were planned increases in out years that are likely to be further delayed or forgone altogether."
- "Permanent budget reduction"
- "As we cut or delay many IT initiatives as a means to weather the current fiscal storm, we are missing an opportunity to improve and distinguish ourselves from the competition. I fear that by the time we restore technology investments to a proper level our student body and our most talented IT staff will have already gone elsewhere."
- "Long-term reduction in support services and software licensing."
- "I see an impact on the ability to fund multi-year projects. Excess funds are being rolled back into the general operating fund instead of being allocated for multi-year projects."
- "If there continues to be long term impact on state budgets, I think we will do some restructuring of staff, services, and operating expenses. Enrollment will be a focus."
An IT talent brain drain may be on the horizon. Many respondents predicted future difficulty attracting and retaining technology staff, at a time when the ability to apply technology transformatively is increasingly becoming a differentiator for colleges and universities:
- "Decreased ability to attract and retain skilled IT staff due to downward pressures on salaries and overall reduction in headcount."
- "Inability to keep or hire IT staff due to cuts on top of historically low wages and lack of salary increases over the years. Salaries have not and will not keep up with inflation."
- "Vast morale damage; turnover."
Technical debt leads to reduced IT quality. The other major long-term challenge of today's IT budget reductions is mounting technical debt and a general erosion of effective IT services:
- "We have been on a 4-year journey to modernize the institution. We scrapped many older systems and moved to the cloud. We are not complete, and now they are cutting the resources to complete the move. We are stuck in modernization-freeze hell."
- "Life cycle replacements will be reduced."
- "Lack of incubation and testing of new technologies that will come to fruition in 12–24 months in normal times."
- "The longer-term effect on current year budget cuts. For instance, the bubble that we will experience in maintenance/equipment as we push projects out. At a certain point we will have no choice [but] to refresh equipment due to end of life."
- "End users will not get the support they need, change processes will be slow, resources will decrease, efficiencies will decrease."
- "Loss of innovation."
- "Unpredictable outages due to delayed lifecycle replacements."
Higher education has another digital divide. As some institutions find themselves circling a financial drain, their IT departments are being slowly starved, losing their best staff and having to choose which essential services to cut. IT leaders at other, financially sounder institutions are able to trim fat rather than muscle and in some cases even continue strategic investments in technology. Cruelly, the pandemic has most deeply affected individuals and organizations with the fewest resources. As a community, we can hope that those committed to the higher education ecosystem will step forward to do what's possible to help. For example, IT vendors can consider business models that reflect today's constrained realities, and governments can take a long view on the support needed to sustain higher education as a public good.
Lead or despair? Leadership plays a role. Most respondents reported having institutional leadership that supports and understands technology's role and funding needs. Although no silver bullets exist, good solid managers are able to make "a lot of tough decisions," as one respondent recounted. Other IT leaders may, to their institutions' detriment, have given up and are simply "going over budget and letting the chips fall where they may." Leading IT today is neither easy nor obvious, but every institution deserves the best of their IT leaders at this time.
Promising Practices
Many respondents reported innovative practices to adapt to today's financial realities and the pandemic's circumstances.
Some institutions are pursuing new investments and initiatives. Most often, respondents' innovations were new services and technologies:
- "Pushing forward with online learning and LMS improvements. Developing innovative, low-cost hybrid classroom solutions."
- "Considering AR/VR/AI advocacy during this time to help increase engagement and possibly decrease cost."
- "Leading transformational change initiatives utilizing existing systems but not yet fully implemented."
- "We have leveraged the pandemic situation to implement a number of new applications and services that were needed before but could never quite be green-lighted. These include a secure file transfer solution, an enterprise online training platform, and moving ahead with a new phone system with softphone and remote calling capabilities."
- "We were early to equip our rooms for hybrid learning, after doing a pilot in 2019."
- "We see the investment in aggressive surveillance testing as the best method to continue the work of the college with students present, which supports the future financial health of the college and the college itself."
- "Expanding the use of VDI [virtual desktop infrastructure] for off-campus access to standardized desktops with internal services for mostly faculty and staff. We have expanded it for some student use in more technical programs."
- "A strong shift to virtual services for students when, before the pandemic, there was resistance to our ability to do certain services online."
- "We have made resources available for employees and students by creating a technology loaner program providing laptops, hotspots for internet access, etc. Several training programs were established including online faculty development to ensure workforce readiness, and all incoming first-year students went through a module on LMS to ensure readiness for students regarding different digital resources."
- "Reduction in manual-intensive projects, expediting modernization and centralization."
Several respondents described new uses of data and analytics:
- "Developing new analysis tools to project revenue based on non-resident tuition."
- "Predictive analytics for enrollment futures."
- "Selective reduction of services and licenses based on data."
- "We have made significant investments in analytics, CRM (Salesforce), and academic innovation (Comprehensive Learner Record and microcredentials) to grow enrollments and position institution to succeed."
Institutions are also using financial tactics to adapt. Some institutions that have received CARES Act monies are using them for pandemic-related IT costs. More often, respondents described tactics to develop more accurate budgets and to manage them more flexibly:
- "Financial Transparency—increased involvement from managers in proposing reductions, developing budgets, vendor negotiations."
- "25% carryover to university of unused budget. And unit keeps 75%. Moving to zero-based budgeting. Filling in critical jobs with current employees (accountants for financial work, IT people for IT jobs)."
- "Rolling forecasts—meeting with managers, service owners so they are monitoring their budgets."
As one respondent put it, "The cuts implemented are permanent at this time. Those require creative solutions for the pre-committed contracts/services in place." Fourteen percent of respondents reported using vendors to help negotiate a reduction of contracts; Gartner was the vendor mentioned the most often. Others are negotiating directly with their service or application vendors.
Don't forget to invest in your staff. Several respondents are restructuring their organizations and staffing. Central and departmental IT units are working more closely together, which in the long term will lead to what one respondent described as "stronger relationships between central and de-central IT staff, as well as willingness to coordinate work and projects with common goals in mind." Only one respondent described nonfinancial investments in their IT staff: "We are offering as highly flexible work environment and schedules as we can for IT staff to help offset the financial impact of pay/benefits cuts, and the stress of high workloads since March."
EDUCAUSE will continue to monitor higher education and technology related issues during the course of the COVID-19 pandemic. For additional resources, please visit the EDUCAUSE COVID-19 web page. All QuickPoll results can be found on the EDUCAUSE QuickPolls web page.
For more information and analysis about higher education IT research and data, please visit the EDUCAUSE Review Data Bytes blog, as well as the EDUCAUSE Center for Analysis and Research.
Notes
- QuickPolls are less formal than EDUCAUSE survey research. They gather data in a single day instead of over several weeks, are distributed by EDUCAUSE staff to relevant EDUCAUSE Community Groups rather than via our enterprise survey infrastructure, and do not enable us to associate responses with specific institutions. ↩
- The poll was conducted between September 28 and 29, 2020. Respondents represented 153 institutions, all from the United States. The poll consisted of 18 questions and took respondents a median time of 5.35 minutes to complete. Poll invitations were sent to participants in four EDUCAUSE community groups (CIO, Community Colleges, State Systems, and Small Colleges). An appropriately diverse and well-balanced range of institution sizes and Carnegie Classifications participated. ↩
- For example, 17% of respondents with IT budget decreases (versus 3% with no IT budget changes and none of the respondents with IT budget increases) disagreed that their leadership has demonstrated strategic creativity and flexibility in allocations of funds and resources during the pandemic. Similarly, 19% of respondents with IT budget decreases (versus 3% with no IT budget changes and none of the respondents with IT budget increases) disagreed that their leadership has used a fair and balanced approach to budgetary decision-making. Only 83% of respondents with IT budget decreases (versus 97% with no IT budget changes and all of the respondents with IT budget increases) agreed that their institutional leadership understands how IT supports continuity during the pandemic. Our sample size was small (between 135 and 138 people answered the leadership confidence questions), so these patterns should be taken as provisional. ↩
Susan Grajek is Vice President of Communities and Research at EDUCAUSE.
© 2020 Susan Grajek. The text of this work is licensed under a Creative Commons BY-NC-ND 4.0 International License.