Learn how forward-thinking CIOs are using LabStats hardware and software usage data at scale to reach institutional goals.
Higher education CIOs around the world are increasing staff and faculty job satisfaction, improving students' perception of available IT resources, and freeing themselves of repetitive workloads and high-risk guessing.

What are they doing differently?
They're harnessing hardware and software usage data to inform IT decisions across their institutions. Data-informed decision-making is on the rise, making the EDUCAUSE Top 10 IT Issues for 2023.
Moving from Data Insight to Data Action: Converting data analytics into action plans to power institutional performance, enhance operational efficiency, and improve student success.Footnote1
So how do CIOs convert data analytics into action plans? Follow this step-by-step guide to find out:
1. Collect Usage Data at Scale
Forward-thinking CIOs use LabStats to collect data about computer and software usage from all of the computers they manage. Usage data is collected from machines in a variety of locations across campus. These machines are used by a diverse group of people and vary widely in terms of processing power. If you are already collecting usage data at your institution, are you collecting the full scope (see table 1)?
| Locations | Types | Users |
|---|---|---|
|
Main campus Satellite campuses All departments All campuses Libraries Maker spaces |
Desktops Loaner laptops Kiosks Podium computers Remote-access machines Specialty machines |
Students Public Staff Faculty Administration Esports |
It's also important to collect data over time. Patterns and trends emerge over the course of a semester, but they become much clearer when you're analyzing multiple years' worth of data.
Even if you're unsure how you would use the data, collecting it now creates more opportunities for meaningful insights in the future. With insights into these additional computers, you can increase faculty and staff satisfaction, improve IT department efficiency, and verify that user needs are met without overspending.
2. Simplify Analysis with Business Intelligence Tools
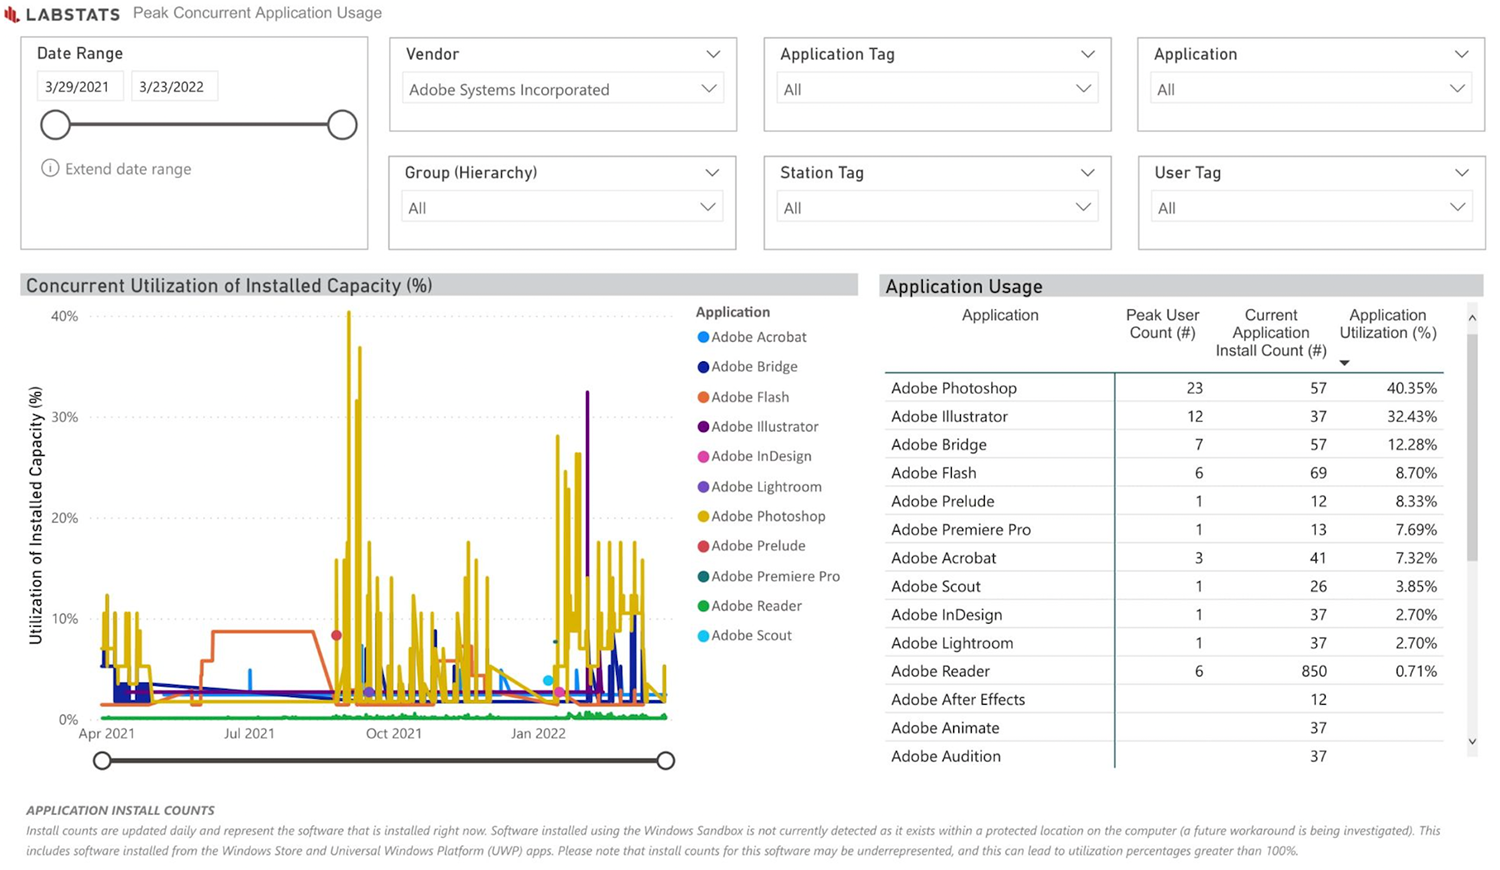
Effective CIOs use business intelligence (BI) software to simplify analysis. BI tools allow users to see the big picture, find outliers, and discover patterns that enable IT staff to make demand-driven, need-responsive decisions about what hardware, software, and spaces they need now and in the future (see figure 1).

To empower CIOs to analyze data at scale, LabStats provides extended historical API endpoints and free Power BI Dashboard Templates to support large-scale IT initiatives. Years' worth of data can be visualized at once so CIOs can start with the big picture and then drill down to find the insights they need. These tools include new REST API endpoints and prebuilt templates running on the free version of Microsoft Power BI. With these data points and dashboards, IT teams can analyze millions of hardware and software data points in minutes and reach a new level of insights.
3. Set Goals and Objectives
Based on the insights gained from the data analysis, CIOs can set clear and measurable goals and objectives that align with their organization's overall strategy and vision.
Here are a few of the goals LabStats has been able to support with usage data over the years:
- Reduce hardware and software spend
- Reduce staff workload and increase efficiency
- Maximize space on campus
- Improve student perception of IT assets on campus
4. Develop and Implement Action Plans
The most effective CIOs have developed action plans with their leadership teams and brought in additional stakeholders to help implement those plans. Bringing in deans and faculty, for instance, can provide a sense of ownership and the opportunity to see a direct connection between technology use and student success. This can also bring more transparency to changes in budget allocation. Angela Neria, CIO at Pittsburg State University in Kansas, said, "Getting leadership to hear the message and building that buy-in along the way by showing data, being transparent, [and] being authentic and genuine about why we're doing this is critical."
In beta testing, LabStats BI reports produced powerful insights fast. Here are a few real-world examples of what CIOs have accomplished by collecting and analyzing data at scale with LabStats:
- At a large Commonwealth university, LabStats showed that fewer than 5 percent of enrolled students used any Adobe Suite product in a given year. Solution: Staff used this data to negotiate a $300,000 reduction in the institution's Adobe bill.
- At a leading institution in New Zealand, LabStats showed an average of 2.7 assigned computers per staff member, and most of the machines had very low usage. Solution: A combination of staff-specific hardware purchases and desktop virtualization reduced the hardware count, and therefore IT staff workload, while increasing staff satisfaction and productivity.
- At a regional university in the Midwest, LabStats showed that two computer labs in one building regularly approached 66 percent capacity, while two labs down the hall never exceeded 10 percent usage. Solution: The IT team installed live availability displays (LabMaps) outside the busy labs to inform students of the availability of other computers just out of sight.
At LabStats, we not only provide colleges and universities with accurate and reliable usage data, we also partner with IT teams to make a difference at their institutions. If you aren't using LabStats yet, what are you waiting for? Start with a free trial, and see the difference that LabStats data can make for you.
Note
- Susan Grajek and the 2022–2023 EDUCAUSE IT Issues Panel, "Top 10 IT Issues, 2023: Foundation Models," EDUCAUSE Review, October 31, 2022. Jump back to footnote 1 in the text.
© 2023 LabStats.

