
Technical debt is widespread across higher education, introducing both risks and benefits to the institution. Cybersecurity supports are lagging, and smaller institutions in particular may be weighed down by compounding debts.

EDUCAUSE is helping institutional leaders, IT professionals, and other staff address their pressing challenges by sharing existing data and gathering new data from the higher education community. This report is based on an EDUCAUSE QuickPoll. QuickPolls enable us to rapidly gather, analyze, and share input from our community about specific emerging topics.Footnote1
The Challenge
Higher education institutions accrue “technical debt” or “data debt” when they delay important technology updates or implement short-term fixes for long-term needs. Delayed or rushed technology decisions are sometimes made out of necessity, particularly in institutional settings where many personnel are feeling understaffed and overworked, where leadership buy-in on important initiatives is uncertain or fleeting, or where rapidly evolving technologies demand agile and flexible decision-making. Reasons aside, delaying or rushing decisions about technology maintenance or upgrades introduces potential risks and costs to the institution and should not be made lightly. In this QuickPoll, we aim to chart the current levels of such debt in higher education and consider its implications.
The Bottom Line
Technology deferrals and quick fixes appear to be commonplace at many institutions, and respondents reported a number of impacts—both negative and positive—of these decisions to their work. Debt is also accruing in the form of under-resourced cybersecurity functions and outdated IT governance, and unsupported critical team skills may be compounding the problems in the long term, especially for smaller institutions. Decisions to incur debt should be realistic and clear-eyed and should always be made with an understanding of (and plans for mitigating) the potential risks involved.
The Data: Mounting Institutional Debt
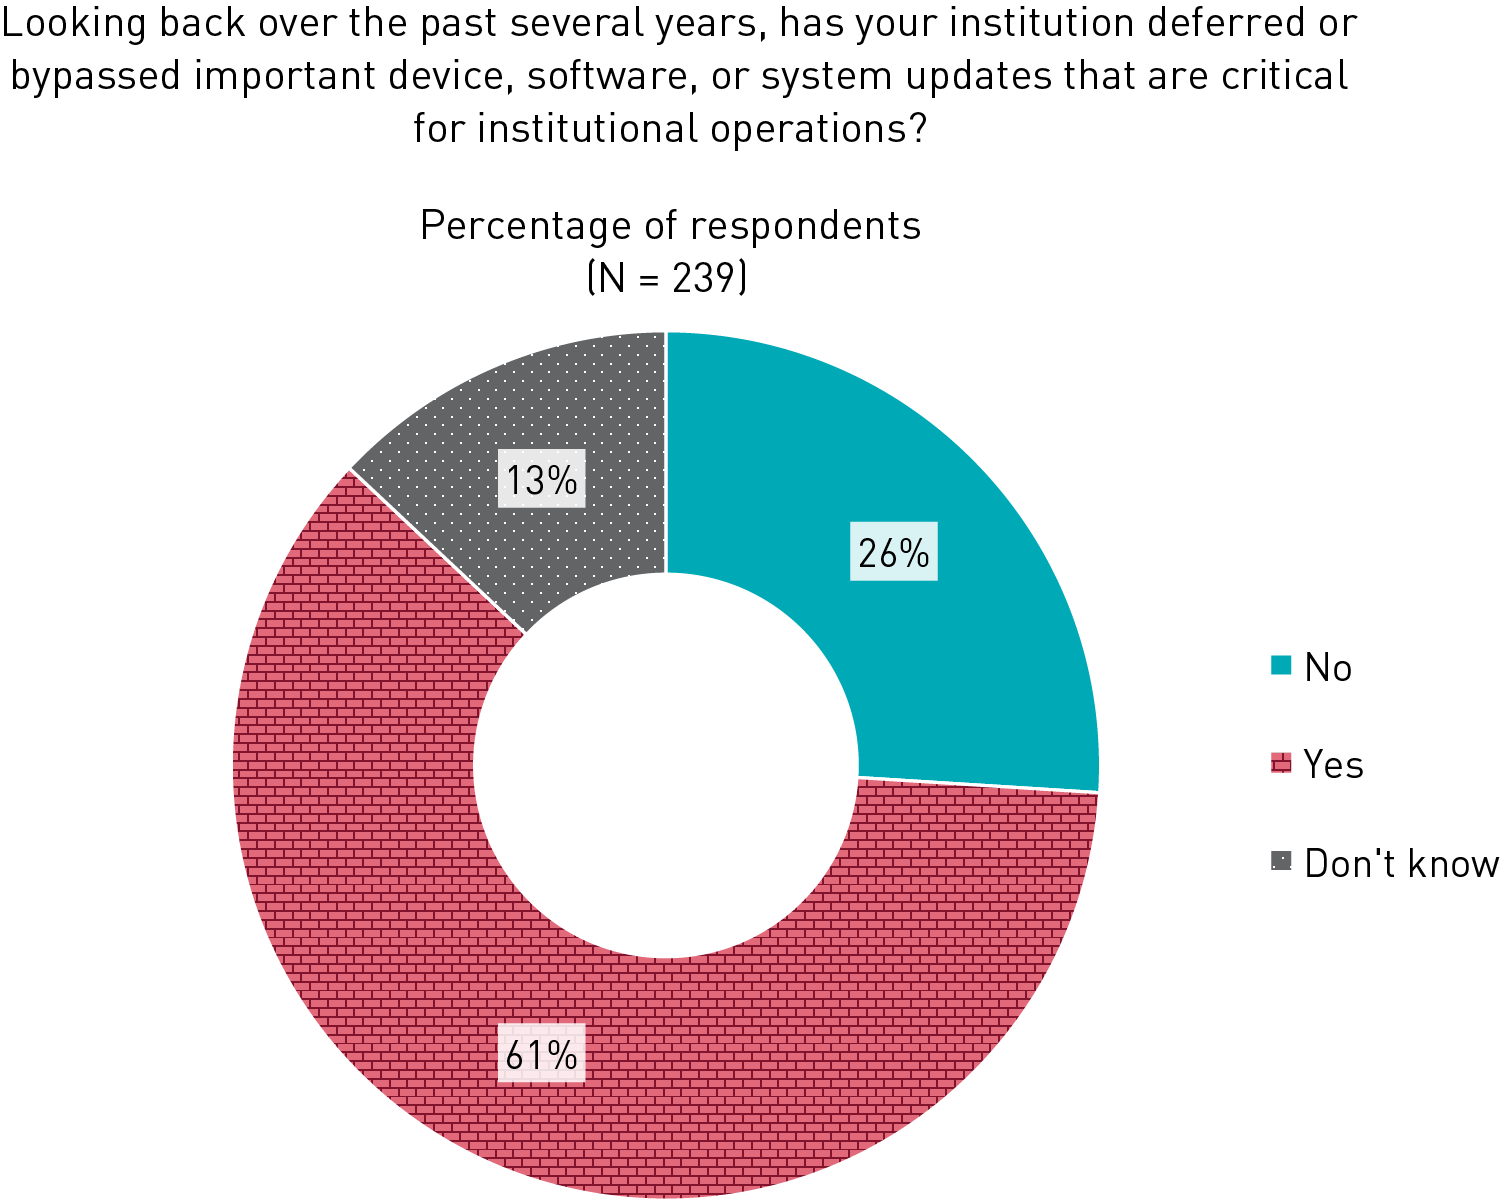
Technology deferrals are common, but they tend to be short-term. Nearly two-thirds of respondents (61%) reported that their institution has deferred or bypassed important device, software, or system updates over the past several years (see figure 1).
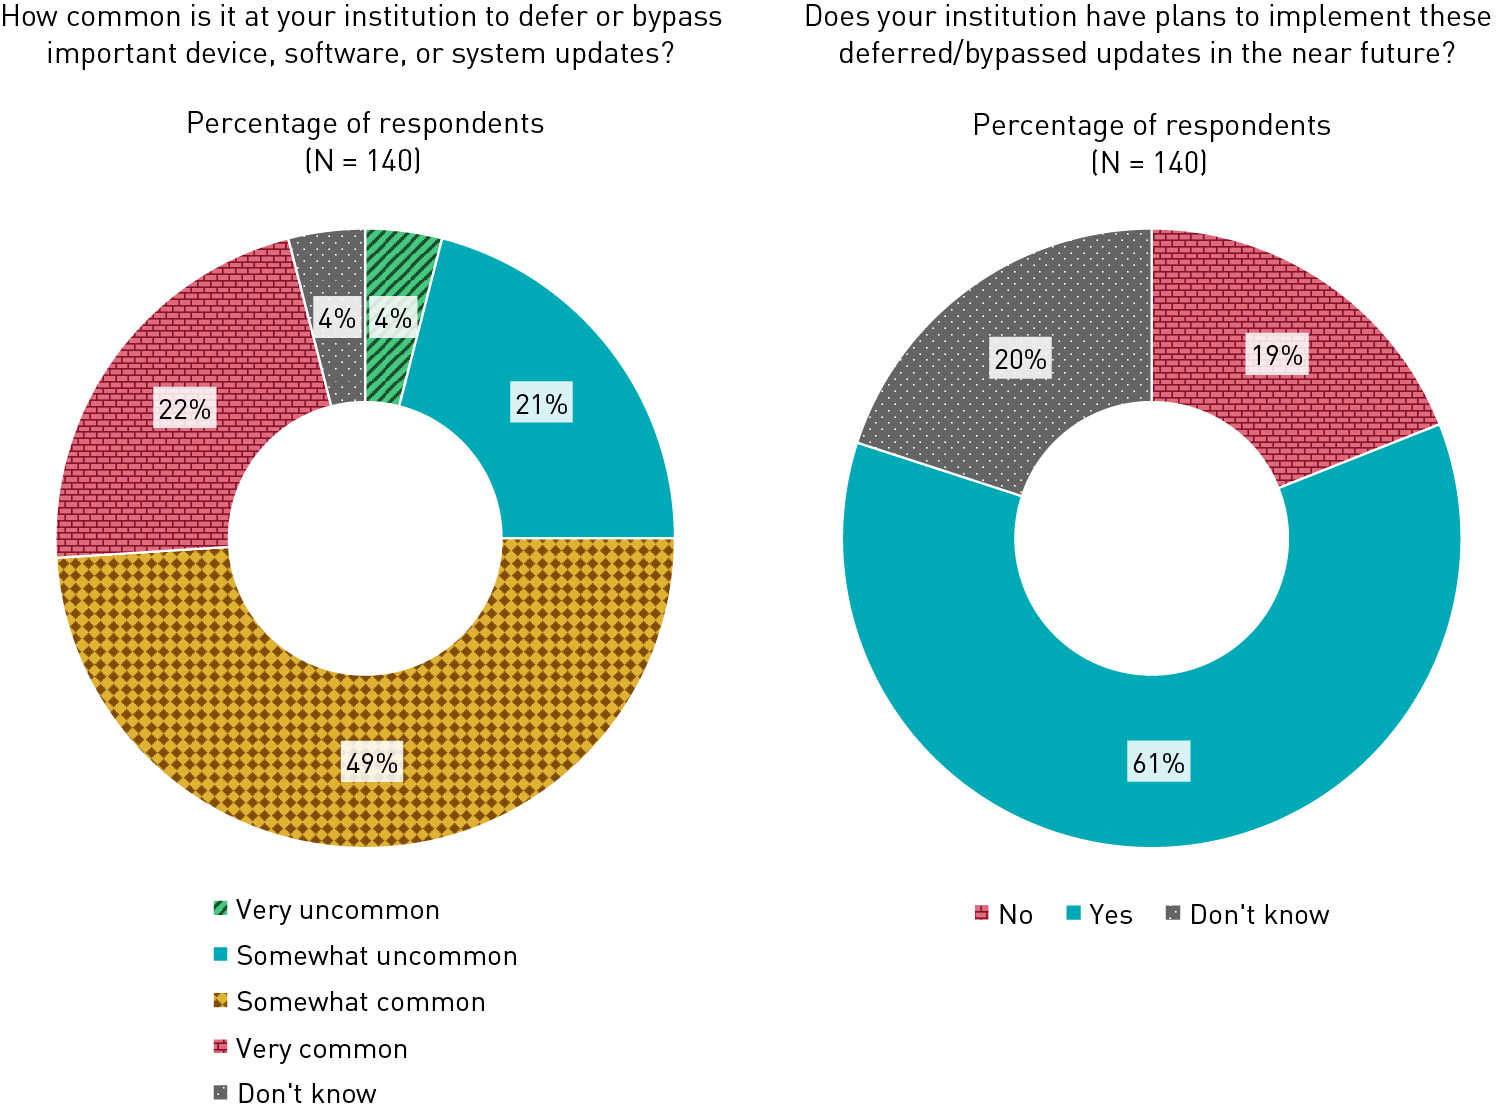
Among those respondents, a full 71% reported that this is a “somewhat” or “very” common occurrence at their institution. The majority of those respondents (61%) also, however, reported that their institution has plans to implement those lagging updates in the near future (see figure 2).
Asked to describe the updates their institution has deferred or bypassed, respondents most commonly cited:
- Updates to the institution’s network gear and infrastructure (e.g., servers, switches, and improved Wi-Fi)
- Hardware upgrades, including computers, phones, classroom audio/visual equipment, and public safety equipment
- Software upgrades, including the institution’s core operating systems and enterprise resource planning systems (ERPs)
For many of our respondents, these deferrals and delays are a “normal” experience, particularly where budgets and/or staffing are constrained. Rather than implement formal replacement or upgrade cycles for devices and software, institutions prioritize the most urgent needs and delay others, sometimes for years longer than is advisable. And for some respondents, these delays accumulate over time, creating a backlog of needs that outpaces available funding and support.
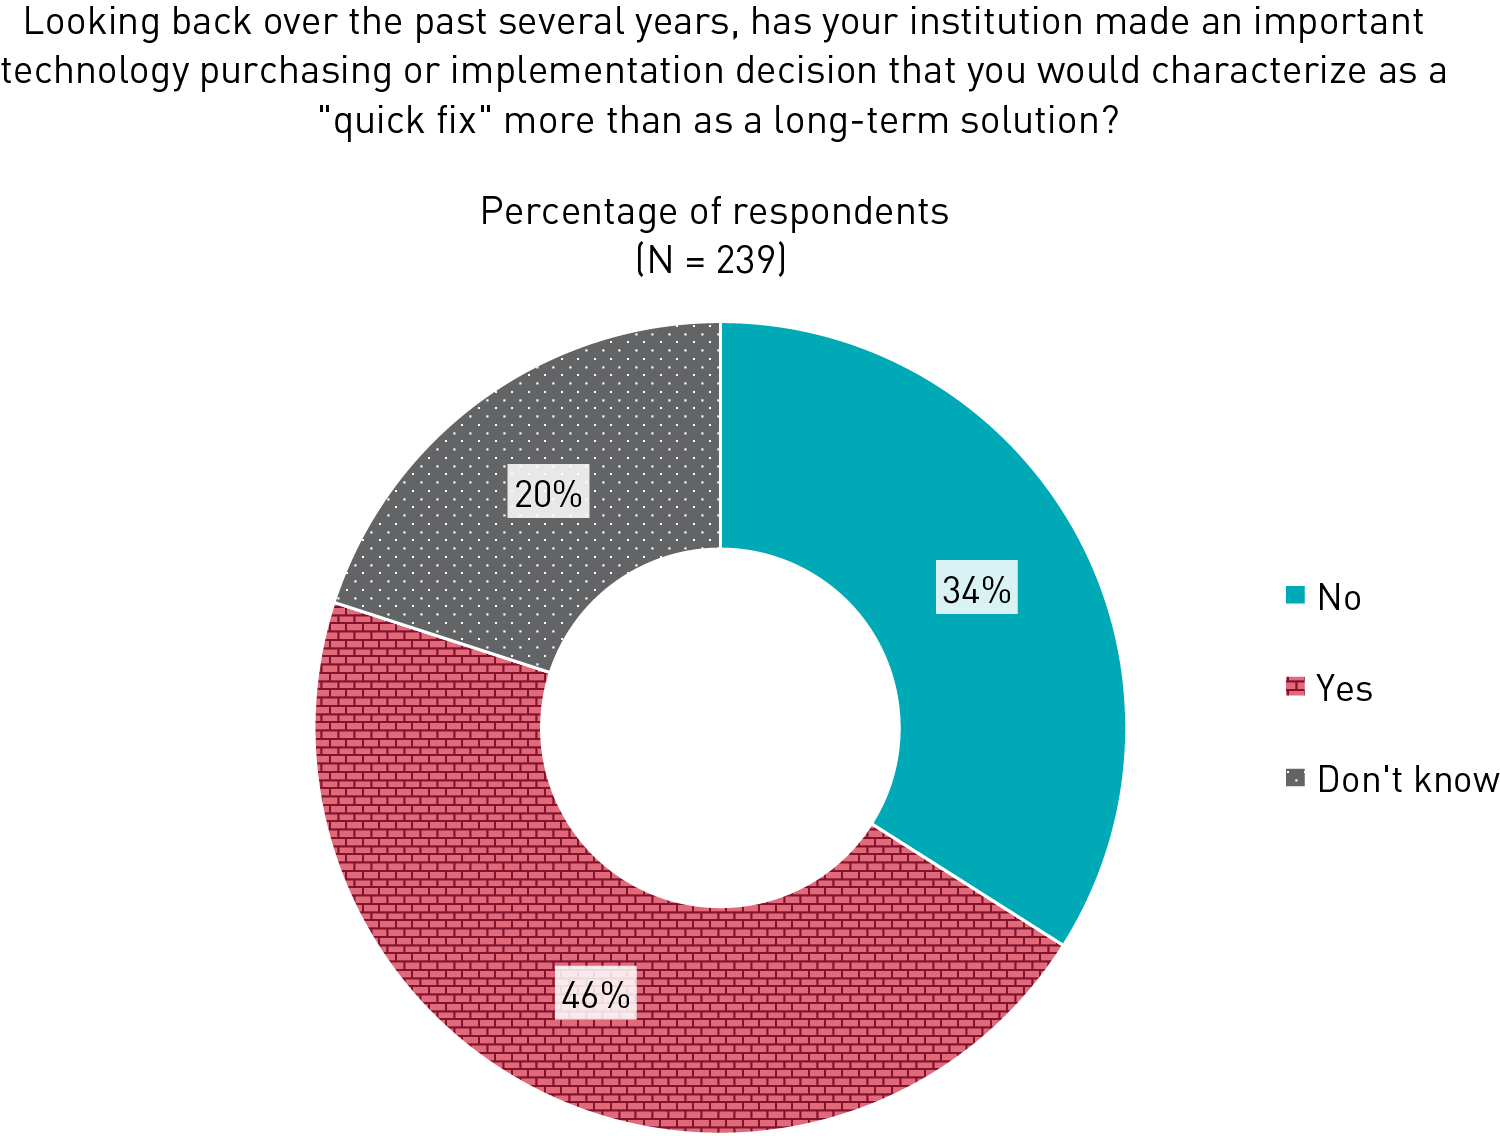
Quick fixes are also cheap fixes. A plurality of respondents (46%) reported that their institution has made a technology purchasing or implementation decision in the past few years that they would characterize as a quick fix (see figure 3).
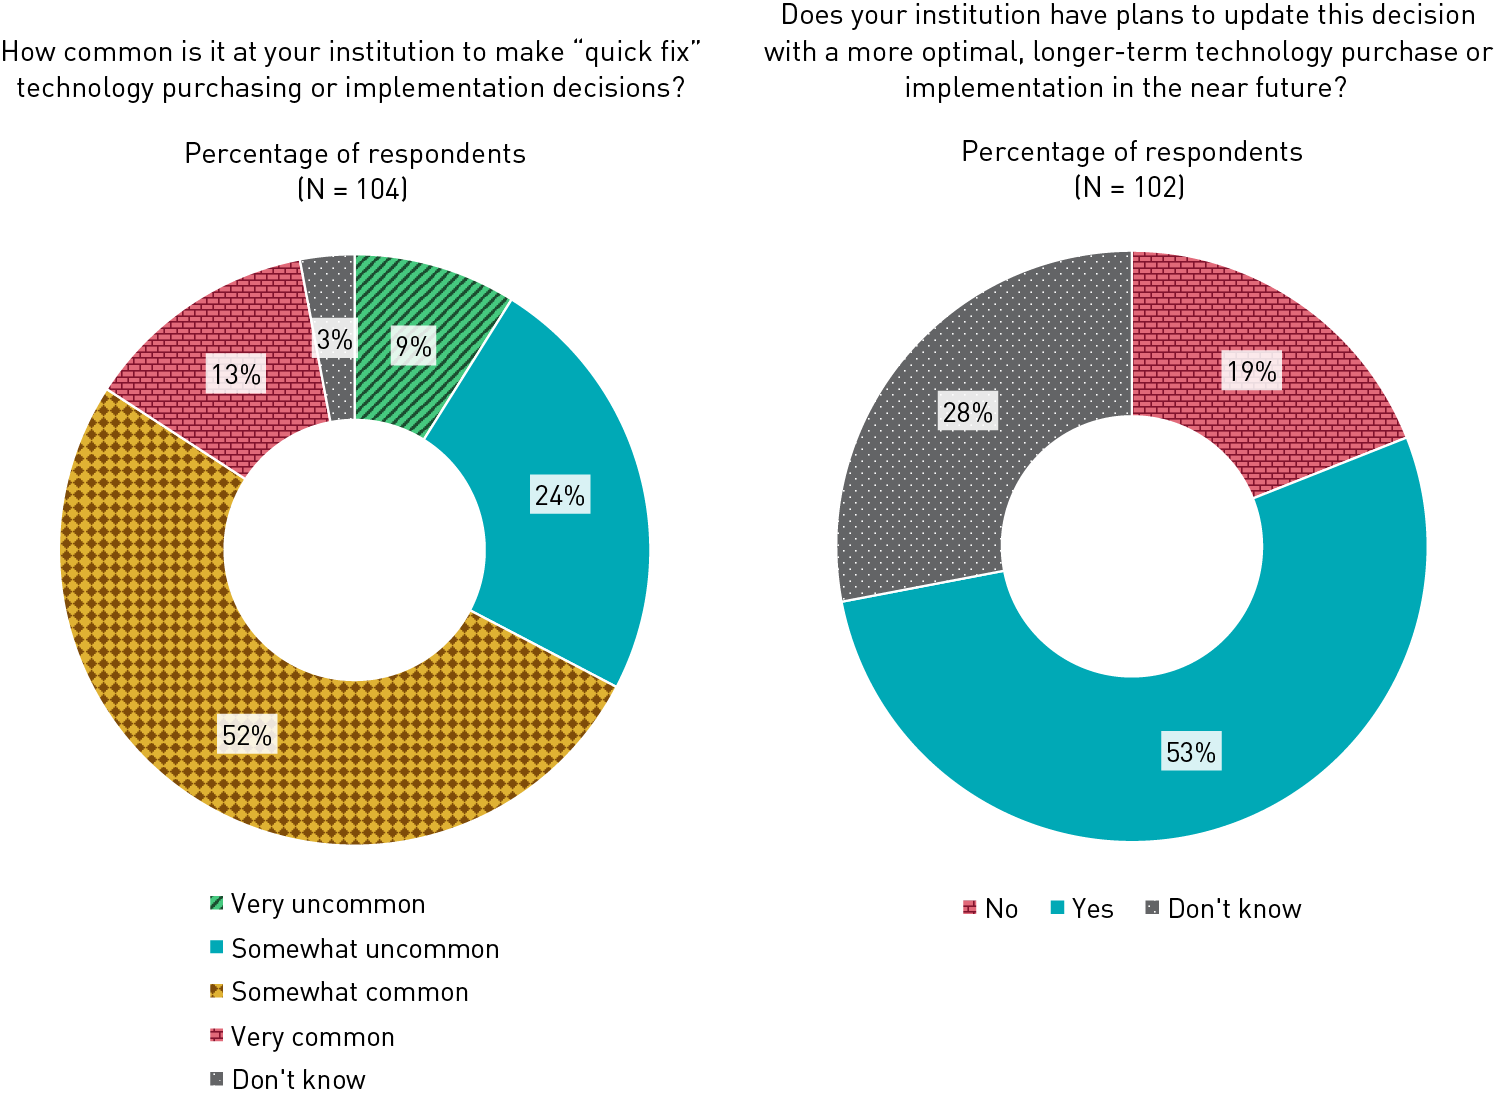
As with deferred or bypassed updates, the majority of these respondents (64%) reported that quick-fix technology decisions are “somewhat” or “very” common at their institution, though a majority (53%) also reported plans for a more optimal purchase or implementation in the near future (see figure 4).
Asked to describe their institution’s quick-fix technology decisions, respondents most commonly cited:
- “Cheap” fixes to accommodate tight budgets, including implementing only partial or base-level solutions, selecting a less desirable (but more affordable) product, or purchasing used equipment
- Purchasing supplemental tools in an effort to avoid replacing larger legacy systems with functional limitations
- Making individual, siloed purchases instead of developing an enterprise-wide technology purchasing strategy
For many respondents, the realities underlying these decisions are that their institution is facing enrollment and budget challenges and that there simply isn’t support for more optimal (and more costly) technologies. Even when sufficient resources are available, decisions at some institutions seem to stem from broken procurement processes—the needs underlying a purchase aren’t fully explored or understood, options aren’t properly vetted before being purchased, and key stakeholders aren’t involved in the decision-making process where they should be.
The Data: The Impacts of Accruing Debt
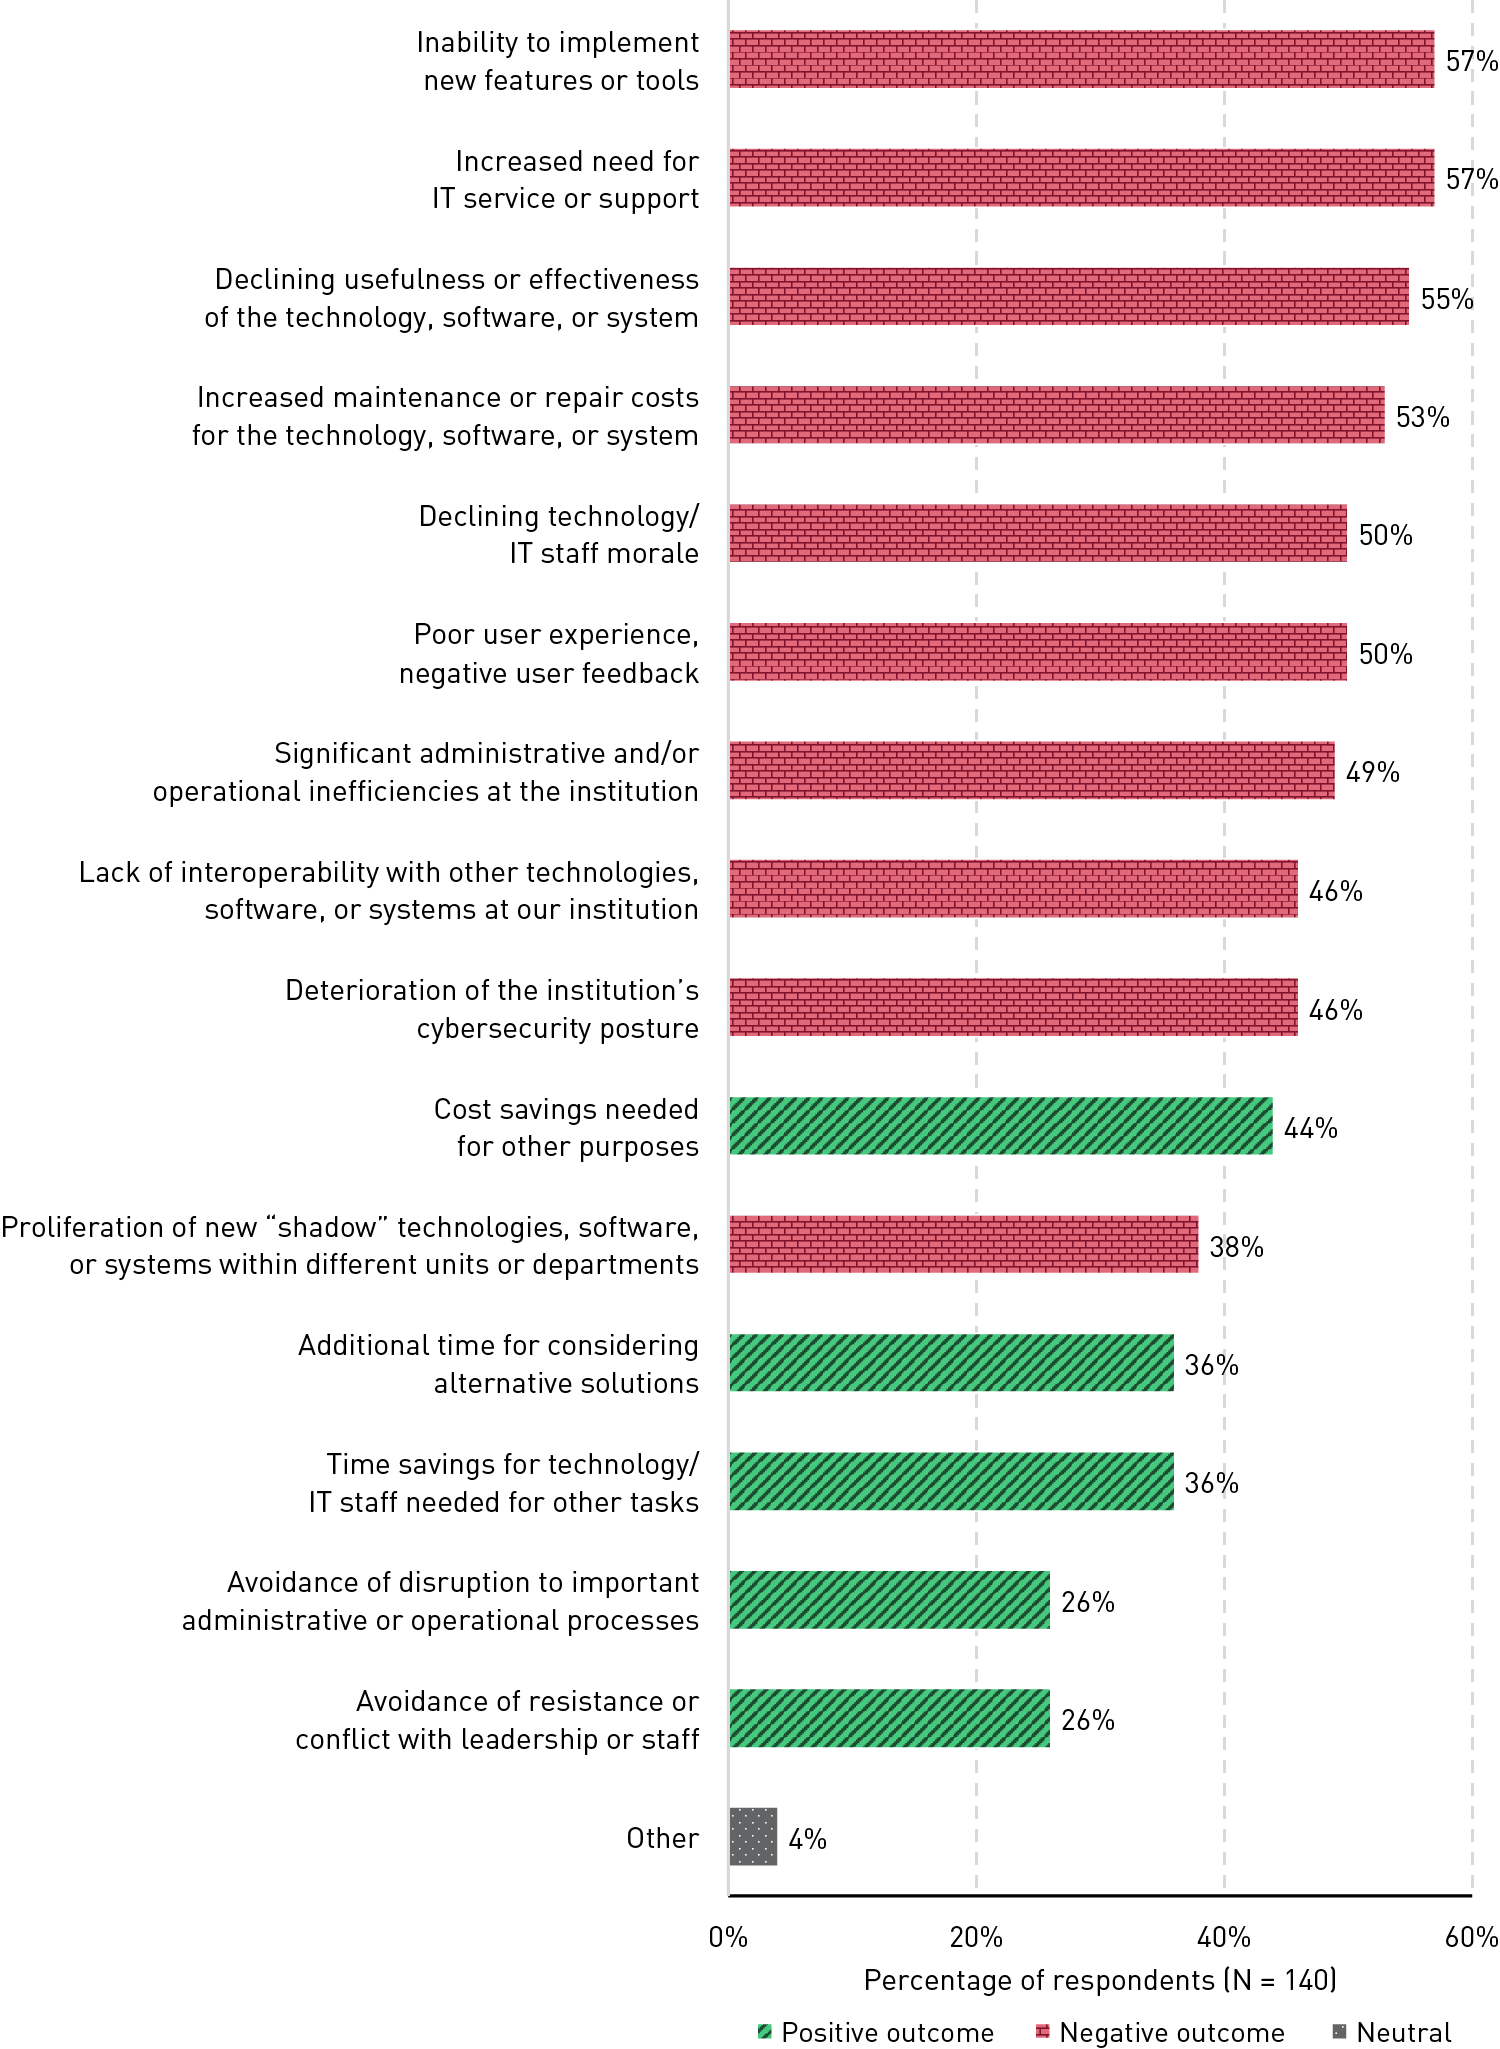
The consequences of assuming debt are mostly negative, though there are upsides too. Respondents were presented with a list of both positive and negative outcomes from having deferred or bypassed important technology updates (see figure 5). Respondents leaned toward the negative results of debt decisions, highlighting such results as an increased need for IT service or support, an inability to implement new features, and declining usefulness or effectiveness of the outdated technologies. Just under half of respondents (44%) did, however, report seeing cost savings that were directed to other purposes. And more than a third of respondents reported gaining time as a result of these decisions, time for leaders to consider alternative solutions (36%) and for technology/IT staff to devote to other tasks (36%). Among the negative results we asked about, 96% of respondents reported experiencing at least one and 91% reported experiencing more than one, averaging 5.02 negative results per respondent. From the (albeit fewer) positive results we asked about, 85% of respondents reported experiencing at least one and just under half (49%) reported experiencing more than one.
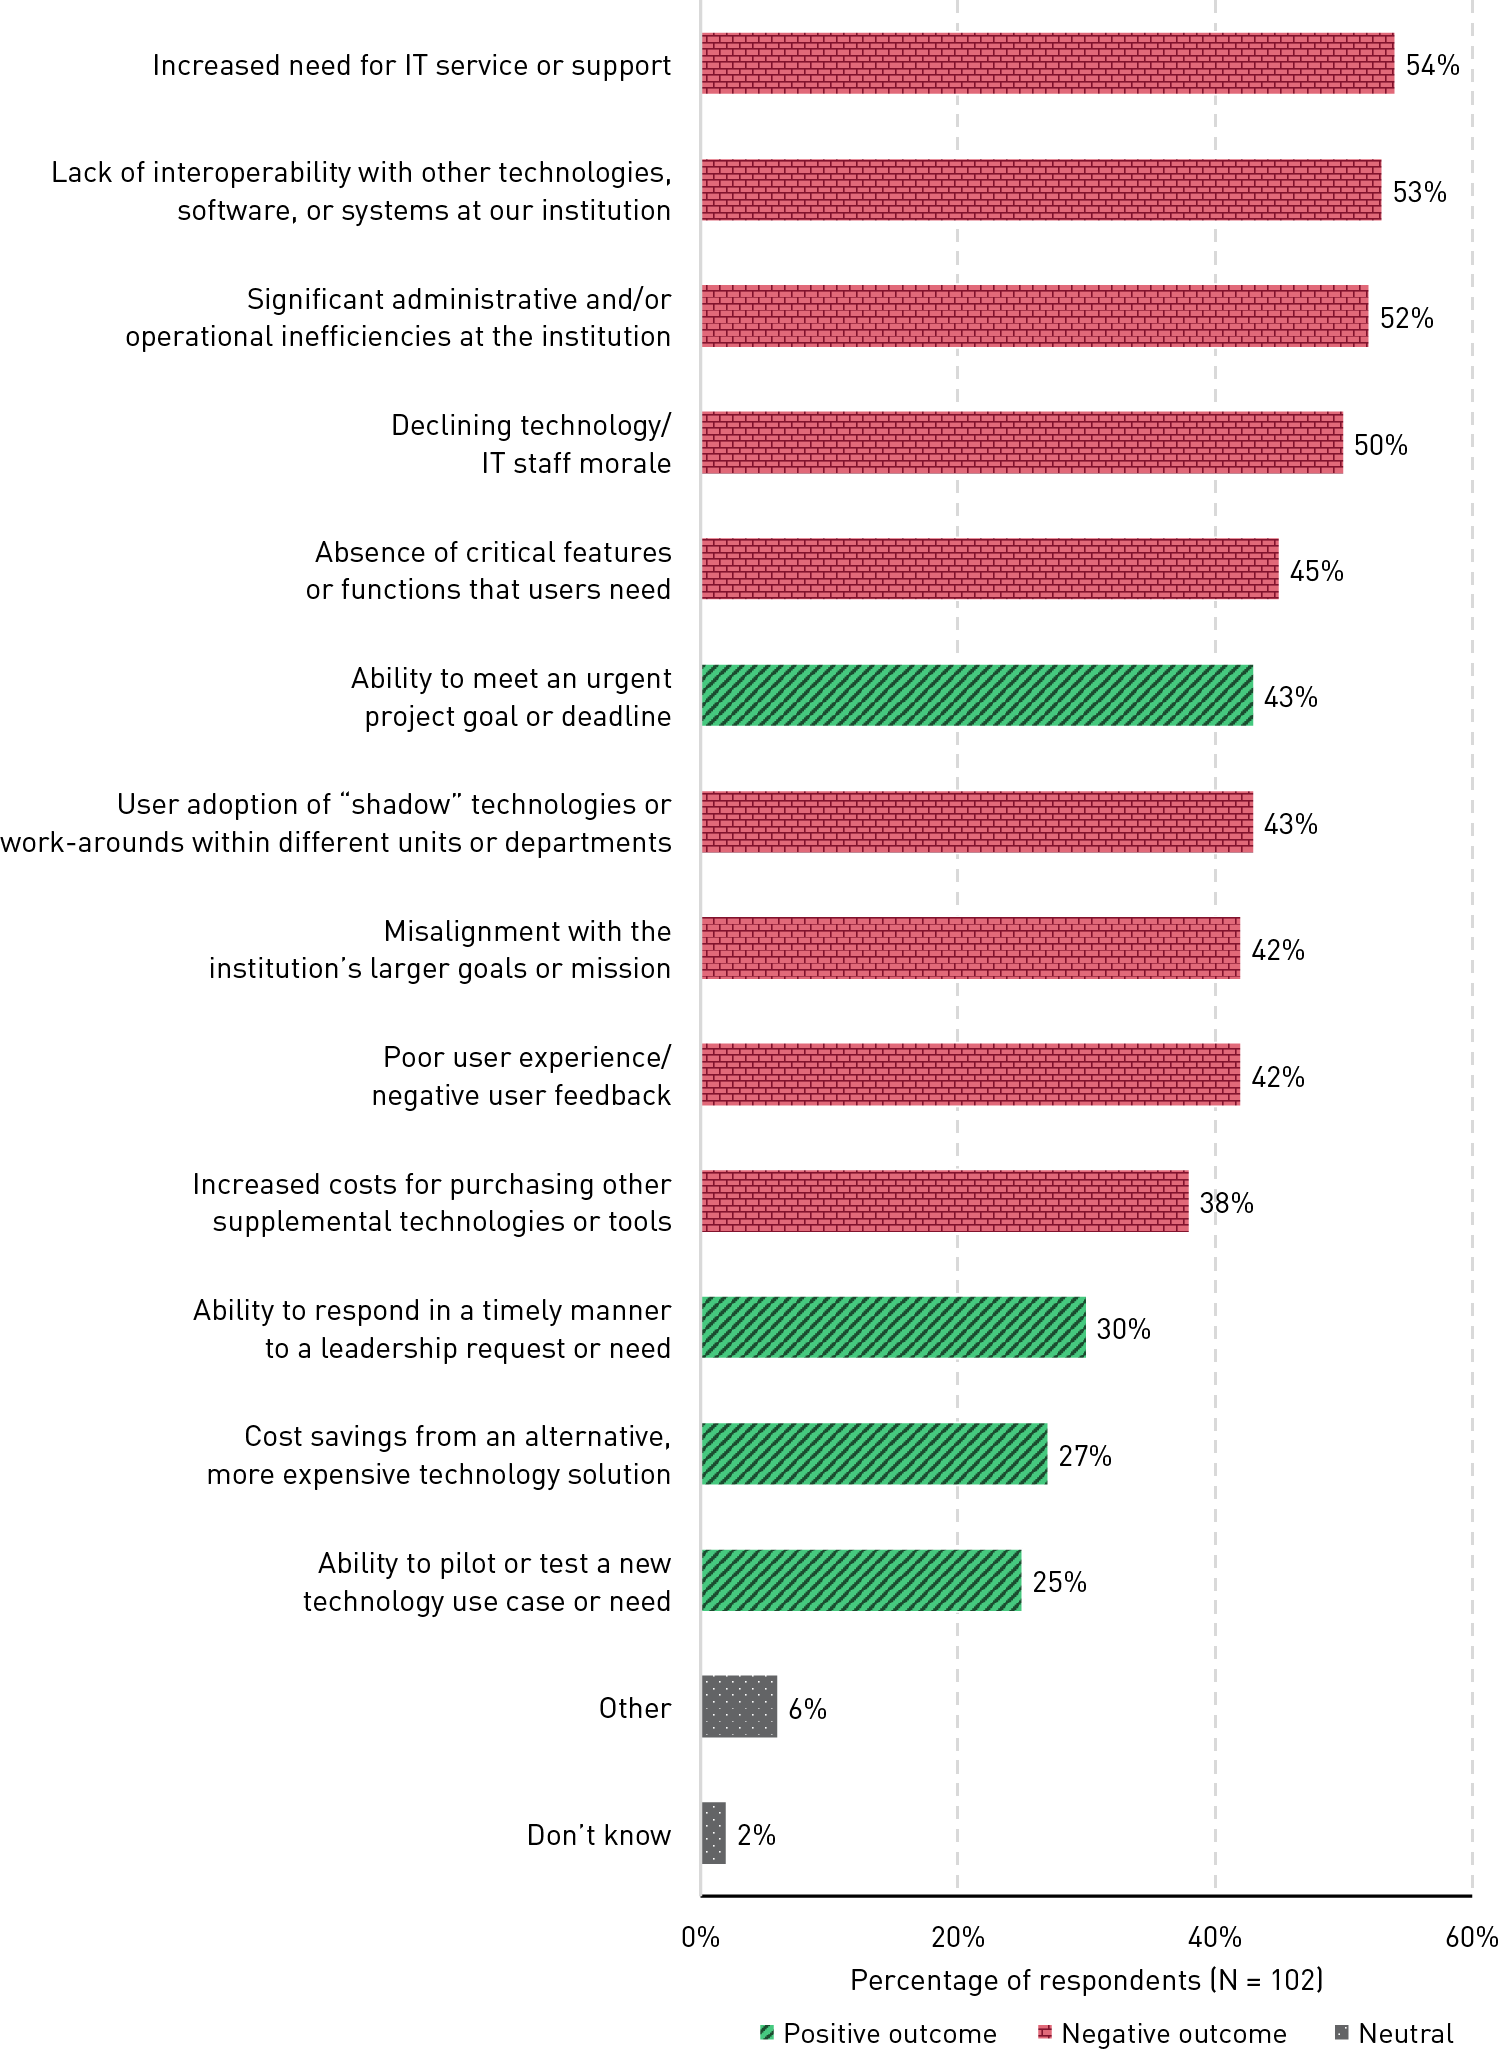
Quick fixes may allow for agility, but not without risks. Respondents also leaned toward the negative results of their institution’s quick-fix technology decisions (see figure 6). Respondents again highlighted the increased need for IT service or support, as well as a lack of interoperability with other technologies and significant administrative and/or operational inefficiencies. Top among the positive results of these quick-fix decisions, 43% of respondents reported that these decisions allowed them to meet an urgent project goal or deadline, while another 30% reported that these decisions allowed them to respond in a timely manner to a leadership request or need. Among the negative results we asked about, 94% of respondents reported experiencing at least one and 82% of respondents reported experiencing more than one, averaging 4.20 negative results per respondent. From among the (again, fewer) positive results, 64% of respondents reported experiencing at least one, while only a third (36%) reported experiencing more than one.
Worth noting is that respondents who reported at least one positive result from the decision to take on some form of technology-related debt were no less likely to report negative results as well. In other words, even reasonable or necessary decisions to assume technical debt for the purposes of a clear upside are not without their downsides. This is not to dissuade teams from making the decisions they must sometimes make but rather to encourage a realistic and clear-eyed approach to making those decisions. Understanding and communicating the potential risks of certain decisions might put technology teams in a better position to mitigate or at least to more effectively weather those risks.
The Data: Other Types of Institutional Debt
The technology-related debts discussed above could be further intensified by, and perhaps even become entangled with, other forms of institutional debt, such as cultural debt (e.g., institutional processes, decision-making, communications) and operational debt (e.g., institutional budgeting, staffing, and structure).
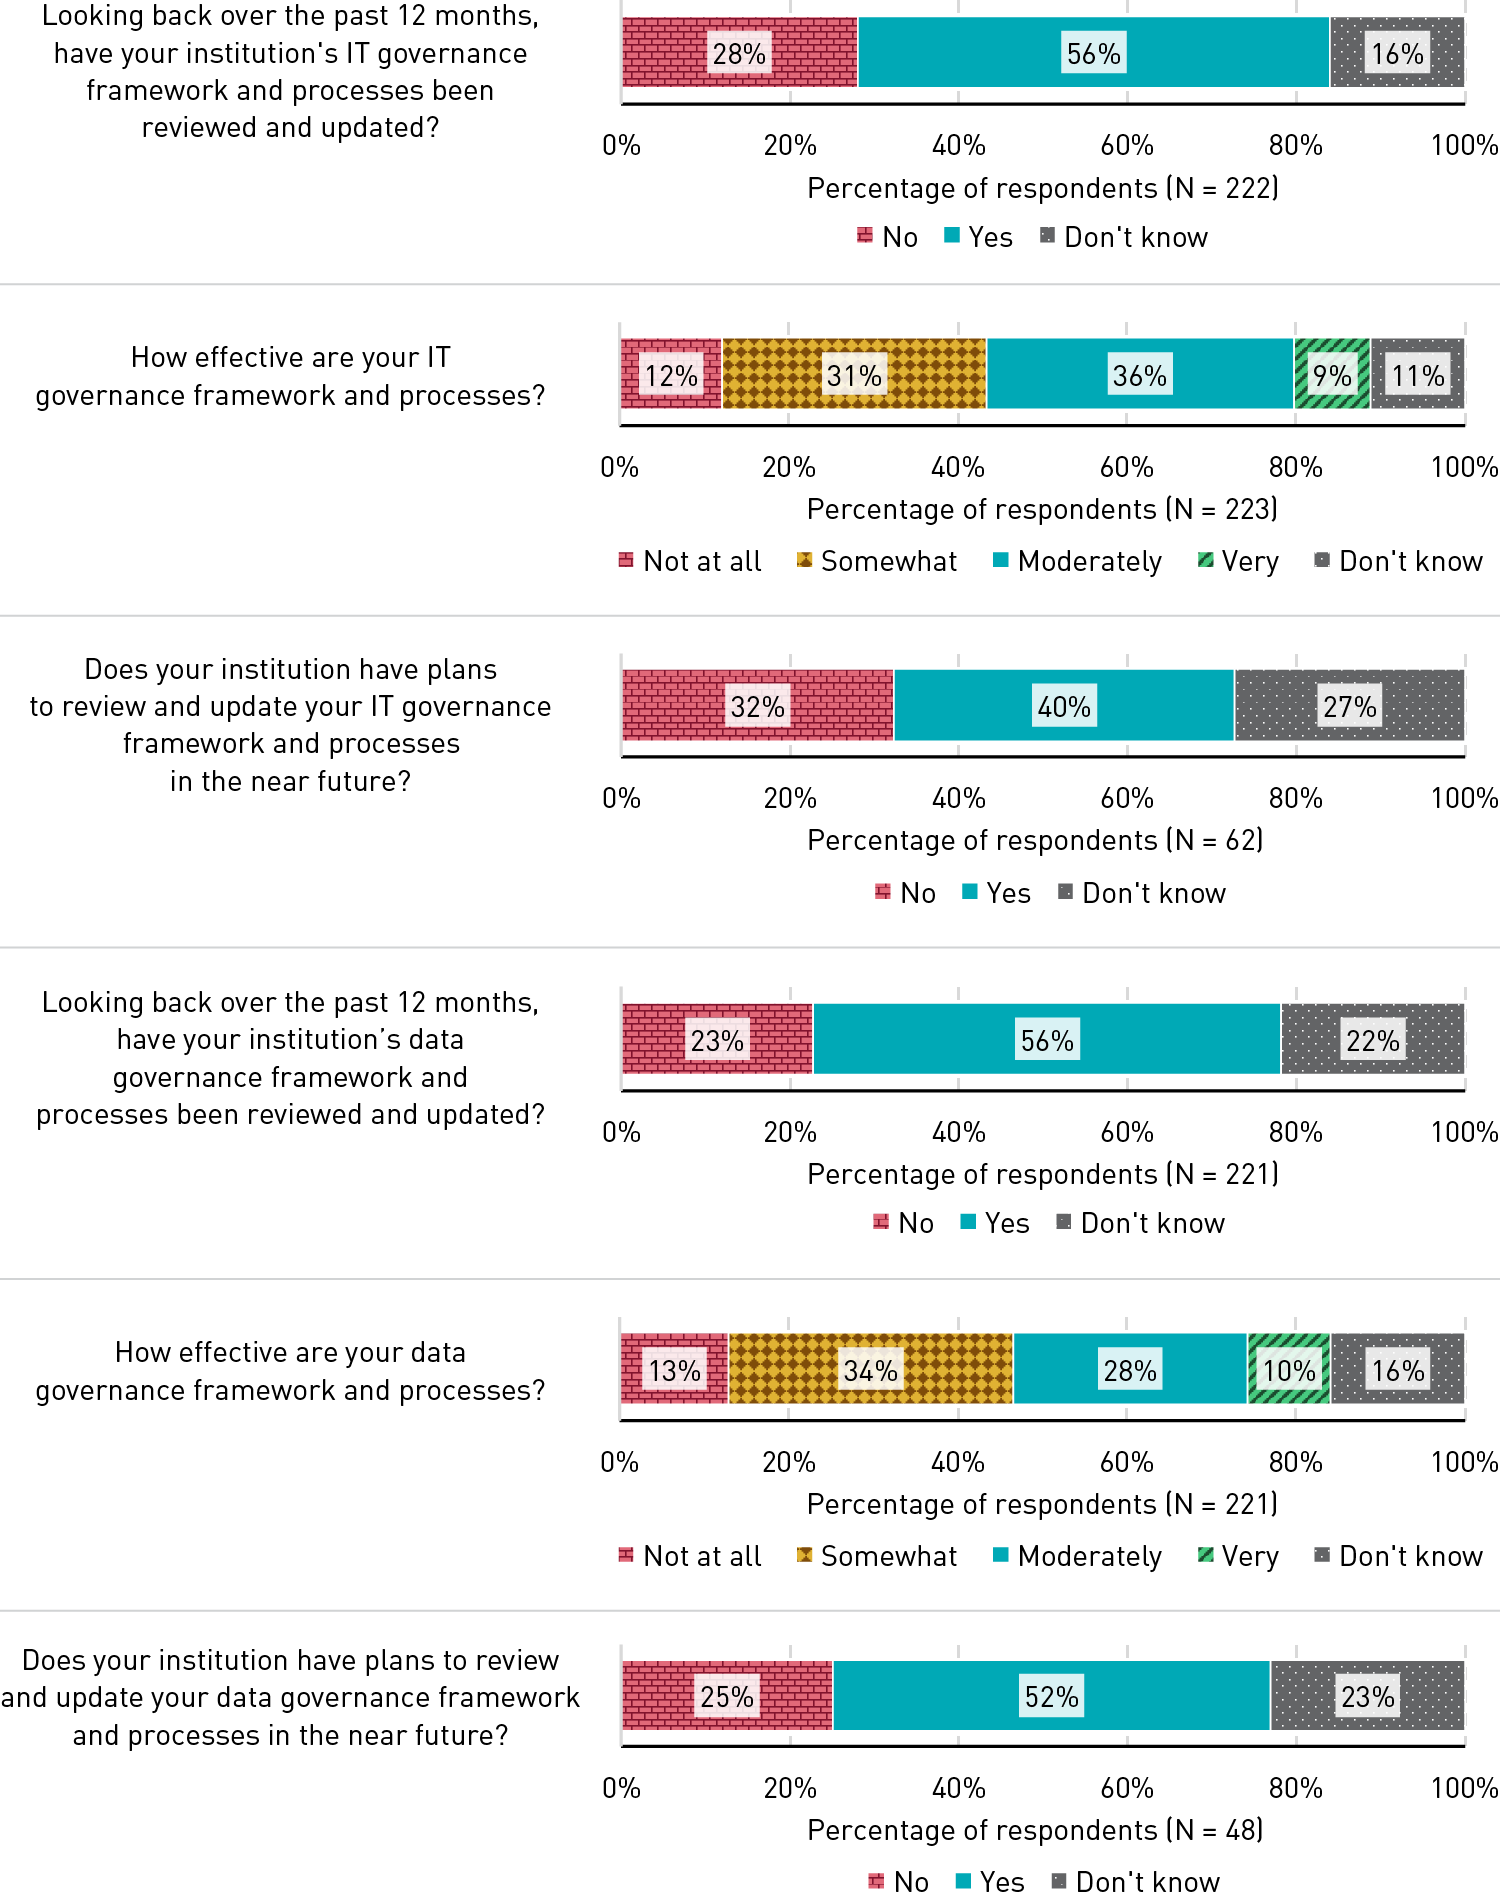
Near-term plans for IT governance may be lagging. Asked whether their IT and data governance frameworks and processes had been reviewed and updated within the past 12 months, majorities of respondents reported that they indeed had been (56% for both IT governance and data governance) (see figure 7). Among those respondents whose governance frameworks and processes had not been updated, only 40% reported that their institution had plans to update IT governance in the near future, while 52% reported plans for updating their data governance in the near future.
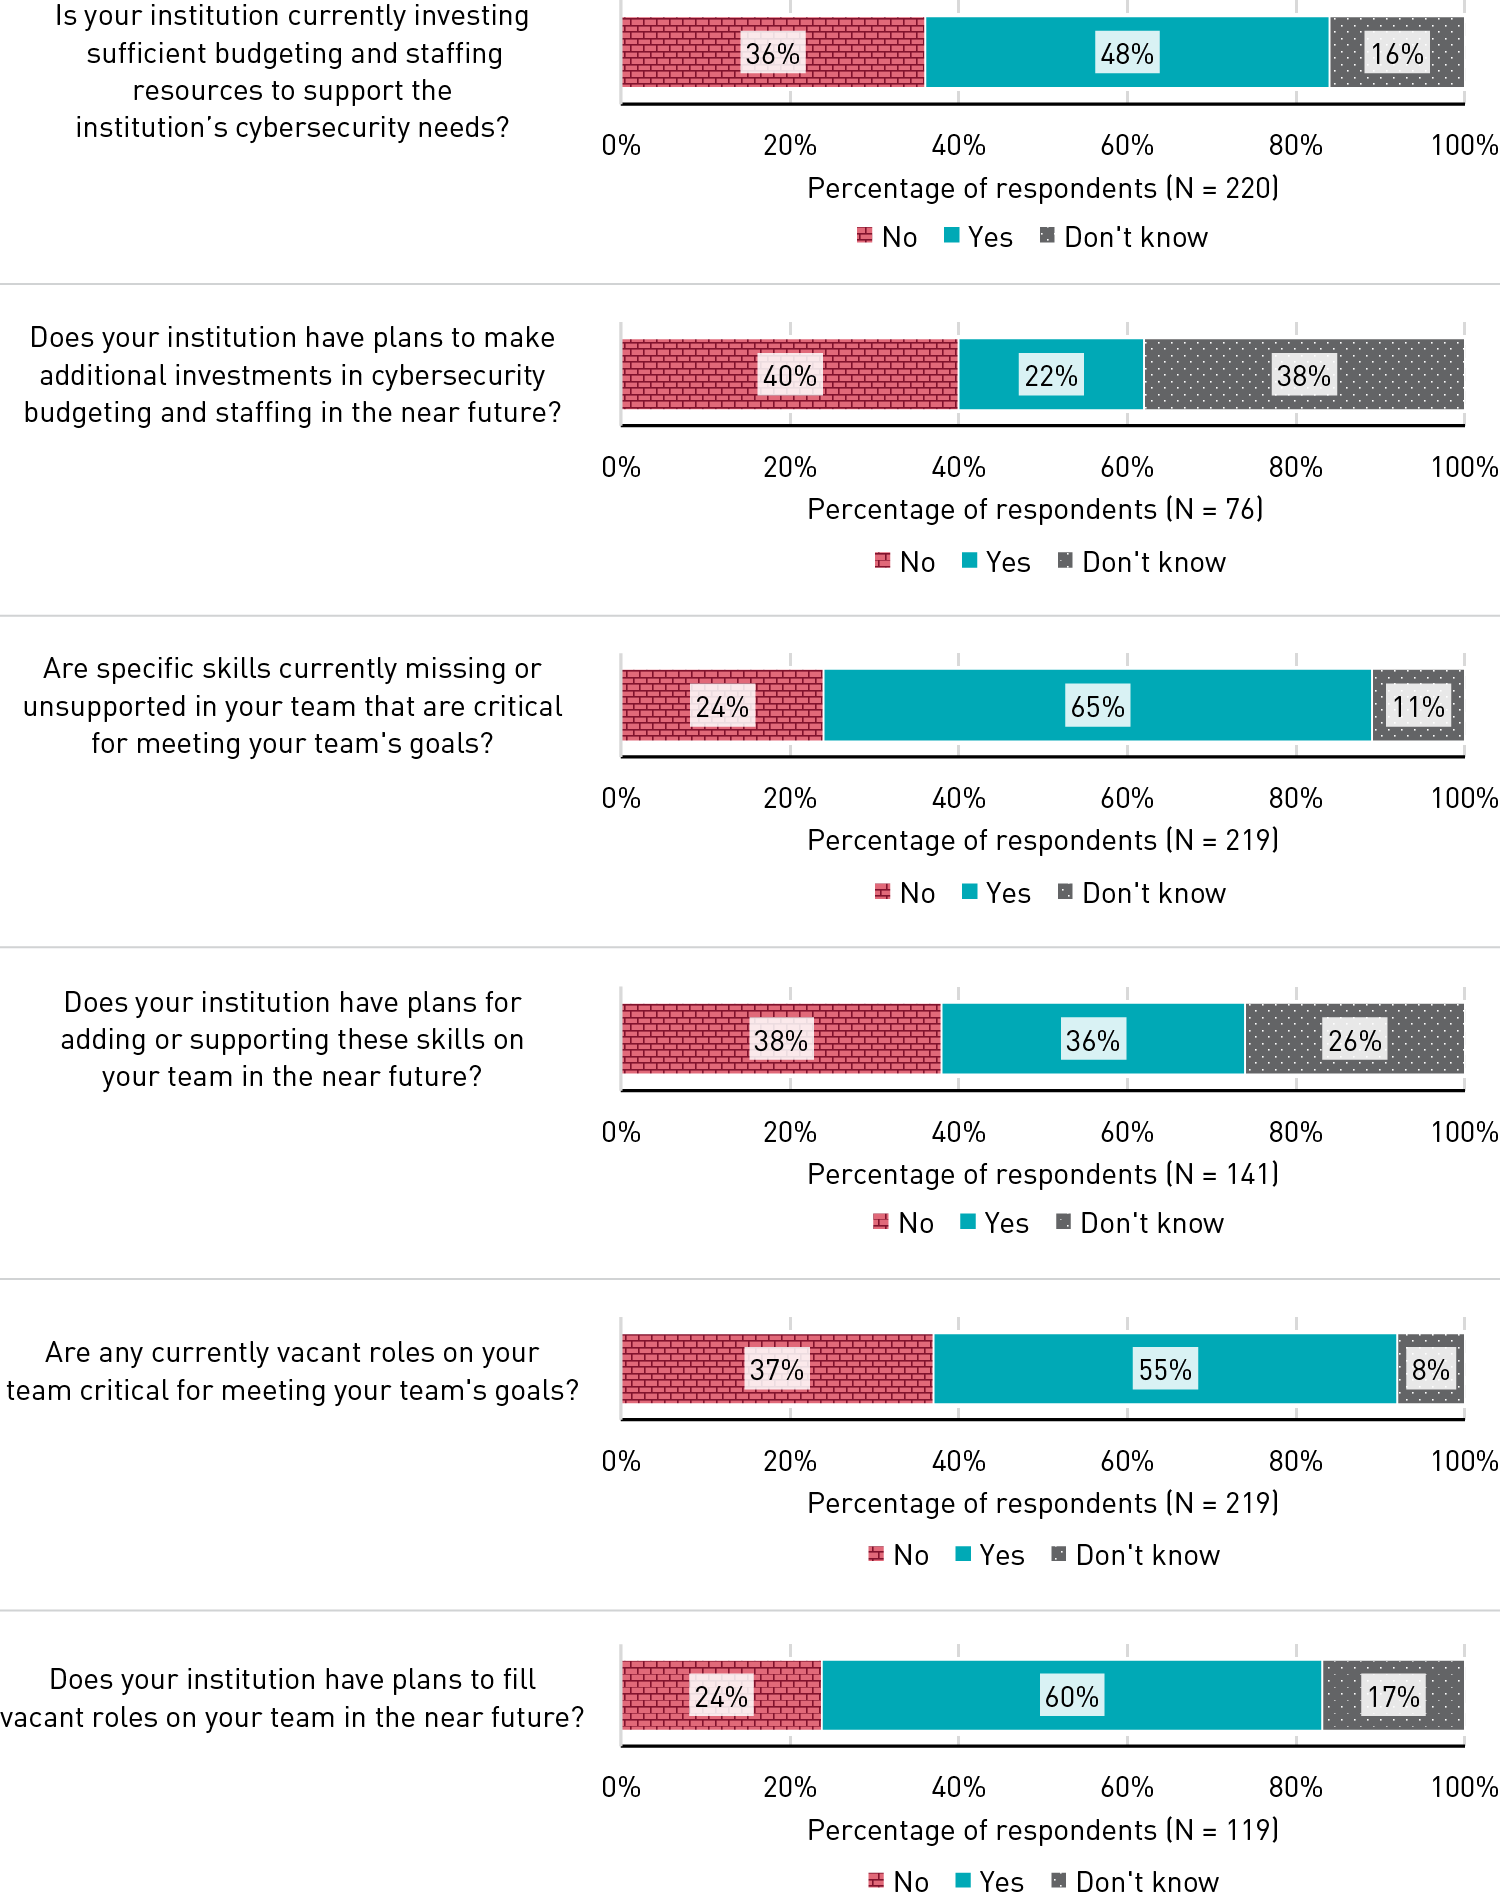
Cybersecurity infrastructure and critical team skills may be left unsupported. Asked about their institution’s investments in cybersecurity, just under half of respondents (48%) reported that their institution is currently investing sufficiently in budget and staffing to meet their cybersecurity needs (see figure 8). Among those reporting that their institution is not currently investing sufficiently in this area, only 22% reported plans to make these investments in the near future. Majorities of respondents reported that their team is currently missing specific, critical skills for meeting goals (65%) and that they currently have vacant roles on their team that are critical for meeting those goals (55%). While a majority of those respondents (60%) reported plans to fill their team’s vacant roles in the near future, only 36% reported plans to add or support the critical skills needed on their team.
Debts could be compounding for smaller institutions. Regardless of size or type, most institutions may have to assume some technical, cultural, operational, or other debt at different times and for varied reasons, yet the ability to “pay back” or correct those debts in the long term may not be evenly distributed. Specifically, small institutions (those with fewer than 5,000 students) may have fewer resources (financial, staffing, technical, or otherwise) than large institutions (those with more than 20,000 students) to redistribute or marshal resources toward filling gaps, catching up on delays, or correcting suboptimal decisions. We see potential evidence of this in IT governance, where respondents from the smallest institutions are far less likely to report plans to update IT governance in the near future than respondents from the largest institutions (see table 1). We also see it in institutional plans to add or support critical skills that teams are currently missing—respondents from the smallest institutions lag far behind their peers at the largest institutions.
Table 1. Plans to Update IT Governance and Support Missing Skills, by Institution Size
|
Smallest Institutions (student fall enrollment 1,000–4,999) |
Largest Institutions (student fall enrollment 20,000+) |
|
|
Does your institution have plans to review and update your IT governance framework and processes in the near future? (percentage “Yes”) |
25% (N=24) |
58% (N=19) |
|
Does your institution have plans for adding or supporting these skills on your team in the near future? (percentage “Yes”) |
28% (N=36) |
50% (N=46) |
Common Challenges
Institutional realities are working against effective decision-making. The best technology decisions are sometimes the costliest. And the most effective technology management practices may feel out of reach when both staff and time are in short supply. For many institutions, particularly where budgets and staffing still haven’t returned to pre-COVID levels, resource realities simply may not be conducive to “best case scenario” decision-making.
Institutional debts compound, and so do their solutions. As one-off decisions to defer technology upgrades gather into clusters of multiple decisions across areas of the institution’s technology needs, this approach can put technology/IT teams further behind than they can catch up. Compounded debt, then, may require more time- and resource-intensive fixes than any one single incurred debt may have demanded on its own.
Promising Practices
Planning should be clear and realistic. Institutional realities may necessitate or even benefit from the accrual of some debt, but there are better and worse ways of accruing such debt. Communication with leadership and staff should be honest and clear about the potential risks of technical and other debt, and (to the extent possible) plans should be put into place early to minimize the most consequential and most avoidable risks.
Focus on people. Technology deferrals and quick fixes add strain to technology/IT teams in the form of increased maintenance and support needs, and they risk diminishing team morale in any higher education environment that is already characterized by stress and excessive workloads. Strategies for improving work-life balance and building in flexible work schedules and arrangements will be vital for ensuring that staff are supported and healthy.
All QuickPoll results can be found on the EDUCAUSE QuickPolls web page. For more information and analysis about higher education IT research and data, please visit the EDUCAUSE Review EDUCAUSE Research Notes topic channel. For information about research standards, including for sponsored research, see the EDUCAUSE Research Policy.
Note
- QuickPolls are less formal than EDUCAUSE survey research. They gather data in a single day instead of over several weeks and allow timely reporting of current issues. This poll was conducted January 27–28, 2025, consisted of 25 questions, and resulted in 239 responses for analysis. The poll was distributed by EDUCAUSE staff to relevant EDUCAUSE Community Groups rather than via our enterprise survey infrastructure, and we are not able to associate responses with specific institutions. Our sample represents a range of institution types and FTE sizes.Jump back to footnote 1 in the text.
Mark McCormack is Senior Director of Research and Insights at EDUCAUSE.
© 2025 Mark McCormack. The content of this work is licensed under a Creative Commons BY-NC-ND 4.0 International License.