
Increasing financial pressures have led many colleges and universities to move toward greater centralization of their IT departments.

Colleges and universities are facing increased financial pressures due to declining enrollments, rising costs, and recent changes to the Free Application for Federal Student Aid, among other challenges. Some higher education institutions have responded to these challenges by centralizing their IT resources. I recently conducted a study into the CIO reporting structures and level of IT department centralization at 340 baccalaureate, master's, and doctoral institutions. The results of this research suggest that CIOs are increasingly being recognized as strategic partners in their institutions.
CIO Reporting
According to my research, CIOs most frequently report to the president, followed by the CFO and provost (see table 1).Footnote1 My finding related to the percentage of CIOs that report to the president is similar to that in the EDUCAUSE 2021 CIO workforce study, which found that 39 percent of CIOs report to the "president/chancellor/CEO." Both of these percentages are significantly higher than the 2019 EDUCAUSE workforce study, which found that 29 percent of CIOs report directly to the president.Footnote2
| Reports to | Count | % of Total |
|---|---|---|
| President |
138 |
40.6% |
| CFO |
111 |
32.6% |
| Provost |
43 |
12.6% |
| All Others |
48 |
14.2% |
| Total |
340* |
|
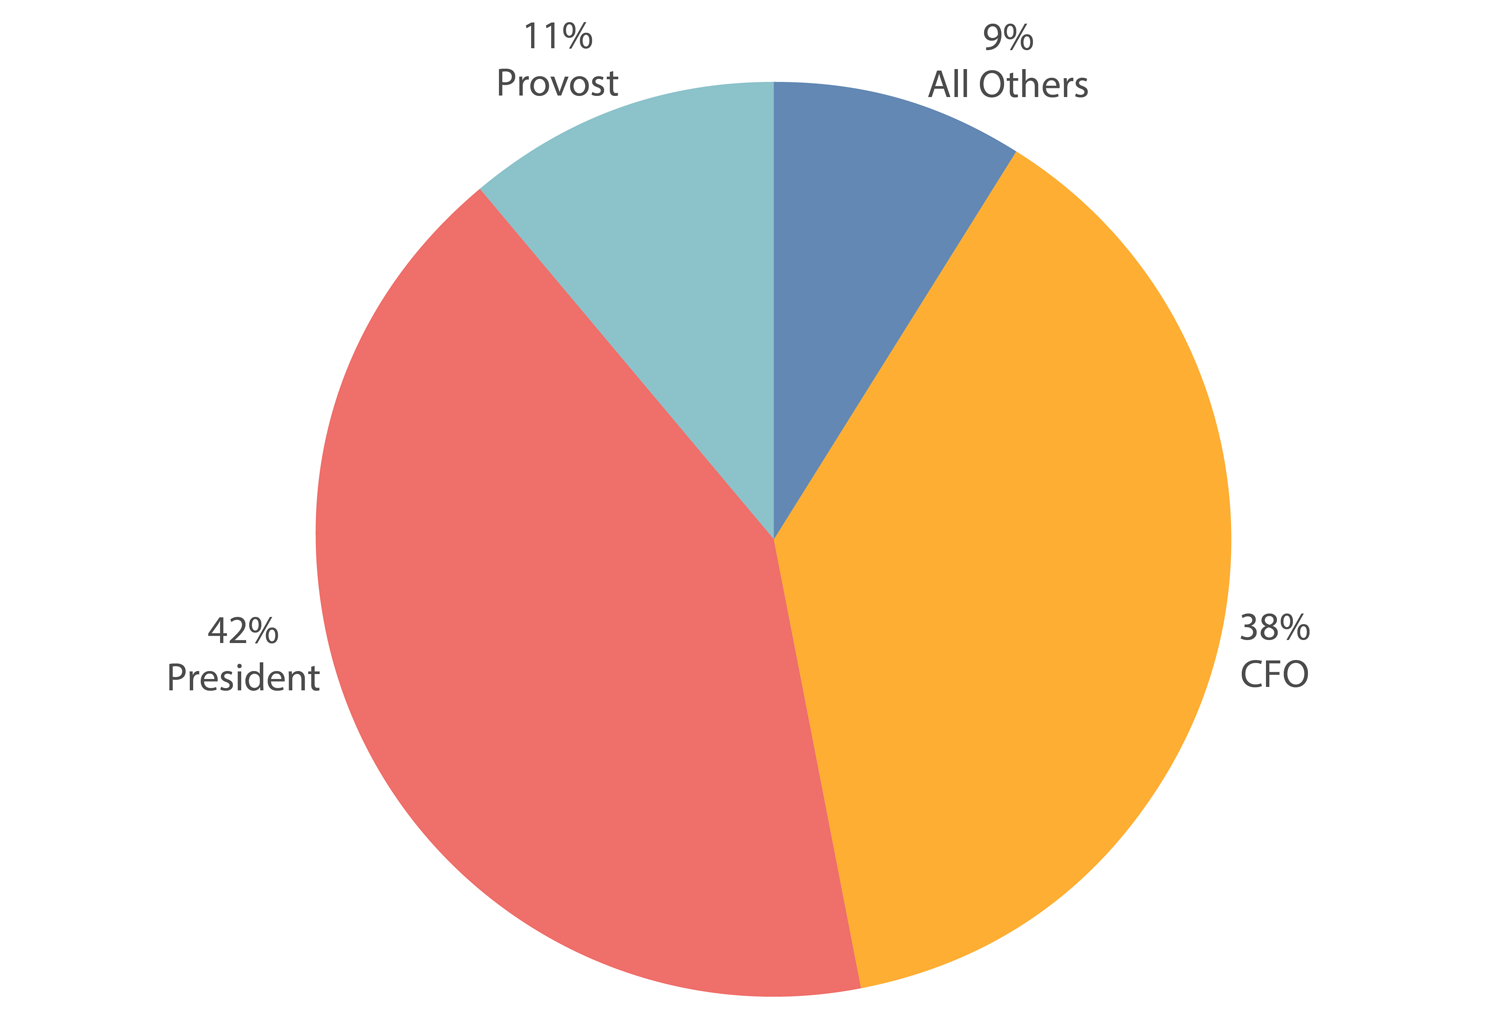
The shift in CIO reporting structures suggests that CIOs are increasingly recognized as strategic partners in their institutions; however, a deeper dive deeper into the data reveals nuances across various institutional types. For example, while the CIO reporting distribution at baccalaureate and master's institutions aligns closely with the distribution in table 1, a higher percentage of CIOs report to the CFO (38 percent) in these types of institutions compared to the overall distribution (see figure 1).
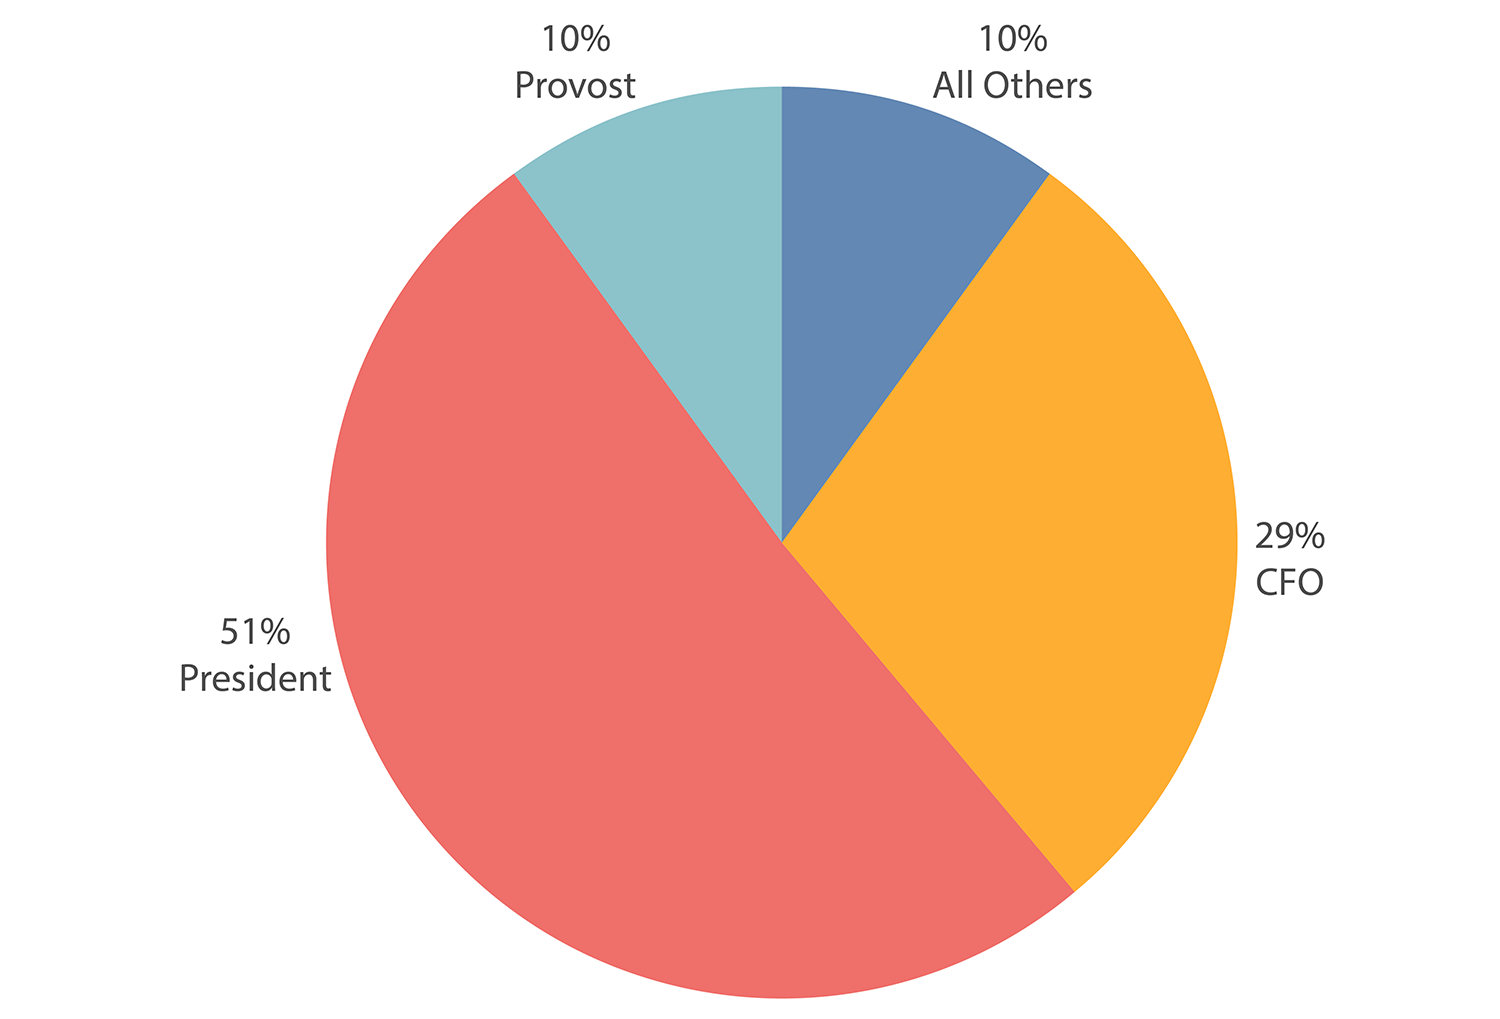
In contrast, the percentage of CIOs that report to the CFO is markedly lower in R2 (high research activity) doctoral institutions than in baccalaureate and master's institutions. Over 50 percent of the CIOs report to the president in R2 institutions (see figures 1 and 2).
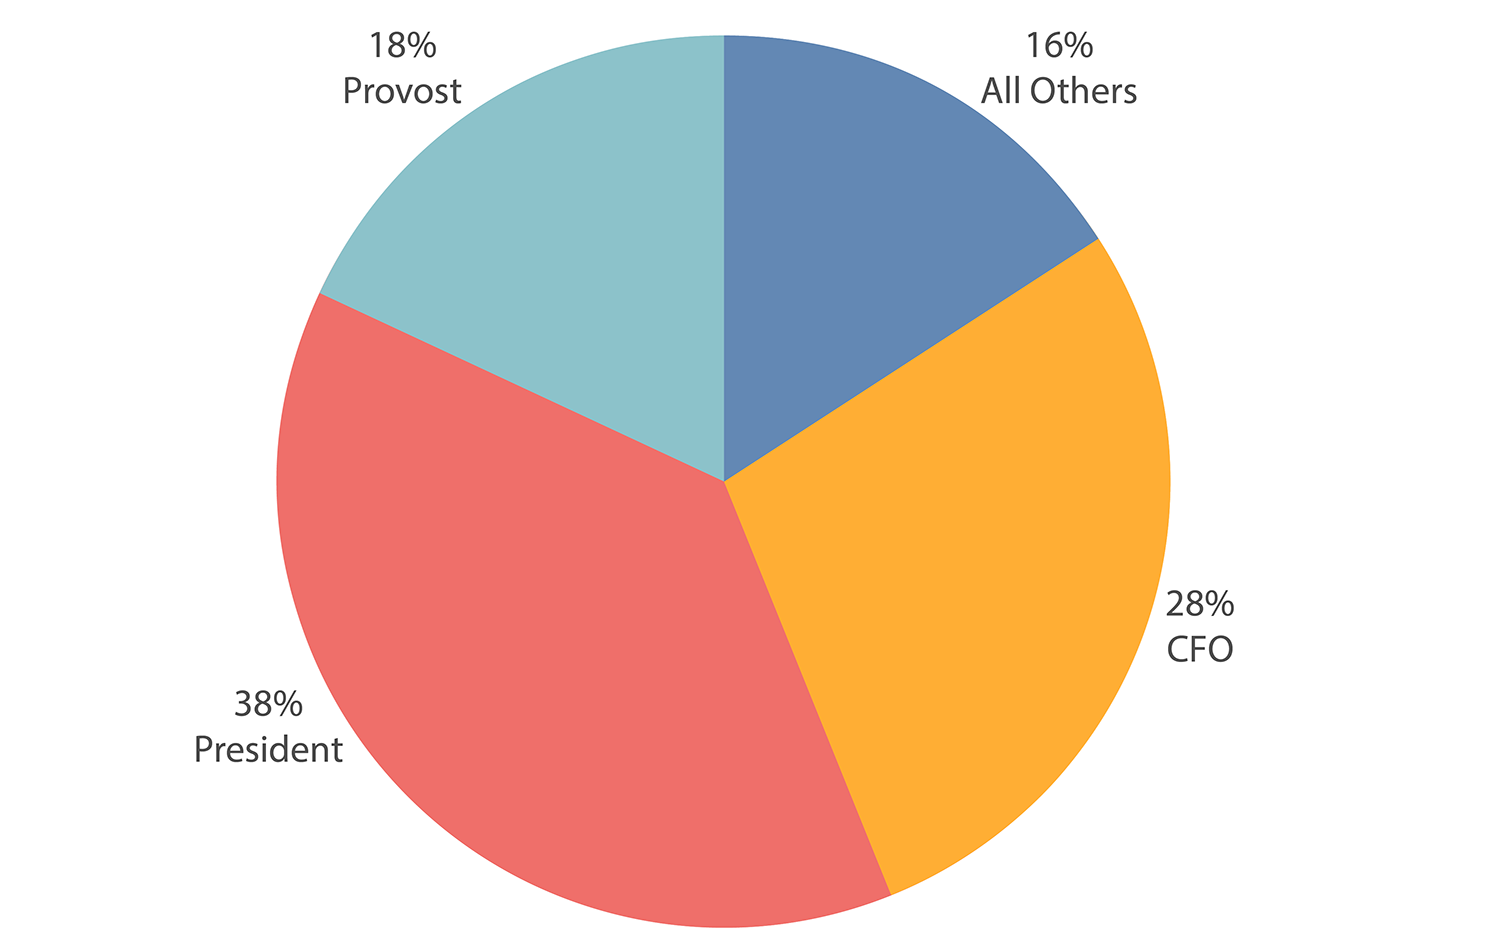
Interestingly, fewer CIOs report to the president in R1 (very high research activity) institutions than in the other institutional types; instead, more CIOs report to the provost or chief operating officer/executive vice president in R1s (COO/EVP are collapsed into the "all others" category in table 1) (see figure 3). This diversity in reporting structures highlights the unique strategic needs of R1 and R2 institutions, such as the degree to which academic and research missions are prioritized.
Another element of the strategic alignment of IT departments at higher education institutions is the degree to which IT departments are centralized or decentralized.
Centralization
The terms "centralization," "decentralization," "dispersed IT," and "consolidated IT" describe the spectrum of approaches to managing IT resources within higher education institutions. Centralized IT operations refers to organizations in which all IT activities are managed by the most senior IT officer. Conversely, decentralized IT operations means that the control of resources and activities is spread across various departments and units.
EDUCAUSE defines central IT as a "centralized IT services and support organization reporting to the highest-ranking IT administrator/officer in the institution."Footnote3 The Core Data Service (CDS) institutional profile includes the following selection options:
- 0% centralized
- 1–24% centralized
- 25–49% centralized
- 50–74% centralized
- 75–99% centralized
- 100% centralized
For the study I conducted, any school with a centralization level of 75 percent or greater was considered highly centralized; 66.2 percent of institutions fall into this category (see table 2).
| Centralization Level | Count | % of Total |
|---|---|---|
| No Data |
2 |
0.6% |
| 1–24% |
4 |
1.2% |
| 25–49% |
32 |
9.4% |
| 50–74% |
77 |
22.6% |
| 75–99% |
169 |
49.7% |
| 100% |
56 |
16.5% |
| Total |
340* |
|
Institutional mission adds further nuance to these findings. For example, over 80 percent of baccalaureate and master's institutions are highly centralized. The percentage is similar for doctoral/professional universities (D/PU), which is not surprising given that all three of these institutional types have comparable missions, prioritizing teaching and learning similarly (see tables 3 and 4).
| Centralization Level | Count | % of Total |
|---|---|---|
| No Data |
2 |
1.3% |
| 1–24% |
2 |
1.3% |
| 25–49% |
4 |
2.5% |
| 50–74% |
15 |
9.5% |
| 75–99% |
91 |
57.6% |
| 100% |
44 |
27.8% |
| Total |
158 |
|
| Centralization Level | Count | % of Total |
|---|---|---|
| No Data |
0 |
0% |
| 1–24% |
1 |
2.8%
|
| 25–49% |
0 |
0% |
| 50–74% |
3 |
8.3% |
| 75–99% |
26 |
72.2% |
| 100% |
6 |
16.7% |
| Total |
36 |
|
In contrast, R2 institutions are less centralized than baccalaureate, master's, and D/PU institutions, with only 64.4 percent being highly centralized (see table 5). However, the percentage of baccalaureate and master's institutions that reported centralization levels of 75–99 percent is similar to R2 institutions (see tables 3 and 5), which is notable given that more CIOs at R2 institutions report to the president (see figure 2). Additionally, more R2 institutions reported centralization levels between 50–74 percent than did baccalaureate and master's institutions (see tables 3 and 5).
| Centralization Level | Count | % of Total |
|---|---|---|
| No Data |
0 |
0% |
| 1–24% |
0 |
0% |
| 25–49% |
2 |
3.4% |
| 50–74% |
19 |
32.2% |
| 75–99% |
33 |
55.9% |
| 100% |
5 |
8.5% |
| Total |
59 |
|
R1 institutions report lower levels of IT centralization compared to the other institutional types examined in my research. For example, only 22.9 percent of R1 institutions are highly centralized (see table 6). While these results indicate that R1 institutions tolerate greater decentralized IT, it does not necessarily indicate that the tolerance is ideal.
| Centralization Level | Count | % of Total |
|---|---|---|
| No Data |
0 |
0% |
| 1–24% |
2 |
2.3% |
| 25–49% |
25 |
28.7% |
| 50–74% |
40 |
46% |
| 75–99% |
19 |
21.8% |
| 100% |
1 |
1.1% |
| Total |
87 |
|
I also examined centralization levels in the most elite research universities: member institutions of the Association of American Universities (AAU). Only nine of the thirty-seven AAU institutions in the study report centralization levels of 75 percent or greater (see table 7). Interestingly, decentralized and centralized IT departments at AAU member institutions have some of the largest IT staff sizes reported to EDUCAUSE. And while the decentralized IT staff size at these institutions appears larger than the centralized staff size in some cases, the staff sizes for decentralized IT departments are elusive, which is why I have not reported them here.
| Centralization Level | Count | % of Total |
|---|---|---|
| No Data |
0 |
0% |
| 1–24% |
0 |
0% |
| 25–49% |
14 |
37.84% |
| 50–74% |
14 |
37.84% |
| 75–99% |
9 |
24.32% |
| 100% |
0 |
0% |
| Total |
37 |
|
Institutional control (public versus private nonprofit) is another intriguing lens for examining IT department centralization levels. The results of my study show that private institutions tend to favor more centralized IT departments. For example, 84.8 percent of IT departments at private institutions are highly centralized, and just over 25 percent are fully centralized. Public institutions are markedly less centralized compared to their private counterparts, with about half (49.7 percent) of public institutions reporting centralization levels between 25–74 percent (see table 8).
| Centralization Level | Public | % of Total | Private | % of Total |
|---|---|---|---|---|
| No Data |
0 |
0% |
2 |
1.2% |
| 1–24% |
4 |
2.4% |
0 |
0% |
| 25–49% |
25 |
15% |
7 |
4.0% |
| 50–74% |
58 |
34.7% |
19 |
11.0% |
| 75–99% |
68 |
40.7% |
101 |
58.4% |
| 100% |
12 |
7.2% |
44 |
25.4% |
| Total |
167 |
|
173 |
|
Centralization Changes and Challenges
This close examination of IT department centralization levels suggests that higher education institutions generally favor more centralized IT departments. However, this trend is complicated by the fact that the landscape of centralization and decentralization is evolving, especially with the rise of cloud computing. Before 2010, decentralized IT activities, such as department-specific servers or duplicative Wi-Fi networks, were easier to identify. However, cloud computing muddies the distinction between "functional power user" and "decentralized IT department." In other words, where is the line drawn when considering who performs IT activities?
While a decentralized organization has advantages—such as flexibility and autonomy—significant decentralization can lead to less clarity on total IT costs. Tiffni Deeb, analytics services product manager for EDUCAUSE, highlights a growing trend among institutions to explore centralization of IT as a cost-control measure.Footnote4 For example, the University of Arizona is centralizing IT operations as part of its multiyear financial action plan to balance the budget by January 2026. In addition to costs, higher levels of decentralization tend to require more coordination between the central IT organization and decentralized IT groups, which equates to additional staff time to manage efforts and deliver IT services.
Summary
Researchers began examining the questions of IT centralization and CIO reporting as early as 1980, and the literature swelled through the 1990s enterprise software and hardware revolution. My study results show that more institutional CIOs report to the president today than they did in the past. This shift suggests that more institutions view both the IT department and the CIO as strategic partners. In addition, while a centralized IT organization is the predominant configuration—especially among private institutions—the matter does not appear to be settled, especially in elite research institutions. Each institutional situation is different, with many factors leading to the present state of the IT department, to whom the CIO reports, and the level of IT centralization. This report can help IT leaders consider where they fall in the spectrum when building out strategic plans or discussing the current state of IT centralization at their institution.
Notes
- Curt Herridge, "The Patterns and Structures of Information Technology Departments in Higher Education," (EdD dissertation, Southern Methodist University, 2024). Jump back to footnote 1 in the text.
- Mark McCormack, The Adaptive CIO: Balancing Institutional Structure and Culture, research report, (Boulder, CO: EDUCAUSE, August 2022); D. Christopher Brooks and John O'Brien, The Higher Education CIO, 2019, research report, (Louisville, CO: ECAR, August 2019). Jump back to footnote 2 in the text.
- "Survey Glossary (Analytics Services/CDS 2023)," EDUCAUSE (website), accessed July 9, 2024. Jump back to footnote 3 in the text.
- Author's conversation with Tiffni Deeb about IT centralization, Zoom call, May 23, 2024. Jump back to footnote 4 in the text.
Curt Herridge is Associate CIO, Data and Application Services, at Southern Methodist University.
© 2024 Curt Herridge. The content of this work is licensed under a The content of this work is licensed under a Creative Commons BY-SA 4.0 International License.