
With the release of version 3 of the Learning Space Rating System, colleges and universities have access to a tool with greater depth and nuance to investigate and understand the ways in which formal learning spaces support active learning.

EDUCAUSE recently released version 3 of the Learning Space Rating System (LSRS). It offers important improvements and opportunities over version 2. This primer offers guidance about how to derive, interpret, and use LSRS scores, as well as how to integrate LSRS scores into FLEXspace.
LSRS Version 3 Scoring Overview
The LSRS provides a mechanism for rating formal physical classroom spaces for their potential to support multiple modalities of teaching and learning. It is divided into two parts. Part A captures campus-level metrics, measuring the extent to which (1) the institutional context supports development and promotion of flexible learning spaces; (2) the planning and design process for learning spaces reflects stakeholder engagement, evidence-based approaches, pilots, prototyping, evaluation, and dissemination of findings; and (3) the institution provides adequate operational support and faculty development. Part B centers on the attributes of specific learning spaces (environment, furnishings, layout, and technology) and their potential to support a range of learning activities and promote inclusion. Together, Parts A and B are divided into seven section topics with corresponding credits that offer criteria for earning points, along with helpful approaches and considerations for achieving the overall intent of the credit. See Figure 1 for an example.
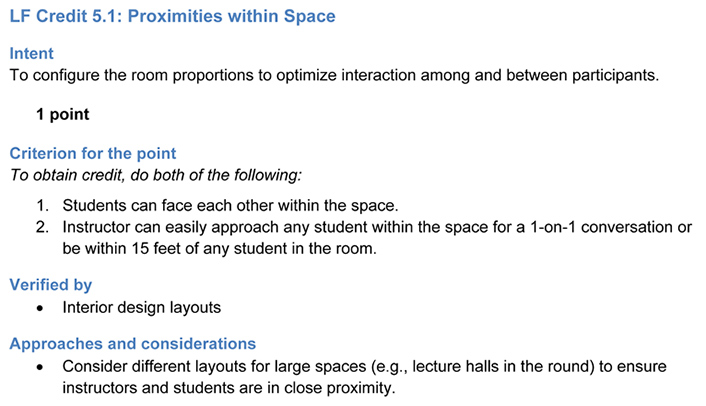
You can derive a variety of scores through the rating of a space: scores for each of the sections, an aggregated score for each Part A and Part B, and an overall score. Each section includes a series of credits that a space can earn. For each credit, the LSRS also suggests evidence that institutions can use to verify the point value assessed. A section score is the sum of the point values associated with each credit within that section. Individual credit values range from one to four points. For example, Section 5 (Layout and Furnishings), from Part B, consists of eleven credits. The example above indicates that Credit 5.1, Proximities within Space, is worth one point.
Below is a breakdown of the overall LSRS version 3 scoring structure.
- Section Scores
- Section 1 (Part A) score: Integration with Campus Context = points earned out of 5
- Section 2 (Part A) score: Planning and Design Process = points earned out of 8
- Section 3 (Part A) score: Support and Operations = points earned out of 12
- Section 4 (Part B) score: Environmental Quality = points earned out of 11
- Section 5 (Part B) score: Layout and Furnishings = points earned out of 17
- Section 6 (Part B) score: Technology and Tools = points earned out of 12
- Section 7 (Part B) score: Inclusion = points earned out of 7
- Part Scores
- Part A score = points earned out of 25
- Part B score = points earned out of 47
- Overall Score = points earned out of a maximum 72
Interpreting LSRS Scores
When interpreting the scores, it's helpful to think about the analogy to student test scores. Imagine a test designed to reveal mastery of content. If two students score an 86% on a test, you know both did a decent job but neither mastered everything. You don't know much else. The overall scores don't specify which aspects of the content each student understood or failed to understand. They don't show whether both mastered the same or different content. Similarly, you should exercise caution in interpreting only overall scores on the LSRS; instead, consider the interplay of all the credit scores.
Consider the examples below of three learning spaces—Alpha, Beta, and Gamma—and their corresponding overall scores. Space Alpha scored 62/72 on the LSRS. That's an 86%, a decent score. Spaces Beta and Gamma both posted overall scores of 48/72. These scores indicate that Spaces Beta and Gamma did not rate as highly as Space Alpha, but they don't provide details of the two spaces relative to one another. When you're scoring multiple learning spaces, as when testing many students, overall scores provide a general sense of relative strength and weakness but little in the way of specifics.
| Learning Space | Overall LSRS Score (out of 72) |
Overall Percentage Score |
|---|---|---|
|
Space Alpha |
62 |
86% |
|
Space Beta |
48 |
67% |
|
Space Gamma |
48 |
67% |
LSRS scores for Parts A and B are similarly general, yet they provide a bit more focused information. For institutions with a single campus location, Part A scores will likely remain constant across learning spaces. Alternatively, institutions that have multiple campus locations or sectors with different planning processes and authority (e.g., a medical or law school versus a main campus) may see varied Part A scores, depending on different campus contexts. Part B scores are unique to each space and, thus, will vary. Although the part-level scores are more granular than the overall score, they still offer only a minimal amount of specificity.
| Learning Space | Overall LSRS Score | Part A Score (out of 25) |
Part A Percentage Score | Part B Score (out of 47) |
Part B Percentage Score |
|---|---|---|---|---|---|
|
Space Alpha |
62 |
22 |
88% |
40 |
85% |
|
Space Beta |
48 |
22 |
88% |
26 |
55% |
|
Space Gamma |
48 |
22 |
88% |
26 |
55% |
Consider, again, Spaces Alpha, Beta, and Gamma. From the Part A (Campus Context, Planning, and Support) scores, one can conclude there is considerable support at the institutional level for flexible formal learning spaces. Since all three spaces exist at the same campus location, they have the same Part A score, 22/25, or 88%.
The spaces with the lowest Part B (Environment, Furnishings, Layout, Technology, and Inclusion) scores are Beta and Gamma, each with scores of 26/47, or 55%. This suggests there is potential for improvement on some aspects of each room's environment, furnishings, layout, technology, and inclusion potential. Yet, it is unclear which distinct aspects of Beta and Gamma contributed to their lower scores. That is, the aggregate Part B score isn't specific enough to indicate particular strengths and weaknesses. It is highly unlikely that Beta and Gamma have exactly the same characteristics that resulted in scores of 26. Returning to the student test analogy, it is unlikely that students with the same scores missed exactly the same test items. It is more likely that a variety of factors combined uniquely in each learning space to result in a coincidental score of 26. For more specific details, the section scores (and the credits that they comprise) are most informative.
Section scores afford the most specific interpretability, which is one reason why the authors of version 3 wanted to offer a more intuitive means to understand them. Hence, the complex weighting of scores in version 2 was eliminated, and in version 3 the point totals directly reflect the relative importance of each credit.
It is, however, important to note the implications of the different section point totals. Consider, for example, scores for two of the sections reported for Space Beta (below). The space earned 5 points each for both Section 1 (Campus Context) and Section 5 (Layout and Furnishings). But the total number of points for each section is different: Section 1's credits sum to 5 points; credits in Section 5 sum to 17 points. Thus, Space Beta earned a perfect score for Section 1, 5 out of 5, or 100%. In contrast, the space earned a 5 out of 17, or 29%, for Section 5. This example shows that when considering how different learning spaces score relative to one another on particular aspects of the LSRS, you should look at the percentages because these normalized scores allow for more meaningful comparisons.
| Learning Space | Overall LSRS Score | Part A Score | Part B Score | Section 1, Part A (out of 5 pts) |
Section 5, Part B (out of 17pts) |
|---|---|---|---|---|---|
|
Space Beta |
48 (67%) |
22 (88%) |
26 (55%) |
5 (100%) |
5 (29%) |
While the Section 5 score in the above example is disappointing, there is great value in knowing it. It is surely a contributor to the low Part B score that Space Beta earned. As the local learning space team considers how to improve Space Beta, Section 5 and the credits that it comprises should be a target for consideration. The power of the LSRS is in the details.
Comparing Scores between Version 2 and Version 3
If you are accustomed to using LSRS version 2, you may wonder what the new scoring system means for your old records. The LSRS team offers the following recommendations:
- Don't attempt to line up scores from both versions side by side; they won't align.
- As long as you recognize that the two versions are different, some rooms can be based on version 2 scoring while others can be scored using version 3.
- Rescore when you are able, especially to capture a rating on the new Section 7, Inclusion.
Strategies for Using the Scores
Scores from the LSRS can be used in various ways to understand the multiple, interrelated dimensions of learning space design and to illustrate to administrators, faculty, and others at your institution the role that an intentional, thoughtfully planned learning space can play in teaching and learning.
Keep an Inventory
LSRS scores help quantify important characteristics of learning spaces. Capturing room scores, especially section by section, allows you to compare the relative strengths and weaknesses of learning spaces across the institution. For institutions that document the details of large numbers of learning spaces, including LSRS scores in the documentation can be especially helpful in identifying needs and tracking progress.
Make a Case for Space
You can leverage LSRS scores in support of requests for new or renovated spaces. Be sure to use scores at the level—overall, part, section, or credit—that best tells the story you want to tell. Low scores can point to opportunities for improvement. High scores can demonstrate alignment with evidence-based best practice and suggest an opportunity to capitalize on momentum.
Additionally, LSRS scores can document how closely (or not) the spaces are aligned to campus academic goals and strategies. Hence, scores can be used to identify gaps between the two, enabling you to make a stronger case for resources.
Tell a Story
LSRS scores provide objective metrics of various aspects of spaces. You can use these quantitative metrics to tell qualitative stories. For example, do you want to describe the ways your institution supports diversity, equity, and inclusion on your campus? Look across all the spaces for which you have version 3, section 7 scores. How do they rate? Is there a story on DEI that can be told through the lens of learning spaces?
Enter and Share Scores in FLEXspace
In addition to enhancements to the LSRS itself, the LSRS team collaborated with FLEXspace to improve LSRS version 3 integration within the FLEXspace interface. FLEXspace is a convenient, open-source community and repository of learning space examples and tools to help you plan, design, and assess learning spaces.
Entering LSRS scores into FLEXspace can add value both to your institution's learning space process and to its outcomes. The improved interface (see figure 2) allows you to enter all the section, part, and overall scores noted above while leveraging other benefits FLEXspace provides. This includes a mobile-friendly "Create a Space" template that makes it easy for LSRS users, whether an individual or a team, to add and access the scores and view related documentation and information about a learning space, all in one place. For example, the LSRS asks for documented evidence to verify scores for each credit. When you upload a space to FLEXspace, you can record the associated LSRS V3 scores alongside evidence such as images, design specifications, data, and other qualitative details about the space.
The new LSRS and FLEXspace integration also allows room records to be filtered by whether the record has a published LSRS score available. This allows users to search FLEXspace and explore only the rooms that include LSRS scores.
![Title: Learning Space Rating System v3. Enter values from your LSRSv3 scoresheet. Click here to find out more about the LSRS system from EDUCAUSE. Don't forget you can also upload your completed scoresheet to the Resources section below. Fields: [Part A] + [Part B] = [Total], [Integration with Campus Context (ICC)], [Environmental Quality (EQ)], [Planning and Design Process (PDP)], [Layout and Furnishings (LF)], [Support and Operations (SO)], [Technology and Tools (TT)], [Inclusion (IN)].](https://er.educause.edu/-/media/images/articles/2021/2/er211402figure2.jpg?hash=49767E8A80A2D7D61194D84CFDF2233E2B9E9EC9)
FLEXspace is also a community where membership means both contributing to and benefiting from the ideas, successes, and challenges of others. For example, published scores, particularly section-level scores, can point users to examples of spaces with high scores in specific areas. In the example above, Space Beta scored low on Section 5, Layout and Furnishings. Filtering within FLEXspace for spaces that have published scores and then looking specifically at spaces with higher Section 5 scores could be instructive as those at Space Beta's institution investigate ideas and strategies for improvement.
It is important to remember, however, that the institutional context of Space Beta and the contexts of other spaces you might compare it to are inherently different. Different people at different institutions may rate similar spaces differently; some may interpret the criteria conservatively, others liberally. Also, documentation evidence may, or may not, truly justify the scores users assign to credits. Nonetheless, exploring LSRS scores of spaces at other institutions may inspire your thinking. You may, in fact, decide to reach out to other institutions to connect and explore further.
Conclusion
LSRS version 3 continues to be grounded in evidence and best practice because it is built on research that has been done since version 2 was released. Higher education has been hard at work reimagining the ways we think about classroom spaces. Within any institution, some rooms will earn high scores; others will post low scores. It's hard to imagine many, if any, rooms getting a perfect score. As noted in the new LSRS introduction, version 3 is aspirational. This version challenges higher education to be forward thinking, a leader in the ways multiple modalities of interaction can be accommodated in a single space. For many, current infrastructure—architecture, networking systems—was simply not built for some of what the LSRS recommends. But in future incarnations, it could be. Still, low scores should be valued for what they are: diagnostic, instructive, empowering. They point institutions in the directions where attention and investment are warranted. High-scoring rooms serve as testimony to the good work being accomplished around the research-based trends we want to see.
Acknowledgment
Thank you to LSRS version 3 core team members and other learning space colleagues for their insights and review.
Crystal Ramsay is Assistant Director, Teaching and Learning with Technology–Innovation, and Affiliate Assistant Professor, Educational Psychology, at the Pennsylvania State University.
© 2021 Crystal Ramsay. The text of this work is licensed under a Creative Commons BY-ND-NC 4.0 International License.