
IT leaders face numerous challenges in helping their organizations make increasingly information-based decisions. In these four case studies, teams from four institutions show how valuable it can be when institutions make progress along the analytics and business intelligence (BI) maturity roadmap.

This article is the fifth and final installment in a 2018 series that presents case studies related to the theme of next generation enterprise IT:
- Building a Technology Strategy to Enable Next Generation IT
- Connecting Enterprise IT Models to Institutional Missions and Goals
- Becoming Institutional Brokers and Partners: The New Role for IT
- Maintaining Business Process Redesign Efforts through Change Management
- Using Analytics to Answer Important Institutional Questions
Traditional enterprise IT is typically viewed as centralized, monolithic, and vendor-driven. In contrast, next generation enterprise IT is characterized by movement toward a multifaceted, interconnected ecosystem focused on advancing the institution's mission and effectiveness. Next generation enterprise IT is mission-driven and client-centric. It is enabled by both a variety of technology trends and the management of those trends, which include cloud computing, business process reengineering, social networks, mobile technologies, analytics, artificial intelligence, enterprise architecture, and service management methodologies. Further, it is driven by the migration of authority and responsibility closer to the edges of organizations and by expectations such as hyperpersonalization of services; a closer link between IT and the institutional mission and goals; and greater system agility, flexibility, and scalability. These trends and drivers are pushing us to rethink enterprise IT.
To take advantage of emerging trends and meet expectations, IT faces several challenges; the EDUCAUSE Enterprise IT Program has considered those challenges throughout 2018. In this fifth and final set of case studies, IT leaders from University of Mississippi (UM), Ithaca College (IC), Oregon State University (OSU), and The George Washington University (GW) discuss how they helped their institutions answer important business questions using analytics and business intelligence (BI).
University of Mississippi
Christopher Reichley, Director of Application Development and Integration
Jennifer Phillips, Assistant Director for Retention
Kathryn Gates, CIO Emerita
As Mississippi's flagship university and a Research 1 public institution, the University of Mississippi (UM) transforms lives, communities, and the world by providing opportunities for people in Mississippi and beyond. UM has a total enrollment of more than 23,000 across all of its campuses. On the main Oxford campus and the regional campuses, 23.6 percent of students are minorities, and 12.8 percent of these students are African American. Further, approximately 45 percent of UM students are from out of state. UM was listed twelfth on the Chronicle of Higher Education's list of fastest growing public doctoral institutions for 2006–2016, with a 55.1 percent overall increase over that time period.
Overview
UM's rapid growth, diverse student body, and limited resources as a public university in a poor state call for the smart and strategic use of data. Almost twenty years ago, UM recognized the enabling power of data analytics and began establishing the necessary technology (the hardware and software infrastructure) and expertise to create an analytics capability. The original strategy was centered on a BI platform. In recent years, focus has shifted to in-memory database processing that allows for a simpler technical landscape with queries on live data. Specifically, in 2015, the Office of Information Technology (IT) replaced the relational database that supported UM's ERP system with SAP's HANA in-memory database. The advantage of an in-memory database is speed, which allows for real-time queries on ERP data.
UM benefits from longstanding partnerships with vendors such as SAP, and, at the same time, it embraces a DIY culture, which is key to its agility. Examples of that DIY culture include (1) automated attendance scanners in classrooms that report absences to UM's SAP system in near real time and (2) alerts that allow instructors to securely share concerns about students with advisors. Both projects were developed by IT staff in response to dialogue with the academic community. Software development took place within the SAP framework and on Linux, complementing the functionality provided by out-of-the-box SAP applications. UM also prioritizes automation, which is necessary for efficient operations and good stewardship of limited resources.
UM has ramped up expertise by establishing data analyst positions and by supporting staff through data science training and certifications. Many UM departments, including IT and the Office of Institutional Research, Effectiveness, and Planning, use R for statistical analysis, including predictive modeling. For its institutional reporting tool, UM has standardized on Tableau.
Universities have used analytics in numerous applications, from recruitment to resource optimization to development. By establishing an analytics capability rather than a solution to a specific problem, an institution can take that initial investment in almost any direction; in this case, the focus is on analytics and student success.
Analytics and Student Success
UM's student system includes support for more than twenty different institution-defined "advisor types," including academic, athletics, orientation, honors, online, and residential college. This network of advisors uses the campus portal, myOleMiss, to view academic details for students and communicate with each other and advisees.
Five years ago, IT worked with the provost's office to introduce a new student status called academic risk. The goal was to identify, as early as possible, undergraduate students who were at risk for not completing a fall or spring term with good academic standing, in order to connect them with relevant academic resources. The academic risk status was set using a relatively primitive formula, which was a function of absences, instructor alerts, and midterm grades. While this was a good first step, the formula and overall process had weaknesses—chiefly, that most statuses were not applied until midterm grades were available, which was considered too late by many UM advisors.
2018 Redesign
In 2018, we redesigned the process to use predictive analytics to improve timeliness and accuracy of academic risk statuses. The project's most important partner was the Center for Student Success and First Year Experience (CSSFYE), which provided guidance on key topics such as the most informative predictor variables and the most useful features for advisors.
We partitioned students into two groups—new and continuing—and defined three phases. This resulted in a total of six model variations (see table 1).
Table 1. Phases in the academic risk data model
|
Phase |
Start |
End |
|---|---|---|
|
1 |
Two weeks prior to the start of a term |
Day before the first day of classes |
|
2 |
First day of classes |
Midterm grading deadline |
|
3 |
Day after midterm grading deadline |
Five days later |
Our exploratory analysis of variables helped narrow the more than thirty potential predictor variables to ten: high school core subjects GPA for new students, most recent resident GPA for continuing students, schedule difficulty, whether a student was flagged as developmental based on standardized test scores, whether a student was a re-admit, the number of days first booking took place before start of term, the number of absences, the number of D and F midterm grades, the number of instructor alerts, and the percentage of unread class news messages.
We chose a logistic regression model for its ability to predict the probability of a binary dependent variable—in this case GOOD academic standing vs. NOT GOOD academic standing—based on a set of independent predictor variables. A logistic regression model is a supervised model that makes predictions by learning from historical data. Generating a probability of a student being in GOOD academic standing is useful in identifying students who are near the edges, such as in red, yellow, or green light scenarios.
Our first step was to develop a prototype data model. The prototype achieved accuracy rates of 86–92 percent using a confusion matrix to assess results. The rates varied depending on student type (new or continuing) and phase. The prototype demonstrated that our approach was viable. At this point, IT set up an R environment running on Linux behind UM's firewall and a strategy for exchanging data between R and SAP using JSON and Restful Web services. We then further refined the model to improve accuracy rates to 92–98 percent. We developed reports on aggregate results using Tableau and an academic risk dashboard for advisors using the DataTables jQuery plugin.
An important project requirement was that the process for determining and setting the academic risk status be 100 percent automated. In UM's environment, it is impractical to have humans manually download data to feed into R and then manually apply statuses as data changes on a minute-by-minute basis; in essence, the process must run itself. Figure 1 shows the relevant people, systems, and devices that participate in the new automated academic risk process.
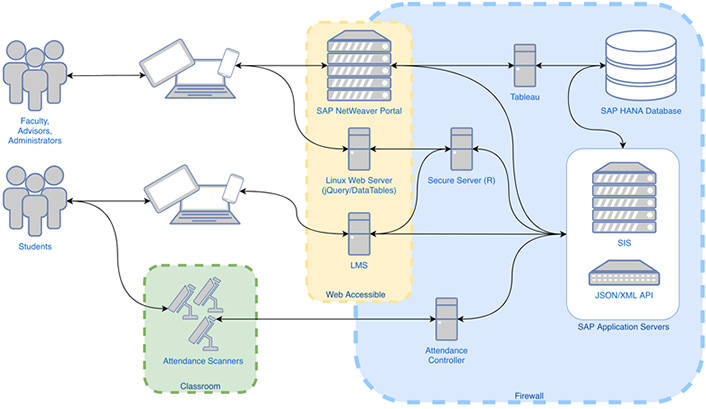
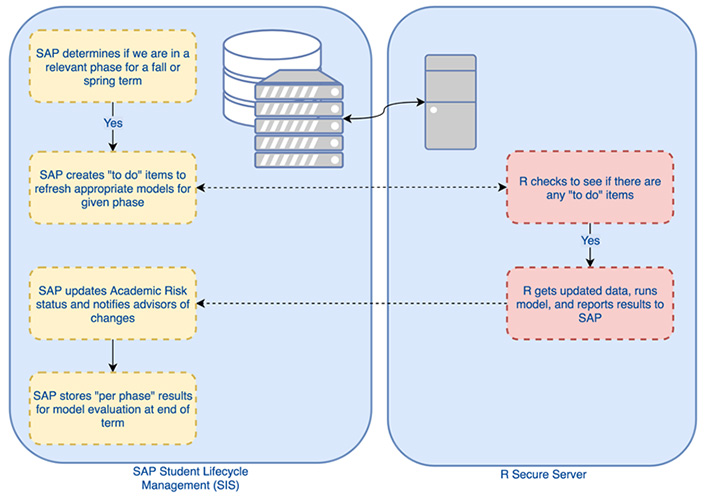
Figure 2 shows how SAP and R interact to manage the status.
Results
Advisors' feedback on our launch of the redesigned process has been positive. The model is configured to begin running two weeks prior to the start of each fall and spring term so that data are available prior to the first day of classes. The model's accuracy, together with the timeliness of results, meets the goal of identifying undergraduates who are at academic risk as early as possible to connect them with relevant resources. Because legitimate concerns exist about using data to profile students, only advisors and academic administrators can access the model's results. Likewise, we take considerable care to communicate how we derive results and how those results should be used.
Future Work
Although the redesigned process has been in production for only one term, advisors are already suggesting enhancements. For example, they have asked that we develop a method for collecting data on actions taken once a student is assigned the academic risk status. This is important to the UM advisor network and as a way of evaluating the overall academic risk process. Because the presence of the status prompts interventions, we need to measure and incorporate intervention types and their effectiveness into the overall process.
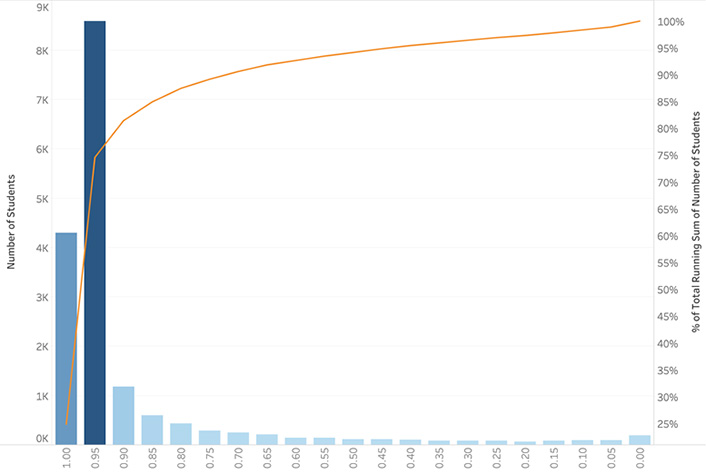
Further, because the logistic regression model produces a probability rather than a binary result, some advisors who are aware of the model have asked for access to each student's predicted score. We are currently discussing whether to reveal details of the score or to instead use a summary red or yellow indicator. Figure 3 shows the distribution of predicted scores and the running total as a percentage. A value of 1 corresponds to a strong likelihood of ending the term with GOOD academic standing, and a value of 0 corresponds to a strong likelihood of not ending the term with GOOD academic standing. In the current configuration, students who have a score of .5 or less are marked as being at risk (red light), which is approximately 6 percent of the undergraduate population. Given the data's shape, a probable next step is to add a new status: a yellow light for students at risk. For example, if we added the at-risk status for students with a score of .5 to .8, it would flag an additional 7 percent of undergraduates.
Other possible efforts include improving the accuracy of the data sets that feed into the model, as well as adding new data sets. An example of the former is to ensure that automated attendance results are clean and not, for example, the result of an instructor's inadvertent misuse. An example of possible new data sets is data from UM's learning management system. Regarding user interfaces, we could extend popular features from the new academic risk dashboard for advisors to include students who are not at risk. We plan to explore these and other potential enhancements through brainstorming sessions with IT, CSSFYE, and advisors. Finally, data-mining projects require frequent monitoring with appropriate adjustments going forward. To this end, IT will continually check the results and make iterative model updates to ensure ongoing accuracy.
Summary
The details of this case study demonstrate several critical success factors when developing and implementing a data analytics strategy. First, this case study shows the advantage of establishing a data analytics capability that can be generalized rather than applied to solve a specific problem. This case study focuses on student retention, yet the methods we use can be applied to almost any domain in a higher education institution. We addressed an important problem using a combination of vendor-supplied and custom-developed software running on various proprietary and open-source platforms. The details of our underlying technical choices are less important than having a mind-set of learning and evolving as new tools become available.
Second, domain experts are critical. Data-mining projects must be carried out in partnership with people in the institution who deeply understand the data. In this case study, CSSFYE suggested potential predictor variables that came from years of working in the student-retention trenches. Likewise, CSSFYE served as the bridge between IT and the advising community in identifying features and setting priorities.
Finally, collaboration is powerful and can result in more than the sum of its parts. Campus units with expertise in data modeling, for example, may focus solely on the model itself rather than how to move it into production as part of an automated end-to-end process. In this case study, IT offered expertise in systems architecture and automation. The best solutions come from working together and respecting the expertise that each participant offers. Moreover, a history of trustful collaboration between IT and campus partners sets the stage for future successes, advances the university's mission, and is rewarding to everyone involved.
Ithaca College
Vanessa Brown, Associate Director, Business Intelligence Architecture
Rob Snyder, Information Systems and Analytics Manager
Ithaca College (IC) is a four-year residential private college in Ithaca, New York, with 6,000 undergraduates, 500 graduate students, and 700 faculty members. IC began as a conservatory of music in 1892 and now has four professional schools (Music, Business, Health Sciences, and Communications) and a liberal arts school. US News and World Report ranks IC ninth among the Best Regional Universities North.
IC is primarily tuition-driven and is challenged with declining high school graduate demographics and intense competition for Northeastern-based prospective students; 85 percent of the student body is from the Northeast. Other challenges include diversification of the student body and the need to improve its student success rate. IC is increasingly aware of its need for analytics to help address these issues.
Overview
As part of the IT department, BI at IC has historically focused on operational reporting to compensate for the limited reporting capabilities in its HR/finance and student systems. The BI-developed operational data store (ODS) is in silos according to administrative areas and is overwritten nightly without preserving changes. IC used a single vendor for the entire technical stack, resulting in complicated and expensive bundled contracts. Additional components for authentication, single sign-on, and a portal product (separate from other IT products) have added to the environmental complexity and the ability to remain current on upgrades; indeed, since 2011, the environment has been in a constant upgrade cycle. In addition, the BI team has had little time to develop the integrated longitudinal data structures needed to answer critical institutional questions.
Despite multiple attempts, IC has been unable to gain traction on developing an enterprise data warehouse. This is in part because IC lacks a strong data management culture, and also because a series of large IT projects have been competing for funding.
In 2016, BI began strengthening its relationship with IC's newly formed Analytics and Institutional Research (AIR) office. Further, AIR began working with an external company to meet specific data science needs around student success. This venture was cloud-based and helped push BI to explore the possibilities of cloud services and a move away from a single-vendor environment.
Ultimately, IC needs a solution that requires BI to spend less time maintaining complex infrastructure and offers more time for developing useful data structures. This will allow AIR to spend less time on manual data collection, cleansing, and manipulation and more time actually exploring and analyzing the new data structures that BI created.
Approach
IC's need for a solid BI and analytics roadmap is not in question, nor is the observation that the majority of BI efforts have failed to provide successful outcomes. Like many colleges and universities, IC is big enough to have big-data problems but not large enough to be able to invest the often-inordinate resources needed for traditional—and risky—data warehousing and BI projects.
Still, an effort was needed, and its fundamental goals will sound familiar:
- collect and organize both structured and unstructured data from systems across the institution;
- track changes over time; and
- allow easy access to data for investigative data science purposes, while simultaneously creating higher-form models for strategic analysis and reporting.
The plans to realize these goals—which were inspired by common enterprise data lake, data warehouse, and data mart topographies—have been somewhat simplified to allow for quicker progress and increased flexibility. Learning from its previous failures, IC is adopting a new approach: rather than rely on monolithic vendor solutions, the focus will return to supporting the tool, not the data. If the work requires costly vendor or consultant engagements, it will again fail to secure the funding needed to see it through to completion.
IC has established three differentiating principles to support the new approach:
- Focus on growing the internal team's skills and capabilities rather than investing in consultants and vendor solutions.
- To the extent possible, remain agnostic with respect to vendor, tool, platform, and technology. Favor open source and open standards over proprietary code and methodologies.
- Deliver small increments of value quickly. Do not fear failure; fail fast, reflect, recover, and move on. Plan for the big picture and iterate on the details. Experiment.
In the past, this approach to building a BI environment clearly would have been impractical. The infrastructure costs alone would have prohibited exploration and experimentation—imagine, for example, asking IT to create an entire server environment just to try out an idea. Enterprise-level ETL tools, databases, and reporting environments were heavy things, demanding significant resources to implement, understand, and keep alive. Successful IT team members were encouraged to build their skills around specific platforms, not general tools and concepts.
The basis of the new approach, and the formation of its three principles, started with the realization that there was no off-the-shelf solution for a college like IC—one that is still in the early stages of its data analytics journey yet which also has a large and varied data landscape. So, while IC's internally focused, experimental approach may seem like a return to an earlier time, it is in fact made possible by the current landscape of data science and IT tools.
This is also not simply a build-versus-buy discussion; some vendor products and off-the-shelf solutions will smartly fit into the project. The key point is that the path to success demands that IC's IT, BI, and AIR teams must drive the project from a technical perspective.
Growing Capabilities and Open Tools
Looked at simply, the BI and analytical warehousing work has two fundamental, intertwined streams of effort: designing powerful representative data structures and doing the technical work of building an infrastructure to bring forth those structures and manage data collection and transformation. The technical work should exist only to enable the work with the data.
The leading data science and exploration tools—such as R and Python—are languages, not application platforms, and they've been overlooked in the past precisely because they do not offer a turnkey BI solution. With the realization that no turnkey solution exists, these and other tools become more of an imperative.
Building capability in open toolsets also drives the adoption of open standards. Whereas a vendor-provided platform often leads to development of a proprietary implementation, tools such as R and Python can work with almost any data source. Thus, avoiding vendor lock-in is not just a financial move—it's a fundamental way to ensure that IC's data remain open and accessible to the largest possible toolset, now and in the future.
Building with Agility
The agile methodology was born of the need to solve fundamental problems in software development. The agile approach advocates daily collaboration between users and builders and the frequent delivery of functionality, and it emphasizes the importance of embracing change and simplicity. While the effectiveness of various agile implementations has been—and will continue to be—debated, the foundational principles have a fundamental validity.
IC's experimental BI approach leverages key agile learnings:
- Use cloud infrastructure to create disposable environments. To encourage creativity and learning, empower the BI and AIR teams to directly create their own servers, databases, machine-learning resources, and other cloud environments, without needing IT support or approval.
- Clarify and agree on overall BI goals, but don't plot the entire course upfront. Instead, IC looks for a real question that must be answered, quickly prototypes an approach using open tools and cloud technologies, delivers functionality, and then assesses the results. Throwing the first solution away (or even a second or third solution) should be encouraged, not fretted over.
Plan Synchronicity
It boils down to this: IC and most institutions like it have strongly believed that the best path forward is to take direct internal hands-on responsibility for building the BI and analytics environment by building capability within the teams. As a result, institutions have been hesitant to take on these projects due to the risk of failure, perceived cost, and lack of skills investment.
In reality, however, IC has been supporting costly vendor tools for decades—a significant outlay that has not achieved the desired result. Now the tool landscape has evolved: the most widely used data science and analytics tools, which are free and open source, have immense power, while the cloud negates many traditional infrastructure issues. By taking an experimental agile approach, IC believes it can both reduce cost and the risk of failure while simultaneously increasing engagement across IT, BI, and AIR teams, fostering an even greater sense of data ownership and data-informed decision-making.
Lessons Learned
Although we are at the beginning of this journey, we have learned several lessons already.
- A strategic partnership between AIR and BI/IT is critical. These teams have different but complementary skill sets, and all share the goal of advancing data as an asset at IC.
- View alternative solutions beyond current vendor products and traditional BI. Monolithic on-premise BI solutions may be obsolete, at least for institutions that are not far along on the BI maturity continuum and are dealing with financial demands and stressed IT resources.
- Develop other skill sets. Our BI and AIR staff must develop other skill sets as cloud service options expand and the BI/analytics landscape shifts.
- Start small and fail fast. We have learned to start small and proceed incrementally to answer the unknown questions that add risk.
- There is energy and excitement in looking at the future differently. We have found that adopting an experimental mind-set offers many opportunities to learn new things and try different technologies.
Oregon State University
Lois Brooks, Vice Provost for Information Technology and Chief Information Officer, University of Wisconsin-Madison (formerly Vice Provost for Information and Technology at Oregon State University)
Kent Kuo, Director, Enterprise Computing Services
Oregon State University (OSU) is a PhD-level, public land-grant Research 1 university founded in 1868 and located in Corvallis, Oregon. OSU is one of two land-, sea-, space-, and sun-grant universities in the United States. It draws students from all 50 states and more than 100 countries to its two campuses, 11 colleges, 15 experiment stations, 35 extension offices, and 200-plus academic programs. Among the OSU academic programs that are often ranked among the world's top programs are forestry, oceanography, mycology, marine biology, agriculture, robotics, and natural resources; its Ecampus online program is among the top eight in the country.
Overview
Asked how to make Chinese potstickers, an amazing home cook once offered the following lesson: He pulled together the key ingredients, and then whipped together the meat filling in a bowl. When asked how much of which ingredient to put in, he just shrugged and guessed. He then offered up the aromatic bowl, noting that, "You put in the ingredients until it smells like this."
For some rare and talented people, that is sufficient guidance to replicate results. For others, a defined and well-documented process is absolutely needed. For example, the student of that home cook (who might be one of the coauthors of this case study…) tried—hundreds of times—to replicate that potsticker recipe, and the only thing he got right were the ingredients.
In higher education, business processes can, over time, grow to be historically driven and complex. As you stretch those processes over years and decades, it becomes even more challenging to understand or remember why we do things a certain way. An oft-heard refrain—because it has always been done that way—is all but a secret passphrase for maintaining historic processes. When these business processes are built into our enterprise systems, we may end up with numerous local modifications that are expensive to maintain and that impede innovation. The increasing demand for business efficiency to support institutional decision-making, as well as research and teaching activities, is causing us to rethink our assumptions about why we do things the way we do. As these new software-as-a-service (SaaS) solutions shift computing from on-premise to cloud computing, we are forced to reevaluate the business processes that have been in place for dozens of technology generations.
When we faced the challenge of a major ERP system upgrade, the need to upgrade hundreds of historic modifications added months of time, thousands of hours of extra work, and additional complexity to the project. Rather than blindly reinstalling modifications (as we had done so many times in the past), we decided to use this opportunity to rethink and modernize our business processes. Using the BI techniques, we first focused on the cost and benefit of the modifications and used these insights to justify a focused effort to move toward baseline functionality. This Banner v9 Project gave us new insights into what we do, how we do it, and why we might—or might not—need to keep doing it that way in the future. These insights have proven crucial to our ability to demonstrate the value of our ERP systems for campus decision-making.
Lessons Learned
Over eighteen months, we re-evaluated hundreds of modifications made to both vendor products and the custom forms we created for users to interact with our ERP systems across the entire administrative function (student, HR/payroll, finance, and financial aid). This reassessment of what, why, and how we go about doing things required a partnership of administrative and technical professionals to break down the processes and design solutions. As the following lessons show, we have learned a great deal in the process.
Check your facts. Don't assume that the modifications or new capabilities you implemented are in use. In running through various metrics—such as how often anyone has used a form or how many users have security access to it—we found that several forms we had either modified or custom built were being used by few (if any) people. As a result, it was easy to argue that those objects could be deprecated or reset to the baseline code. Additionally, it is important to understand the true cost and potential value of maintaining changes. In OSU's case, the cost/benefit analysis of going back to baseline underpinned our decision to do this work.
Challenge your assumptions. We assumed that the business units understood both why a particular modification or custom form was being used and which essential business process it enabled. What we found was that most often the changes were holdovers from previous decades and that no one remembered why a process had to be followed in that specific manner. In fact, using today's technical capabilities offers far more efficient ways to achieve the same objective without modifying the vendor product.
Reassess your available options. Beyond just rethinking business processes and policy changes, review the technology itself. In our case, we found that we had become lax on the IT side. For example, the vendor had introduced the capability to mask data years earlier, yet we had not linked the introduction of that change to our ability to reduce the number of modifications and custom forms by five percent. Granted, five percent may not seem like much, but over time, these inefficiencies add up. We thus recommend that you take time to consider the product's new functionality to see if you can use it to improve capabilities and efficiency.
Understand the opportunity cost. We are all busy, and it requires effort to pull together the time and resources required to do an end-to-end reevaluation not only of a process but also of the policy that often underpins that process. Our endeavor to return to baseline reduced the modifications and custom objects we had built over the past twenty-eight years by fifty percent. Thus, each upgrade cycle in the future will take at least fifty percent less time than it did before. This endeavor required additional time, and we put other work on hold, which caused frustration and delayed other efforts. That is, the long-term benefit came at a short-term cost, and that immediate cost was felt most strongly by our colleagues in the business offices. They will most keenly feel the long-term benefits as well.
Generate momentum. It is essential to get everyone involved so that they understand both the effort required to make these changes and the tangible benefits. In our case, the numbers were compelling: the newly retired modifications and custom objects had been a drag on our ability to innovate. Each year, we had been spending two months of six full-time programmers' time to reapply modifications to the newest version of the vendor's product. Making the change required buy-in from our business partners, and in return we have committed to spend the newly available staff time on their innovation initiatives. The programming team worked side by side with business partners, reviewing each business process. Each improvement was valued and the effort celebrated.
Potstickers Revisited
Unless you work only with geniuses, you need a great recipe—that is, a combination of the right ingredients and a thoroughly documented process. OSU's effort to complete its most beneficial ERP system project in decades is a testament to both the process followed and the collaboration of a top-notch team of technical and business staff. Also, while Kent continues his efforts to perfect his dad's potstickers, he more easily learned to master a delightful dessert when Lois shared a winning (and detailed) recipe for salted Texas chocolate cake. Yummmmm…
The George Washington University
Jelena Roljevic, Associate Vice President, Business Intelligence and Enterprise Information Services
Centered at the national and international crossroads of Washington, DC, The George Washington University (GW) is an independent academic institution dedicated to furthering human well-being. With nearly 30,000 students representing more than 135 countries and a research faculty conducting high-impact, innovative projects, GW generates a tremendous amount of financial, academic, demographic, and operational data. Effectively leveraging this data is critical to the university's aspiration to preeminence as a comprehensive, global research university.
Overview
The GW Business Intelligence initiative [https://it.gwu.edu/business-intelligence] began in the Fall of 2012 and was up and running that same year. GW BI has grown since then and developed a variety of dashboards that are being used across the university. The initiative provides data-as-a-service, saving GW time and money and adding further value by providing accurate and trusted data to help users make important and timely business decisions.
GW BI's interactive dashboards are built for each business unit, allowing deans, researchers, administrative units, and others to see key information when they need it and, as a result, changing how they work. Further, the dashboards change how data are viewed and used within the university, helping GW create value from its data, drive results, and harness the power of information.
GW BI dashboard and decision center information is continuously updated based on user needs and can be accessed from desktop or mobile devices. To ensure BI resources go to the most important value-added project, functional business leaders govern BI projects, guided by the university's strategic and operational goals.
Figure 4 shows business areas that BI has served to date and maps them to the university strategic initiatives introduced this year by new President Thomas LeBlanc and executive leadership.
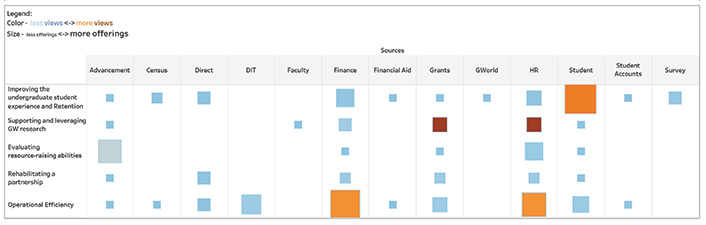
(View larger image)
The BI dashboards and decision centers provide data in a meaningful way for users. Using data points that originally existed on spreadsheets (if at all), the dashboards present information in a new, easy-to-read tool with interactive functions. Using this information, users can form actionable insights that help them make decisions and move the university forward.
To extend is resources, the central Business Intelligence Services (BIS) team promotes data as a self-service option to business functions. By concentrating on data integration, data quality, and facilitation of data governance, BIS is able to produce visualizations and analytic solutions using common, consistently defined data for a wide variety of users. Also, BIS uses the Agile Scrum methodology, which lets team members gather requirements that can be continuously refined. Releases for each dashboard and decision center are planned on a quarterly basis to minimize each project's overhead.
Stewardship and Governance
In addition to the BIS and data governance teams, university leadership, stakeholders, and support staff continue to be involved in the BI initiative. Support staff members act as data stewards for the university, defining the business terms and appropriate data use in GW's dashboards and business practices. In addition, the BIS team created a Business Intelligence Advisory Council (BIAC) [http://it.gwu.edu/business-intelligence], which includes people responsible for supporting executive leadership throughout the institution. All of these groups help the BI team prioritize new projects and changes to existing dashboards.
Maturity
The first BI dashboard was created in fall 2012. Since then, the BIS team has been working closely with various university departments to help develop additional tools to assist with decision-making based on data points. Over the past six years, BIS and its GW partners have created more than twenty-five dashboards, including the Executive Level Award Dashboard for high-level grant management, the Financial Director's Dashboard for university finances management, the Enrollment Management Dashboard for incoming students, and the Advancement Decision Center to help with the university's fundraising goals. BI has also expanded its involvement to many different areas throughout the university, working on solutions that best fit each department.
The most telling metrics are those of adoption and usage. An increasing number of faculty and staff members use the dashboards, and they are thus better able to make accurate, timely decisions based on reliable data. With usage metrics trending upwards, BIS has found that the dashboards are effective and helpful in the university's day-to-day administration. The metrics also assist with the team's Agile approach: if the data show a particular part of the dashboard being underutilized, the BIS team can meet with users to determine how to tweak the reporting design to better fit their needs. In addition, the metrics show which school or department is using each dashboard the most, again allowing BIS to target those with low usage to best determine how to adjust the dashboard to each department's needs. As usage continues to grow, BIS is meeting its goal of optimizing university administration by saving increasing amounts of both time and money.
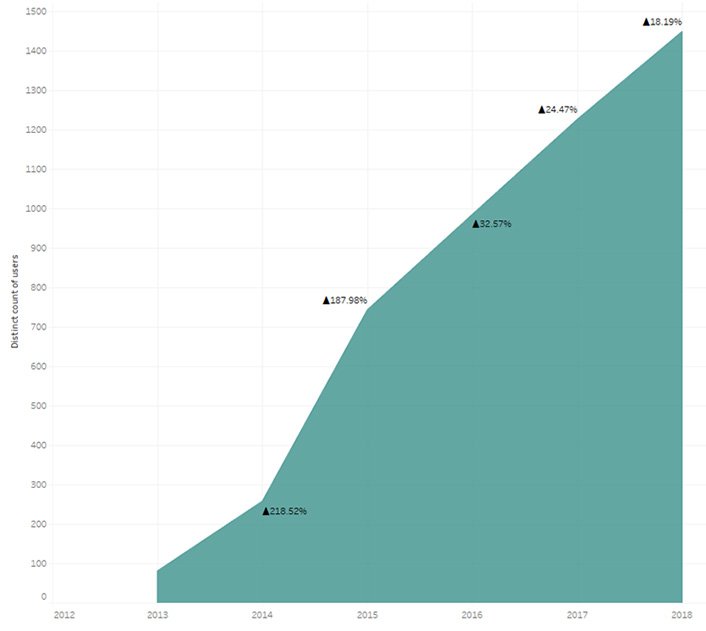
As figure 5 shows, more than 1,400 GW community members currently access and use various BI solutions, saving an average of four to eight hours a week. The increased staff use of BI dashboards, reports, and other solutions is improving productivity and reducing the risk of manual errors. BI-generated information reduces the amount of time required to produce reports by 50 percent and also provides powerful assistance for executive decision-making. BI solutions assist many GW departments in various ways, including enrollment decision-making, research management, insights into missing grades, diversity inclusion, HR reporting, budget planning, and finance operations.
With increases in BI users each year, GW BI adoption rate is now in the top 10 percent of higher education institutions, with more than 81 percent penetration (see "The State Of Business Intelligence, 2018").
Relevance
BI dashboards and decision centers give GW a competitive advantage in several different areas that help faculty and staff make accurate, data-driven decisions to help the university meet its goals. In addition to providing trusted data, the dashboards help staff and faculty save time and money when analyzing important data points, delivering business value that is irreplaceable today. As higher education institutions continue to try and do more with less, BI dashboards and decision centers optimize the business process of collecting, compiling, comparing, and analyzing data.
As an example, the Principal Investigator's Dashboard gives researchers interactive insight into their grants. So, instead of spending time comparing spreadsheets and evaluating numbers, the dashboard shows them exactly how much of the grant has been spent on various areas and how much remains to perform additional research, hire another assistant, or extend the field time. This level of detail enables growth resulting from time and money savings that would otherwise be spent manually analyzing these aspects of the grant. Further, the dashboards and decision centers improve customer relationships, not only between the BIS team and system users but also between university departments and the customers they serve.
The BIS team is in constant contact with stakeholders and the users of the dashboards and decision center, and the team receives constant input on how best to improve the tools. Using an interactive Agile Scrum–based approach, BIS gathers requirements that it can continuously refine. Further, Scrum helps the team deliver products in short cycles, enabling rapid feedback, continual improvement, and rapid adaptation to change.
For users, the dashboards offer an easy-to-consume visual overview of information and let them drill down to review more details. Instead of manipulating data manually within spreadsheets, staff and faculty now easily interact with data, which helps them more quickly make accurate decisions.
To provide these analytics solutions on a limited budget, BIS leverages various software solutions to ensure its data are reliable and interactive. The data, which come from several different sources—including Ellucian, Oracle, and Excel spreadsheets—are integrated through Informatica and governed using Collibra. The data are then provided in readily accessible format through Tableau, Cognos, and ThoughtSpot, a keyword search and AI analytics tool. Leveraging these tools lets BIS provide high-quality, highly specified data personalized for GW departments, organizations, and individual users.
Lessons Learned
In developing the BI initiative at GW, BIS learned that various factors contribute to a BI program's success, especially when budgets are limited:
- Use Agile approaches to increase user adoption.
- Engage users and solicit their feedback continually to ensure greater success in leveraging dashboards and decision centers.
- Provide a trusted, integrated data infrastructure to offer business partners a self-service option.
- Engage business partners from the beginning to help champion culture change and promote adoption.
- Ensure that business owners and product users share in the tools' benefits.
- Engage a top-level executive to help actively and visibly champion the change. Such support has proven critical to the success of many dashboards and decision centers.
- Use previously established software in highly innovative ways, such as constantly communicating with users and creating highly personalized dashboards based on their needs.
- Ensure that you have trusted data, without which the dashboards and software are useless. At GW, we ensure high data quality, integrity, and consistency by tightly coupling BI with data governance.
- Establish minimum standards for governing and defining institutional data to ensure that the quality of the data will allow for the operational and transactional success of all who use the data.
- Develop responsibility roles to help govern the data. Our BI solutions rely heavily on data governance, which uses innovative technology to ensure the successful deployment of consistent information.
- Use an Agile process to quickly develop dashboards for specific business units. At GW, we continuously improve the BI products after the initial dashboard is built and let stakeholders request necessary changes or additions without a long waiting period.
The BIS team is able to react quickly to change, providing value at every step of the process.
Conclusion
As these case studies and their lessons learned describe, analytics and BI efforts provide many opportunities to increase information-based decision-making at higher education institutions. Such efforts allow IT teams—and often institutional research teams—to demonstrate the value of analytics in answering important institutional questions, as well as in helping institutions assess progress toward strategic goals and objectives and thereby achieve their larger missions.
This is one in a collection of resources related to how colleges and universities can demonstrate the value of analytics and BI. For more resources and tools on this topic, go to Using Analytics to Answer Important Institutional Questions.
Christopher Reichley is the Director of Application Development and Integration at University of Mississippi.
Jennifer Phillips is the Assistant Director for Retention at University of Mississippi.
Kathryn Gates is CIO Emerita at University of Mississippi.
Vanessa Brown is the Associate Director of Business Intelligence Architecture at Ithaca College.
Rob Snyder is Information Systems and Analytics Manager at Ithaca College.
Lois Brooks is Vice Provost for Information Technology and Chief Information Office at University of Wisconsin-Madison. She was formerly Vice Provost for Information and Technology at Oregon State University.
Kent Kuo is the Director of Enterprise Computing Services at Oregon State University.
Jelena Roljevic is the Associate Vice President of Business Intelligence and Enterprise Information Services at The George Washington University.
© 2018 Christopher Reichley, Jennifer Phillips, Kathryn Gates, Vanessa Brown, Rob Snyder, Lois Brooks, Kent Kuo, and Jelena Roljevic. The text of this work is licensed under a Creative Commons BY-NC-ND 4.0 International License.