
EDUCAUSE has defined an initial eight digital capabilities for higher education and developed corresponding maturity and technology deployment assessments. This article describes those capabilities and provides advice for attaining them.

Technology's value to organizations and individuals increasingly extends beyond productivity to the enhancement of learning, collaborating, and decision making. Organizations thus find it increasingly important to develop and apply digital capabilities in order to survive, let alone thrive. It no longer suffices to think of technology as merely an arms race, in which the winners keep getting faster and cheaper. The fast and cheap of automation and storage form the base of a pyramid rapidly gaining additional layers, with social and mobile new layers that have emerged in just the past decade. Cloud and analytics are newer still, and the Internet of Things layer is still being built.
Meanwhile, colleges and universities struggle to fund wireless access, standardize and upgrade classroom technologies, and decide what to do about aging enterprise applications. IT funding in higher education remains a zero-sum game, but with growing evidence that such an approach is like paying a fixed amount on a credit card or a payday loan: a sure strategy for digital insolvency. And indeed, education as a sector ranks 14th of 22 sectors in the McKinsey Global Institute Industry Digitization index, "a comprehensive picture of where and how companies are building digital assets, expanding digital usage, and creating a more digital workforce."1
Perhaps more sobering is growing evidence of a digital divide that applies not just to industries or individuals but to institutions. About one in three colleges and universities is a self-described early adopter of technology, one in four is a late adopter, and the rest (39 percent) are mainstream adopters. Early adopters are moving rapidly to incorporate trends such as the Internet of Things, personalized learning, and agility into their IT strategy.2 They are also deploying new technologies more rapidly, putting more effort into over half of the approximately 80 emerging technologies EDUCAUSE tracks than self-described mainstream adopters. Mainstream adopters, in turn, devote more effort than those identifying as late adopters. Extrapolating based on their stated plans, the early adopters will move further ahead of the pack, and the late adopters will straggle further behind.3
This is more than just bandwidth optimization or settling for feature phones when others have smartphones. Technology is integral to achieving many of higher education's highest priorities and challenges, whether they entail:
- automation to streamline costs;
- standards to facilitate outsourcing, shared services, and partnerships;
- student success technologies and applications to provide academic maps, planning and advising, early alerts, and progress tracking;
- analytics to measure and improve learning, student success, institutional efficiency, and other data-informed priorities;
- technologies and supporting services to help faculty use technology to improve existing courses or develop effective online courses;
- technologies and supporting services to help faculty conduct research and scholarship in digital environments and with colleagues across the world;
- applying technology to achieve a competitive edge in pedagogy, student outcomes and experiences, and research and scholarship; or
- safeguarding institutional resources and reducing risk.
Technology is expensive and essential. Colleges and universities can't afford to dedicate resources and time on poorly conceived or inconsequential technology investments, or on inventing local solutions to widespread needs.
Digital Capabilities for Higher Education
Digital success extends beyond technology adoption and beyond the IT organization. It encompasses the entire institutional leadership and community, and rests on a set of digital capabilities. Digital capabilities are the application of technology to the core functions of an enterprise: They are the "how" of an organization, rather than the "what," which would be specific technologies and services. Digital capabilities can be defined for institutional missions, IT management, and foundational IT functions. Each capability area examines multiple dimensions of progress, not just technical ones, such as:
- A sufficient and sustainable funding model
- A sufficient and sustainable staffing model
- Active support from institutional leadership
- Active support from the faculty
- Engagement of the entire institutional community
- Adequate training for the institutional community
- Alignment with institutional strategy
- Dedicated leadership of the area
- Support for policies that are appropriate and clear
Capabilities have been an aspect of technology and business management for many years.4 Although higher education has perhaps over-adapted core technologies to our culture and under-adapted our culture to fit standard business practices, we are nonetheless a specialized "industry" with correspondingly specialized needs. Our core missions of research and education distinguish us from industries focused on finance, commerce, or manufacturing. Our reliance on a highly creative and diverse workforce (faculty) who not only teach and create but also help manage and lead engenders a very different decision-making structure than, say, a hospital or bank. Our complex ecosystem of "customers" is highly distinctive: Faculty, students, alumni, donors, and the local community are all constituents, but with highly dissimilar needs. Higher education's digital capabilities will differ somewhat or considerably from other industries' or from generic capabilities. Higher education needs its own set of capabilities, informed by existing capabilities and adapted to this industry.
Our industry is large, with over 4,000 institutions in the United States alone, and highly collaborative. EDUCAUSE members have put that scale and collegiality to good use by collectively identifying key components for digital success. EDUCAUSE has been conducting research since 2012 to identify, define, and measure a core set of digital capabilities — the how — and their corresponding technologies and services — the what — for higher education.
- EDUCAUSE maturity indices measure digital capabilities. They enable institutions to determine where they are and where they aspire to be.
- Deployment indices measure stages of deployment for specific technologies and services, which can be a measure of whether capabilities are being put to use via technologies and services.
The EDUCAUSE Core Data Service, with participation exceeding 800 institutions, is the annual data collection mechanism for our maturity and deployment indices. Our goal is to help colleges and universities efficiently use technology to achieve strategic institutional priorities and to support and optimize ongoing operations.
This article describes the EDUCAUSE maturity and deployment model, the current status of maturity and deployment for the eight areas we have developed so far, and implications:
- Is higher education more capable in some areas than others?
- How are capability areas related? Is effective leadership in one area, for example, related to some overall leadership capacity? Or does higher education's highly distributed decision making and organizational structure result in little translation across capabilities?
- Are capability maturity and technology deployment related? In other words, is higher maturity associated with deployment of more technologies?
- Are we making progress — is maturity increasing?
EDUCAUSE Capability Areas
The methodology EDUCAUSE uses to help institutions assess digital capabilities and monitor their progress with maturity indices consists of expert-driven design and validation wrapped around a research-driven process. The research (1) provides assessments of the current maturity of each capability throughout higher education and (2) helps validate the work of subject matter experts, who draft the initial assessment items (informed by any existing bodies of work) and group them into components, or dimensions.
EDUCAUSE has defined eight capabilities and maturity assessments. As with many capability models,5 EDUCAUSE has conceptually organized this set into different levels (figure 1).
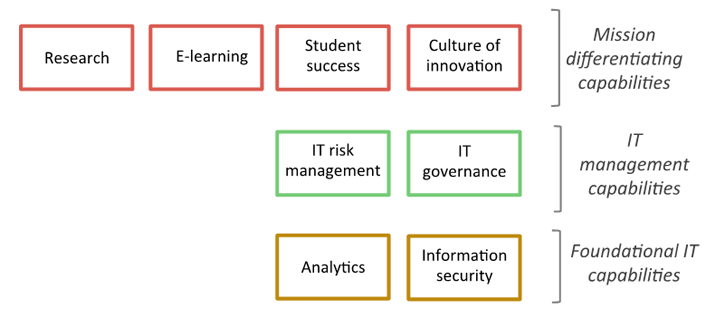
Figure 1. Higher education digital capabilities conceptual map
Mission-differentiating capabilities are the IT capabilities directly associated with the institutional mission. Research computing, e-learning, and student success technologies reflect those capabilities required for successful delivery of technologies and services in support of research and scholarship, education, and student retention and completion. The culture of innovation index assesses the extent to which the institution is open to and prepared for transformation.
- Culture of Innovation: Nurturing an environment that continually introduces new ideas or ways of thinking, then translates them into action to solve specific problems or seize new opportunities6
- E-learning: Learning that involves a web-based component, enabling collaboration and access to content that extends beyond the classroom7
- Student Success Technologies: Information technology that helps students explore and select a pathway of interest, tracks and supports students' progress along their chosen pathway that ultimately results in student success, and provides institutional leadership, faculty, and advisors with tools and information they need to contribute to student success
- Research Computing: Services and infrastructure provided to faculty, students, or research staff for the purpose of performing research at a higher education institution8
IT management capabilities relate to the IT function's relationship with institutional management.
- IT Governance: A decision-making process that ensures the effective and efficient use of information technology and alignment of the campus IT strategy with the institution's strategic plan9
- IT Risk Management: The process of identifying, assessing, prioritizing, and addressing the major IT risks associated with an institution's key objectives10
Foundational capabilities underpin effective and efficient application of information technology to institutional priorities. Analytics relates to technologies that enable institutions to use data to make informed and effective decisions. Analytics is a tool, a means to an end, rather than an end in itself (unlike student success). Information security safeguards data and identities and is indispensable in today's environment.
- Analytics: The use of data, statistical analysis, and explanatory and predictive models to gain insights and act on complex issues11
- Information Security: Functions and resources associated with providing information and systems security services and programs for the institution, including directory, identity management, and access provisioning/de-provisioning functions and roles, etc.12
Maturity Dimensions
The items in each maturity index cluster into several dimensions that describe key components of the capability. The dimensions are generated by a statistical principle components analysis and then validated by subject matter experts. The number of dimensions per index range from 4 to 7 (table 1).
Table 1. Capability dimensions
|
Capability Level |
Capability Area |
Dimensions |
|---|---|---|
|
Mission differentiating |
Culture of innovation |
|
|
E-learning |
|
|
|
Research computing |
|
|
|
Student success |
|
|
|
IT management |
IT governance |
|
|
IT risk |
|
|
|
Foundational IT |
Analytics |
|
|
Information security |
|
EDUCAUSE generates a composite maturity score and dimension scores for each maturity index. The Digital Capabilities in Higher Education report series13 provides detailed information about the items in each of the eight assessments, including the specific items, their mean scores, and institutional difference highlights from the 2015 Core Data Survey.
Assessing Your Institution's Maturity
Institutions that contribute to the EDUCAUSE Core Data Service can benchmark their own digital maturity using the EDUCAUSE Benchmarking Service (EBS). EBS enables institutions to quickly configure and generate detailed maturity and deployment reports that include peer comparisons and advice.
Current Maturity Levels
Maturity levels differ according to the capability area, but they don't seem to be increasing, at least during the short time EDUCAUSE has been tracking them. Although maturity scores within the IT management and foundational levels are interrelated, the mission-based capabilities are relatively independent.
Is higher education more capable in some areas than others?
We reviewed the composite maturity scores for each index and slotted the institutions that provided data14 into one of five categories:
- Absent: Institutions whose composite maturity score was 1–1.99.
- Initial: Institutions whose composite maturity score was 2–2.99.
- Developing: Institutions whose composite maturity score was 3–3.99.
- Established: Institutions whose composite maturity score was 4–4.99.
- Optimized: Institutions whose composite maturity score was 5.
Few institutions were classified as optimized on any of the maturity indices (figure 2). The majority of institutions have achieved a developing level of maturity in student success, e-learning, analytics, and research computing. Institutions are evenly split between initial and developing status for IT risk management. A plurality of institutions have achieved only initial status in information security and IT governance. Culture of innovation has the lowest mean maturity of all the indices, and more institutions are at the absent level than any of the four higher levels.
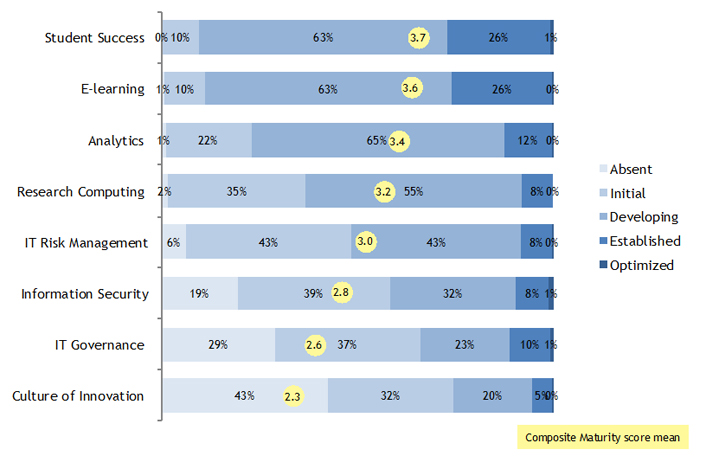
Figure 2. Maturity status of higher education institutions
Higher education is generally furthest ahead with capabilities that pertain to particular parts of the institution. This might be due to higher education's distributed leadership structure. It is easier to make progress within specific areas (such as student success) than across the entire institution. The four lower-scoring capabilities (IT risk management, information security, IT governance, and culture of innovation) are much more dependent on institution-wide focus and investment.
Figure 3 compares the dimensions as well as composite scores across indices. Although the order of composite maturity still stands — with student success highest and culture of innovation lowest — some individual dimensions depart from that order. For example, the e-learning operational effectiveness dimension has the highest maturity across all composite scores and dimensions. Composite maturity scores for e-learning, analytics, and IT risk management are dragged down by their lowest-scoring dimensions (e-learning analytics, analytics investment/resources, and IT risk management investment, respectively).
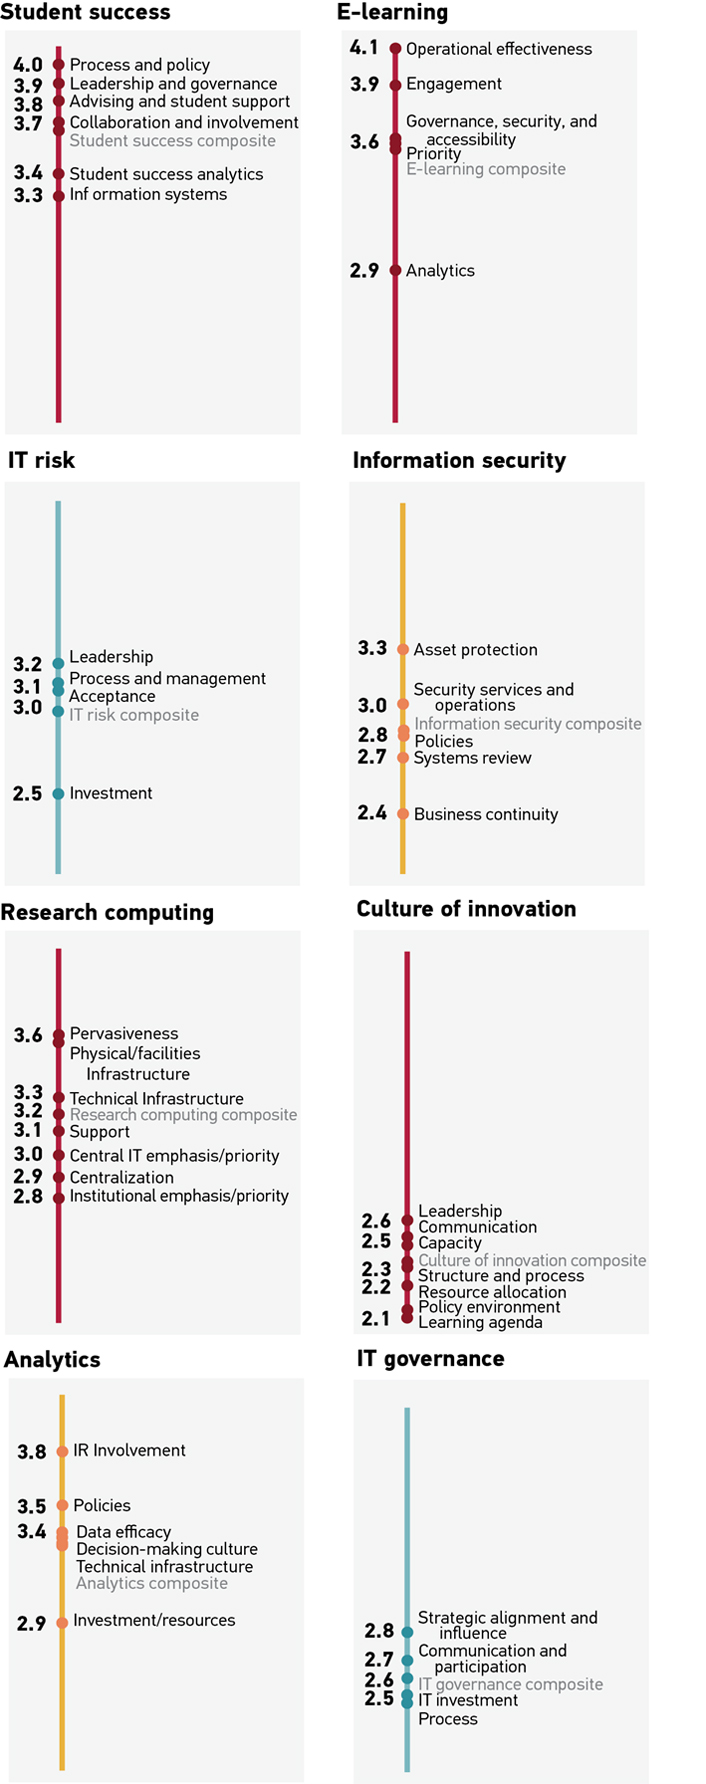
Figure 3. Comparison of maturity dimensions
Research computing's two highest-scoring dimensions — pervasiveness and facilities/infrastructure — pull up its composite score a bit. The IT governance maturity dimensions all cluster within 0.3 scale points, whereas e-learning maturity dimensions have a comparatively wide 1.2 point range. Culture of innovation is clearly the lowest index, with the composite and four of its seven dimensions lower than any other index composite or dimension.
Is maturity improving?
Maturity levels are changing very little, if at all. We have data for both 2014 and 2015 for all the indices except culture of innovation. Maturity didn't budge for IT risk management, e-learning, analytics, or information security. It barely increased — by 0.1 point — for IT governance, student success technologies, and research computing.15
How are the capability areas related?
Strong capabilities in some areas correspond to strong capabilities in other areas (and the same applies to weak capabilities). Figure 4 displays the major associations among maturity index composite scores. Lines connect capabilities that inter-correlate at the r = .35 level and above.16
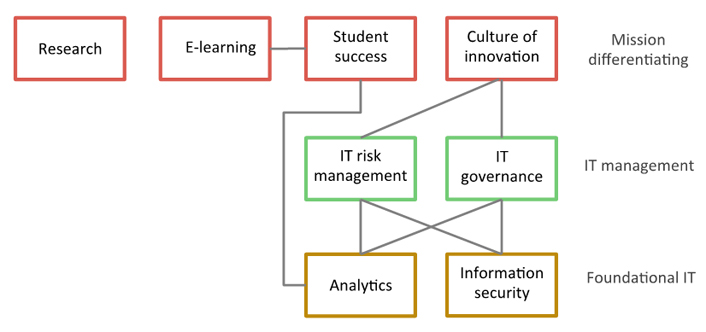
Figure 4. Major correlations among maturity indices
Figure 5 depicts the much more complex set of significant interrelationships at the dimension level. To reduce the complexity somewhat, Figure 5 uses a somewhat higher correlational threshold (r = .40 and above). Interested readers can explore these relationships more fully with the interactive version of figure 5.
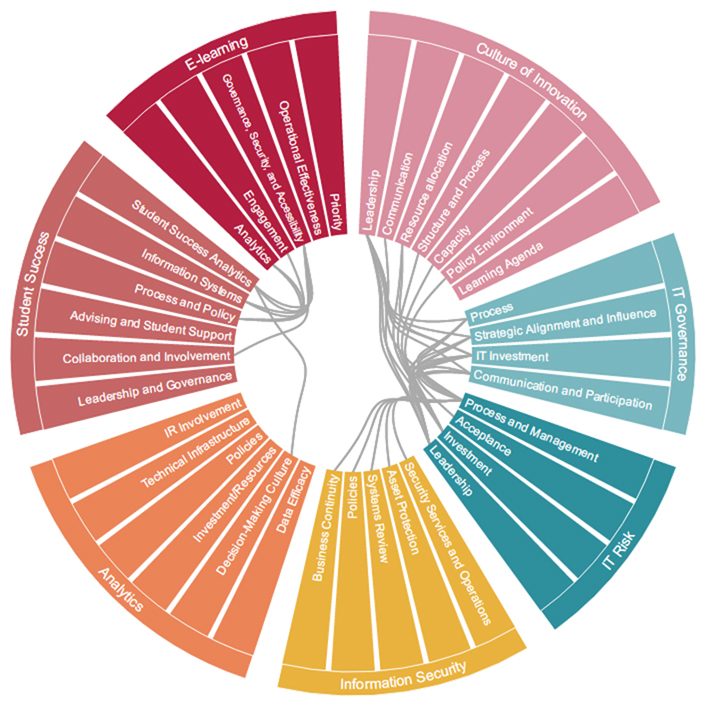
Figure 5. Major correlations among index dimensions
The mission-differentiating capabilities of e-learning and student success are correlated. Analyses of correlations among their dimensions suggest the relationship is due to underlying connections among:
- E-learning analytics and student success analytics and information systems
- Student success process and policy and e-learning engagement and governance, security, and accessibility
- E-learning governance, security, and accessibility and student success collaboration and involvement, process and policy, information systems, and analytics
Student success is also related to analytics maturity. In particular, a stronger decision-making culture (analytics) is associated with stronger student success analytics.
The two IT management capabilities — IT governance and IT risk management — might be considered "super connectors." Each is related to four (half of the) capabilities. IT governance and IT risk management are correlated with each other and with information security, analytics, and culture of innovation. This might suggest the central importance of effective IT management capabilities. These two capabilities have many commonalities: the IT risk process and management, investment, and leadership dimensions are significantly correlated with all dimensions of IT governance.
The two IT management capabilities are related to only one of the four mission-differentiating capabilities: culture of innovation. This reinforces the earlier interpretation of the challenge of institution-wide initiatives. IT governance, IT risk management, and culture of innovation all require institution-level coordination: Institutions that can achieve it would be likelier to be effective in all three areas, and institutions that cannot would be relatively less effective.
The culture of innovation leadership dimension seems to be the strong link to both IT governance and IT risk management. Other underlying correlations exist among the dimensions of resource allocation (culture of innovation), investment (IT risk management), and IT investment (IT governance) and between IT risk management investment and culture of innovation leadership, resource allocation, structure and process, capacity, and policy environment.
The relationship between information security and IT risk management is particularly related to the IT risk process and management dimension. Although IT governance and information security are related, the significant relationships are between the composite capabilities and not among specific dimensions.
Although IT risk management, IT governance, and analytics are related, the significant relationships are between the composite capabilities and not among specific dimensions.
Research computing stands alone, with no special connection to any other capability area. This might be because individual faculty set (and fund) research priorities, whereas academic leadership administers programs, priorities, and funding for e-learning and student success, and the overall culture of innovation is dependent on institution-level leadership.
Worth noting also is the absence of strong relationships among what might seem to be very similar underlying functions. We examined 82 items related to 9 functions that appeared throughout many of the maturity indices: alignment, community engagement, faculty support, funding, leadership, policy, institutional priority, staffing, and training. With the exception of some specific dimensional correlations reported earlier, we found no evidence of any sort of institutional efficacy for any function. So, for example, there seems to be no overarching institutional aptitude for creating and enforcing policies that uniformly pertains to research computing, information security, e-learning, student success, and analytics (or even for a subset of them). What happens in e-learning stays in e-learning, except it talks a bit with student success.
Technology Deployment Status
Five of the capability areas (all except IT governance, IT risk management, and culture of innovation) have associated deployment indices that track the extent to which colleges and universities have deployed relevant technologies and services. We classified deployment into five categories according to the percentage range of institutions that have deployed each technology institution-wide:17
- Universal: Deployed institution-wide in 81–100 percent of institutions
- Mainstream: Deployed institution-wide in 61–80 percent of institutions
- Growing: Deployed institution-wide in 41–60 percent of institutions
- Emergent: Deployed institution-wide in 21–40 percent of institutions
- Experimental: Deployed institution-wide in 0–20 percent of institutions
Table 2 lists the technologies in each deployment index, organized by deployment category.
Table 2. Deployment indices
| |
Experimental |
Emergent |
Growing |
Mainstream |
Universal |
|---|---|---|---|---|---|
|
Analytics |
Modeling and predictive analytics Software and model management tools Statistical analysis Text analysis Turn-key analytics solution (e.g. Civitas, EAB Student Success Collaborative, etc.) Visualization Web data capture |
BI reporting Data warehouse Extract, Transform, Load (ETL) |
Database management system (DBMS) |
|
|
|
E-learning |
E-publishing platform for learning Remote exam proctoring Virtual computer lab delivery |
Digital asset management system for learning E-books or e-textbooks E-learning course analytics for instructors Electronic student portfolios Lecture capture Multi-media production for online learning |
Real-time web- or video-conferencing online learning environment |
Collaboration tools for learning Plagiarism detection system Student evaluation of teaching effectiveness |
Full function online learning delivery system |
|
Information security |
Data loss prevention Endpoint encryption for sensitive data Malware protection Network intrusion prevention system Penetration testing tools Secure wireless access |
Log management Secure remote access Network access control system Scanning tools for private/protected information Security information and event management |
Endpoint configuration management Network intrusion detection system Vulnerability assessment tools |
Host based intrusion detection system Host based intrusion prevention system Network filtering |
|
|
Research computing |
Consulting and/or training services for researchers Data archival services Pre-arranged cloud-based compute services Pre-arranged cloud-based storage services Revision control system for managing source code Specialized scientific apparatus support Specialized software support Support for locally developed scientific software Support for research databases Institutional grid computing services Visualization |
Active data storage services High-performance computing High-performance local area network High-throughput computing |
High-performance wide area network |
|
|
|
Student success technologies |
Course/program recommendation system Student self-service referral to social/community resources Student success analytics dashboards Student success data warehouse/operational data store |
Academic early alert system Education plan creation/tracking system Advising case management system for student interaction tracking Advising center management Student co-curricular activities management system Student extracurricular activities management system |
Credit transfer/articulation system |
Degree audit |
|
The deployment indices reflect the numerous technologies that comprise each capability area, and yet they are by no means comprehensive. They represent a set of technologies and services that are worth considering and that are useful and important, but not all need be deployed to excel in a particular area. They also do not include an array of technologies EDUCAUSE surveys in its annual "strategic technologies" research of emergent technologies, and readers are encouraged to consult that report for a deeper view into the related technologies EDUCAUSE members are planning, piloting, and deploying. Many of those technologies may be included in future versions of these deployment indices.
How are the deployment areas related?
Maturity usually correlates significantly with deployment: institutions with higher maturity levels have deployed more related technologies and services (table 3).
Table 3. Correlation between maturity and deployment
|
Area |
Correlation |
|---|---|
|
Information security |
0.66 |
|
E-learning |
0.56 |
|
Research computing |
0.49 |
|
Analytics |
0.37 |
|
Student success |
0.18 |
The puzzling exception is student success: Maturity in and deployment of student success technologies only have a 0.18 correlation. That low correlation does not mask a strong relationship between maturity and particular technologies: No student success technology correlated even moderately with composite student success maturity or any of its dimensions. This was true even of the maturity dimension of student success information systems. The average correlation of deployment index items with the information systems dimension is 0.13. The highest correlation between that maturity dimension and a student success technology deployment was a modest 0.23 with academic early alert system deployment. This could reflect the highly volatile state of student success technologies:
- The solution space offers abundant competing products.
- Multiple technologies are required to support an encompassing student success strategy that provides academic maps, progress tracking, advising/counseling, and early alerts.
- The field is changing so rapidly that today's technologies are surpassed almost faster than they can be fully deployed.
Student success technology deployments, however, were related to deployments of other technologies. The student success deployment was related to both analytics (r = 0.44) and e-learning (r = 0.30) deployment.
IT risk management has no associated deployment index, but IT risk maturity strength is associated with greater deployment of information security technologies and services (r = 0.37).
Implications
The maturity indices reflect current thinking about best practices in each of the eight capability areas. Each item in each index is worth considering and probably worth aspiring to. The deployment indices are quite different. Institutions must understand their priorities, needs, and budgets and identify the technologies and services best suited to their institutional mission. A college or university can attract and support world-class research faculty without providing high-performance computing services. Institutions focused on residential educations will opt for very different e-learning technologies than those making a big play in distributed online learning.
For higher education digital capabilities today, it all boils down to leadership. The level of leadership determines the level of progress: Cohesive institutional leadership enables cohesive digital maturity. Siloed leadership supports siloed maturity. Higher education's distributed culture, funding, and leadership are all reflected in the maturity capability scores. Almost everything is local: training, alignment and coordination, funding, leadership, and staffing all reside within mission, function, or management siloes. What works well within one context does not necessarily extend to another. Digital capabilities and technology deployments for e-learning and student success bolster one another, but they both exist within an overarching and overlapping academic leadership context. Research computing exists independently, unsupported by and not supporting maturity or deployment in other areas. But research tends to be a highly decentralized mission at most institutions, driven primarily within departments or even more so by individual faculty, and so research computing maturity is a very different undertaking.
IT's ability to support institution-wide transformation seems to be directly limited by the institution's ability to transcend silos and operate cohesively. Both IT governance and IT risk management require strong coordination and collaboration between IT leadership and institutional leadership. Foundational IT (like information security and analytics) depends on effective decision making, strategic funding, and the ability to assess and respond to risks at levels acceptable to the institution. Today neither IT governance nor IT risk management maturity connects to maturity in e-learning, student success technologies, or research computing. Yet mission-based IT depends on foundational IT: on information security to protect student and research assets, and on analytics to facilitate student success and big data infrastructure. If institutional leadership cannot nurture IT foundations through effective IT governance and risk management, institutions run the risk of starving their core IT and ultimately limiting or severely jeopardizing technology's contributions to learning, student success, and research.
Information technology is continually changing. The capabilities required for successful digital initiatives will need to change commensurately.
They will change in response to improving maturity, changing standards and practices, and advances in technology. EDUCAUSE's initial work will continue as we update, retire, and develop new capability areas and their corresponding maturity and deployment indices. Figure 6 illustrates potential continuing development of our model. For 2017's EDUCAUSE benchmarking service, we will release a new maturity index for IT service management. Because IT risk management and IT governance are so highly interrelated, statistically and conceptually, we will also merge the IT risk management and IT governance indices into a single IT governance, risk, and compliance index. We are considering the areas of IT agility and human capital management for future years.
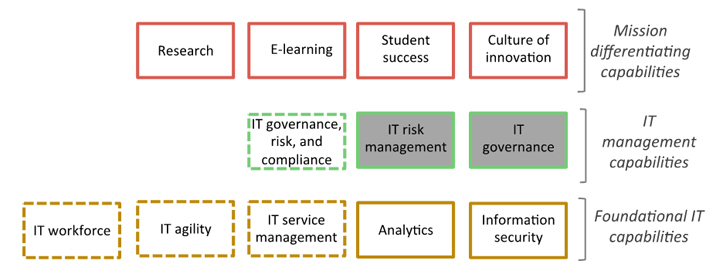
Figure 6. Higher education digital capabilities conceptual map, potential future state
Digital capabilities are more than just an intellectual curiosity or comforting framework for those who like structure. They provide concrete descriptions of what organizations ought to have and do to apply technology wisely and well. They can help individual institutions see where they are, compare themselves with peers and with their own ambitions, and identify the work they need to undertake to move from lagging to part of the pack to leading. Digital capabilities can take much of the guesswork out of technology investments and help higher education when it very much needs help.
Recommendations
- Understand the nature and importance of digital capabilities. Recognize the many nontechnical resources and investments that must be in place for technology initiatives to succeed. Technology strategy is institutional strategy; it is important to understand how to implement technology strategy effectively.
- Assess maturity and set improvement targets. Measurement matters. Understand and assess your institution's digital capabilities to ground your technology investments and operations. Participate in the annual EDUCAUSE Core Data survey to contribute your data, and use those results to create capability assessment reports in the EDUCAUSE Benchmarking Service (EBS). Use the EBS reports to identify the activities and processes that are holding your institution back, and create plans to improve them.
- Focus on leadership. Cohesive institutional leadership enables cohesive digital maturity; siloed leadership supports siloed maturity. IT's ability to support transformation, make decisions, and manage risks institution-wide depends on the institution's ability to transcend silos and operate cohesively.
- Leverage related areas. Strong analytics capabilities can enhance student success initiatives, and progress with student success goes hand-in-hand with progress with e-learning. These three areas are another place to start.
Notes
- James Manyika, Sree Ramaswamy, Somesh Khanna, Hugo Sarrazin, Gary Pinkus, Guru Sethupathy, and Andrew Yaffe, "Digital America: A Tale of the Haves and Have-mores," McKinsey Global Institute (December 2015).
- Susan Grajek, Trend Watch 2016: Which IT Trends Is Higher Education Responding To? research report (Louisville, CO: ECAR, March 7, 2016).
- Susan Grajek, Higher Education's Top 10 Strategic Technologies for 2016, research report (Louisville, CO: ECAR, January 2016).
- Watts S. Humphrey, Managing the Software Process (Reading, MA: Addison-Wesley, 1989); and David F. Feeny and Leslie P. Willcocks, "Core IS capabilities for exploiting information technology," Sloan Management Review, Vol. 39, No. 3 (Spring 1998): 9.
- Peter Burns, David Hovenden, Mark Johnson, and Socrates Vossos, "The New IT Agenda: How to define and deliver a capabilities-driven approach," PriceWaterhouseCoopers, 2012; and A.T. Kearney, "Building a capability-driven IT organization" [https://www.atkearney.com/documents/10192/379138/Building_a_Capability-Driven+_IT_Organization.pdf/b42ce349-90c2-4144-b2f1-d8b1ee51ceaf], 2011.
- Brian Setser and Holly Morris, Building a Culture of Innovation in Higher Education: Design & Practice for Leaders, EDUCAUSE, April 2015.
- Jacqueline Bichsel, The State of E-Learning in Higher Education: An Eye Toward Growth and Increased Access, research report (Louisville, CO: EDUCAUSE Center for Analysis and Research, June 2013).
- Jacqueline Bichsel, Research Computing: The Enabling Role of Information Technology, research report (Louisville, CO: EDUCAUSE Center for Analysis and Research, November 2012).
- Joanna Lyn Grama, "Understanding IT GRC in Higher Education: IT Governance," EDUCAUSE Review, February 22, 2015.
- Joanna Lyn Grama, "Understanding IT GRC in Higher Education: IT Risk," EDUCAUSE Review, February 22, 2015.
- Jacqueline Bichsel, 2012 ECAR Study of Analytics in Higher Education, research report (Boulder, CO: EDUCAUSE Center for Analysis and Research, June 2012).
- IT Domain Definitions, EDUCAUSE Core Data Service.
- Susan Grajek, E-Learning: Strategic Capabilities in Higher Education, 2015, research report (Louisville, CO: EDUCAUSE Center for Analysis and Research, August 19, 2016).
- An average of 553 institutions completed each maturity index: 290 for research computing, 499 for information security, 517 for analytics, 524 for student success technologies, 537 for e-learning, 582 for culture of innovation, 729 for IT risk management, and 747 for IT governance.
- Due to the large sample sizes, this far exceeds the standard p values of .05, .01, or even .001. We chose instead to use a threshold that might have practical significance in addition to statistical significance. Even a correlation of .35 suggests only a modest 12 percent (or R2) overlap between two items, suggesting a moderate relationship.
- Participants in EDUCAUSE's Core Data survey have access to much more detailed data on deployment of these technologies.
- Participants in EDUCAUSE's Core Data survey have access to much more detailed data on deployment of these technologies.
Susan Grajek is vice president of communities and research for EDUCAUSE.
© 2016 Susan Grajek. The text of this article is licensed under Creative Commons BY-NC-ND 4.0.