
Key Takeaways
-
This four-part series on successfully establishing a business intelligence program at your higher education institution provides a how-to guide for strategic planning, building the organization, managing work, and marketing your products.
-
Managing BI work requires establishing project and portfolio management infrastructure and processes, while also creating the opportunity to improve visibility of your work and use data to drive planning and priorities.
-
Comparing organizational design activities at the University of Washington and Purdue University revealed common themes: ensuring quality data, quarterly resource planning, and reporting on time allocations and capacity.
Whether you are new to the field or a seasoned business intelligence (BI) professional, there are some basics (and not so basics) you need to run a successful analytics organization. In this four-part series, we cover key concepts to help you build, manage, and sustain your BI team. Taking the University of Washington and Purdue University as examples, we share practical tips for establishing your program, strategic planning, building the organization, managing the work, and marketing your products. We also reference industry best practices we have found helpful in building BI organizations at four institutions. In this article, part three of the series, we continue with a discussion on managing BI work.
Managing the Work
As with strategic planning and building the BI organization, much valuable information has been published about project and portfolio management. One recent example from EDUCAUSE Review is Anne Milkovich's article, "Institutional Portfolio Management: A Framework to Improve Institutional Performance," which provides an excellent treatment of this subject applied to higher ed IT projects. Here we focus on applying these concepts in the BI context.
When managing BI work, project and portfolio management are important for the same reasons as in other areas. Rather than responding to the demands of the moment, we can review a portfolio of opportunities and focus on the ones most in line with our strategy and that will add the most value. It is also essential to creating transparency about the priority decisions, the work that is happening, and staffing capacity. This is especially important for BI work, which often crosses functional boundaries and happens in a distributed environment with many different stakeholders.
In the BI context, we also have the opportunity to leverage our BI tools and expertise to help manage our own work. In addition to being a useful application of BI principles like data visualization, this can also create a greater internal awareness within IT about the value of BI, as well as some hands-on experience for your BI team to try on the BI consumer hat. Often a very different experience than being on the infrastructure or BI producer side, this can lead to some important insights about the challenges and opportunities for the customers we serve.
Purdue University
At the time the Business Intelligence Competency Center (BICC) was forming at Purdue, our IT organization was in the midst of a project and portfolio management (PPM) initiative. This offered the BICC a significant advantage in that it allowed us to leverage existing infrastructure to track projects and resources rather than having to create something ourselves. Using our enterprise tools, we can capture all projects and project requests, along with assignments of people and hours to projects, as well as the actual time spent on projects.
To achieve this, one important part of the setup is determining what types of categories are needed to group and report on different kinds of projects and activities, as well as what hours to track and how to handle ongoing activities like support. Our BI team participated in the larger IT project to identify standard categories for projects and time reporting. We also had to implement and enforce standard practices for entering the data for our own projects and staff. The parallel with the kinds of challenges our BI team faces was easy to see. Through our work in portfolio management, we experienced firsthand the challenges of change management around operational processes and what it takes on the data entry side to ensure consistency in the eventual data output. This gave us a valuable opportunity to practice what we preach about the impact of clear definitions and data entry standards on the quality of the information that we ultimately analyze and report on.
Having an ongoing process in place to capture the data, we use it on a quarterly basis to review project proposals with our BI Governance group along with available resources. This allows us to determine our actual staffing capacity for the next three months and decide which projects we should undertake. As part of this process, we also look at the current distribution of staff hours across categories like ongoing support and operations, maintenance projects and system upgrades, and new development work (building out additional subject areas in the data warehouse or enhancing existing models).
The BI Governance group can then easily see the large percentage of staff hours consumed with ongoing support and upgrades, and determine how much additional development work we can realistically take on. Having detailed data on current activities and remaining capacity, we then review additional project requests to determine what additional work should be prioritized for the coming quarter.
Portfolio management also gives us the ability to tie specific projects directly back to our BI strategy and vision. We routinely show our BI Governance group a "map" of the projects we are working on and where they fit in, using the same diagram we use to communicate the strategy in the first place. Figure 1 shows how a set of projects undertaken over the course of a year related to the BI strategy in place at the time. (See "Running a BI Shop: Part One, Strategic Planning" for a description of how that strategy was developed.)
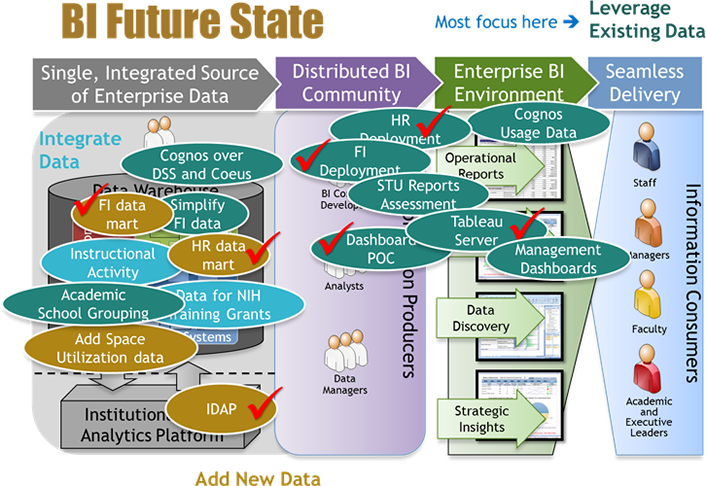
Figure 1. Illustration of the future-state goals at Purdue
This allows us to chart our progress toward realizing our future vision. Looking back across the projects and initiatives we've completed reinforces how much progress we've made. It also helps us ensure that the work prioritized is part of an ongoing focus, keeping resources aligned in the most important areas. Using the example above, we can see how the majority of the projects fell under the "Leverage Existing Data" focus, which the BI Governance group had determined had the highest priority in our BI strategy. This strong visual indicator confirms that we put our focus in the right place.
Having BI capability coupled with our project and portfolio management system also provides a way to increase ongoing transparency with key stakeholders about the BI work. We offer a self-service report that customers and partners can access any time to see details on:
- Currently active projects and enhancements
- Open project and enhancement requests
- Recently completed projects and enhancements
This report shows the customer who made the request, the title, the business need being addressed, the technical lead, and the status. More work is planned here, but we have already found the report helpful in sharing what we're working on and what has been requested.
Summing up, the combination of these activities has been instrumental in helping us manage the portfolio of BI work at Purdue:
- We leveraged the IT project and portfolio management infrastructure and processes.
- This has given us a new perspective on what our customers face when trying to establish consistent data entry practices.
- We use the resulting data in quarterly planning to determine staffing capacity and inform the BI Governance group's priority decisions.
- This approach also allows us to ensure that the projects we're completing tie back to our overall BI strategy.
- Finally, we can ensure ongoing transparency by providing a self-service report to customers and stakeholders showing current and proposed BI work.
University of Washington
Similarly to Purdue, BI at UW takes place in a highly decentralized environment with many different stakeholders having differing goals and priorities, different levels of data maturity, and a lot of complexity. How — and whether — portfolio management is practiced varies widely not only within the IT organization, but across our partner business offices. This means that any portfolio management method in BI will necessarily take on the role of communication tool with the campus. Portfolio management offers a useful way to communicate a variety of factors, such as the demand, the team's capacity to meet the demand, or the scope of work within the context of strategic plans or institutional priorities. At UW, we found that the two aspects most commonly either unknown or misunderstood about the BI team were the wide variety of work the team engaged with and the team's bandwidth to handle this work. Here's how we addressed both.
Like Purdue, at UW we leveraged existing IT infrastructure to track the actual time spent on projects. As a first step, we simply pulled the relevant information for our team from data already being captured and visualized it in a simple graphic (see figure 2). At a glance, stakeholders, our business partners, executives, and the BI team itself could now easily see the breadth of work we handled. The picture also showed the amount of time spent in each area relative to other areas, and how this changed over time.
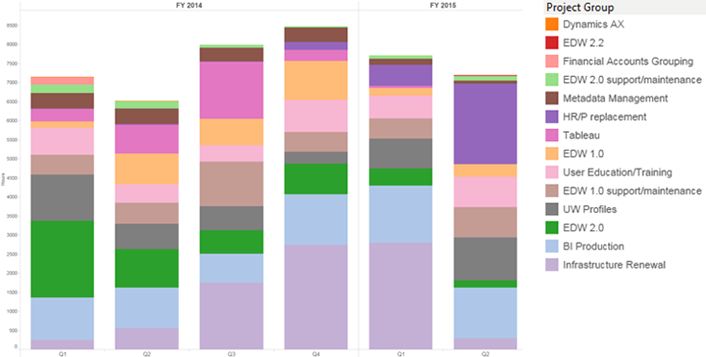
Figure 2. Variety of work handled by the BI team
While this visual provided visibility and transparency for the team's scope of work, it also raised several questions. How did we know that we focused on the right priorities? Did all areas actually require the BI team's deep data expertise, or did the rest of the organization rely on the BI team as a commodity? What capacity did the individual groups within the BI team have compared to the capacity of the overall department, and were we allocating resources efficiently? To answer these questions, we needed robust portfolio management and capacity planning processes.
Selecting JIRA as the portfolio management tool, the BI team started to track ongoing project work, new requests, resources needed, and priority. JIRA also provided a central place to capture information about scope, level of effort, and status of the work. Each work item linked to the strategic plan. Under the leadership of the project manager, the senior managers reviewed the full portfolio once a quarter and triaged the top-priority work items every few weeks. This ensured that everyone understood the progress made and any potential challenges. Because the JIRA dashboards were open to the whole team as well as to business partners, they provided transparency, and updates were visible to everyone in real time. JIRA's "work view" allowed users to see an item's status: on the to-do list, in progress, or completed. Customers could submit comments on the work items directly in the tool. The benefits included more efficient communication with stakeholders because stakeholder meetings could now focus on prioritization and decision making rather than tactical status updates. It also provided a portfolio management model for other teams within and outside of IT to consider.
Once we had the processes and infrastructure in place to manage the BI portfolio, we needed a method to measure the bandwidth available to do the work. We needed to know the resources available and for how much time. We also needed to anticipate changes to availability and address any gaps in either expertise or bandwidth. Ultimately, we needed to know what work and how much of it the BI team could commit to and deliver per quarter. To do this, the managers first worked together to determine the resources needed across the department. Then each manager estimated the staff time it would take to address the priorities in a given quarter, per month, and based on a maximum availability of 32 hours per week per team member. This information became the basis for what-if analysis in Tableau.
The individual work items grouped into higher-level categories; for example, maintenance and support were part of "keeping the lights on." "Non-negotiable work" included those same work items, and additional must-dos related to supporting operations, such as source-system level changes to data or data structures the BI team needed to implement in the data warehouse. The top institutional priority of implementing a new HR and payroll system made up its own category, as it was expected to consume the majority of the team's time for several years. Toggling through the different categories then easily told the story of the team's capacity in pictures. Since the estimates had been collected at the individual level, we could roll up or drill down as we chose to view information about availability of individuals, sub-teams or teams. For example, if the development team was fully allocated while the operational reporting group had open capacity, that team could still deliver on work that did not require participation of the development team. This increased the overall efficiency of the BI team, as the group could take on the maximum amount of work. Toggling through the Tableau screen captures in figures 3–6 reveal the BI team's capacity.
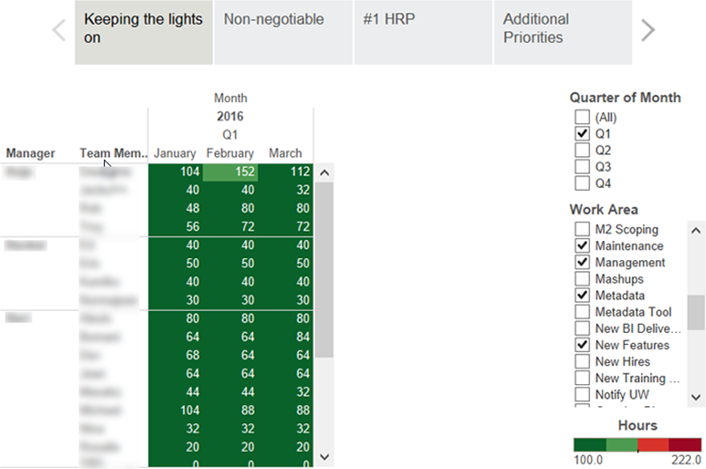
Figure 3. Three teams and their time devoted to operational functions
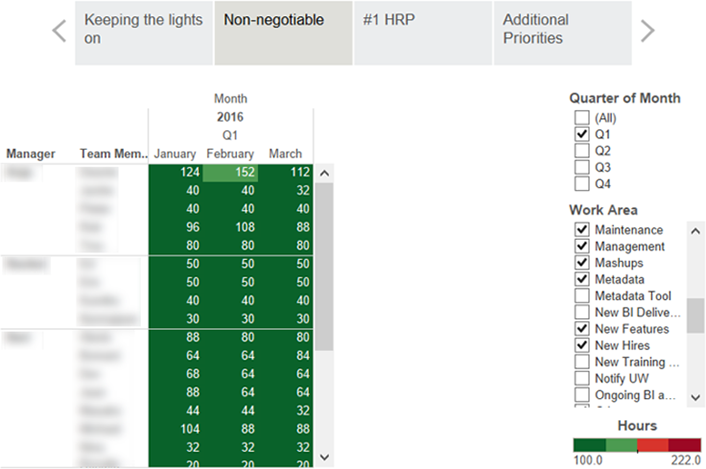
Figure 4. Three teams and their time devoted to non-negotiable projects
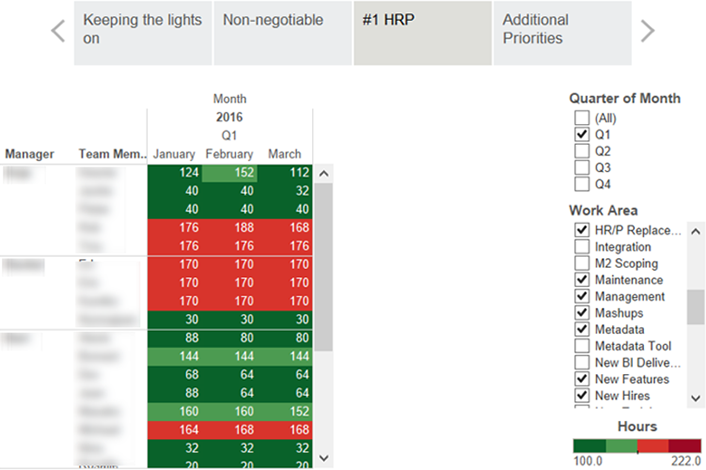
Figure 5. Three teams and their time devoted to the top-priority HR system
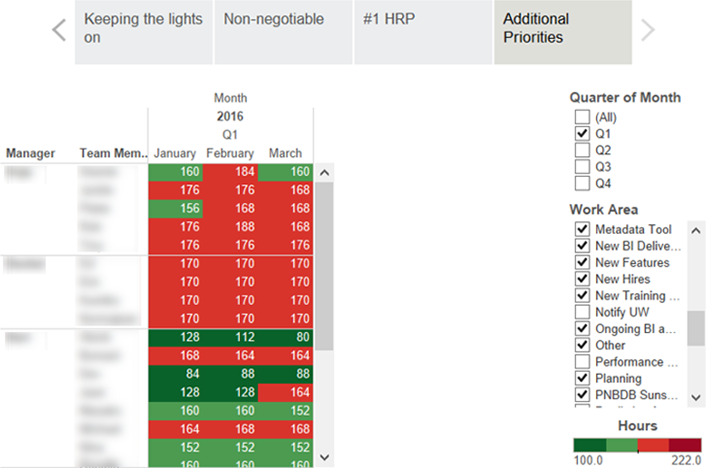
Figure 6. Three teams and their time devoted to other priorities
Now think about two additional perspectives:
- The capacity planning work described here uses estimates. How do we know these are reliable?
- Demand management and capacity planning alone do not give insight into the impact of our work. How do we know that our products are useful and used?
To improve estimates over time it helps to consider three basic premises. First, organizations typically believe they have more slack in their schedules than actually exists. Second, context switching has a cost. Depending on the resource and the context, staff switching focus from one project to another can cost between 20 minutes and two hours of lost time. Do not start, or start to track, a project until key resources are available. (This will reduce idle time, including on demand and capacity management.) By increasing your estimates to account for these factors, your estimates — and efficiency — will improve. Third, you can further improve your accuracy through data. By comparing estimates tracked in Tableau to actual time spent as recorded in existing IT project management tools, the BI team narrowed the gap between estimates and actuals (see figure 7). This increased not only our own confidence in our numbers but also credibility with customers.
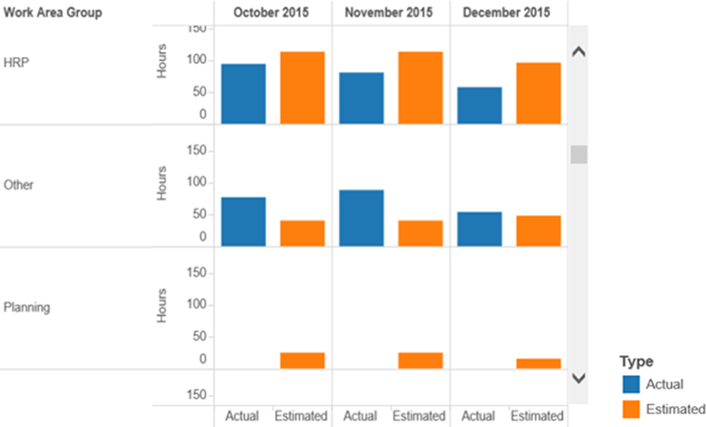
Figure 7. Comparing estimates to actual time spent
Measuring how and how often your BI products are used will confirm your approach — or help you change course. Scatter plots, bar charts, and trend lines all provide valuable insight into how often your tools get used, who uses them, and for what purpose. This can inform your work plans, help you better understand what real users do with real data, or give visibility to the scope and impact of your work to the team and to your stakeholders.
At UW, the single biggest win of establishing project portfolio management practices for BI — and showcasing them across campus — was that it got everybody on the same page with respect to the scope, variety, and content of our work. It enabled our executives to better represent BI. It provided the teams a clear line of sight to institutional priorities by linking work items to the strategic plan for the organization. And by providing context on thorny items like staffing requests, it supported fact over emotion.
Managing the Work Summed Up
Reflecting on the experiences from Purdue and the University of Washington, we conclude that improving visibility of the BI work was critical in both cases. We both needed to help customers, stakeholders, and our own teams better understand the breadth of work our BI teams undertake. We also needed to analyze the team's workload and capacity to take on additional projects so that we could set appropriate priorities.
To accomplish this, we turned to project and portfolio management tools and processes. Whether leveraging existing IT infrastructure or paving the way, we had to invest time and energy into determining appropriate categories and ensuring that our operational processes accurately captured the right data. Participating in this process also gave us an opportunity to better understand the common challenges our customers face on the front end to ensure data quality on the back end.
We found that project and portfolio management also provides an excellent opportunity for BI teams to become BI consumers by using BI to help manage BI. Through this work, we've significantly increased the transparency of our work to customers and stakeholders, and provided data to drive our planning and priorities. After all, we're in the data business, and we should practice what we preach: use data to make decisions.
Anja Canfield-Budde is the director of Enterprise Data and Analytics at the University of Washington.
Aaron Walz is the founding director of Purdue University's Business Intelligence Competency Center.
© 2016 Anja Canfield-Budde and Aaron Walz. The text of this article is licensed under Creative Commons BY-NC-SA 4.0.