
For institutions to fully benefit from their investments in student success and to position themselves for continued improvement, IT leadership must get engaged and develop an IT strategy that supports student success and can evolve with the institution's needs.

The issue of student success has risen to the forefront of public attention thanks in part to the Obama administration's goal of making the United States the world leader in four-year degree attainment among 25–34 year olds and the Gates Foundation and its emphasis on postsecondary success. If you type "student success initiative site:.edu" into the Google search box, you will get 15,200 results, providing one indication of how widespread campus efforts to improve student success have become.
Increasingly, institutions are implementing a variety of third-party products, often in a rushed or ad-hoc manner, which can limit overall effectiveness if not part of a broader strategy. We believe that for institutions to fully benefit from their investments in student success and to position themselves for continued improvement, IT leadership must get engaged and develop an IT strategy that supports student success and can evolve with the institution's needs.
This article combines the perspectives of two institutions — the University of Maryland, Baltimore County (UMBC) and the University of Arizona (UA) — to focus on how universities should look at architecting their IT strategy for student success. Author Jack Suess is vice president for IT and CIO for UMBC, and author Hank Childers is executive director for University Analytics and Institutional Research for UA.
Viewing Student Success From Different Perspectives
Creating a comprehensive approach to student success requires understanding what student success means from the perspective of various campus stakeholders. While different institutions may define stakeholder groups and their responsibilities somewhat differently, we believe it is essential to consider the motivations and needs of students, faculty, advisors, academic administrators, institutional research (IR) and assessment personnel, and student affairs staff in planning a student success initiative.
Some stakeholders, such as instructors, students, and student affairs professionals, have a strong interest in real-time (defined as while the course is active) course-based information necessary to make immediate interventions. The system most identified with handling real-time interventions — often referred to as an early alert system — takes information from multiple systems and provides timely notifications to students and/or groups in the form of a digital intervention. For example, an assignment grade in the learning management system (LMS) might trigger a note to a student suggesting they make an appointment at the writing center. Other early alert systems might look at financial issues around unpaid tuition and trigger an intervention from a financial aid caseworker to discuss payment options.
A second group of stakeholders has an interest in taking a macro-level view of all student activity to understand it and the effectiveness of campus interventions. This group includes academic administrators, IR and assessment personnel, and student affairs professionals, who often oversee student support initiatives or report on the results. This area, which has lacked systemization, often has implemented programs without understanding their direct impact, other than monitoring macro statistics such as first-year retention or six-year graduation rate for signs of improvement. A recent area of interest looks at the flow of students through the university, identifying how students change academic pathways and what that means for time-to-degree.
A third group, student affairs staff and advisors, wants to provide students with personalized information to help them optimize their college experience in terms of:
- supporting the student's individual development,
- improving post-graduation outcomes around jobs and graduate school, and
- lessening time-to-degree and student debt.
These efforts rely on predictive analytics to effectively inform students of the recommended sequence in which to take courses and potential course combinations that could prove too difficult for them to handle successfully.
Table 1 summarizes the motivations and system needs of different stakeholder groups. While we have listed each stakeholder group individually, we believe that there is a great deal of synergy between these stakeholder groups and encourage institutions planning student success initiatives to bring all stakeholders together and look at the problem holistically.
Table 1. Student success stakeholders and their key issues
|
Stakeholder |
Key Questions to Answer |
Required Systems |
|---|---|---|
|
Students |
Is the student on track to successfully complete their plan? Is the student at risk in any course they are presently taking, and are interventions available? Is the student taking advantage of co-curricular resources? Are there ways to adjust the academic plan to improve likely outcomes? |
Student information system (SIS) Learning management system (LMS) Early alert warning system Interactive Planning and Advising for Student Success (IPASS) Co-curricular tracking systems Predictive analytics to identify difficult course combinations or important foundation courses |
|
Instructors |
How do students who pass my class perform in follow-on classes that require this course? How do I measure the impact of pedagogical innovation on student success? How and when do I inform students of appropriate interventions to help them while taking my course? |
LMS Early alert systems to notify at-risk students of appropriate interventions Analytics to inform faculty of how students who took their course do in follow-on courses. Course evaluation systems |
|
Advisors |
What is the student's likelihood of success in this academic plan? How likely is the student to fulfill this plan in the timeframe defined? Is the student taking advantage of appropriate co-curricular opportunities? What courses are likely to be the most difficult? What other academic plans should the student consider? |
Predictive analytics IPASS Advising systems Tools for the visualization of potential pathways Co-curricular pathways for career and graduate school |
|
Academic administrators: provosts, deans, and chairs |
How do we identify course demand in future semesters? How do students adjust their academic plans over time (the flow of students), and do particular patterns mark students who leave the university? How do we optimize course demand and faculty workload? What interventions do we have in place, and are they effective? |
Catalog of interventions (e.g. Student Success Matrix) IPASS (to understand future demand) Business intelligence (reporting) Predictive analytics of future course demand, intervention performance, and student success Visual and interactive graphics |
|
IR and assessment professionals |
How do we assist with academic program evaluation and review? How do we benchmark our institution against our peers? How do we evaluate that student learning objectives are being met? How do we identify at-risk students? How do we assess the effectiveness and execution of intervention strategies? |
Business intelligence (reporting) Predictive analytics Catalog of interventions Systems for data aggregation Visualization tools |
|
Student Affairs professionals |
How do we identify each student's individual development needs? How do we know if our co-curricular interventions support student needs? Are students getting the right interventions at the right time? Are we preparing students for careers and graduate school? How do we identify and intervene with students at risk? |
Career planning services that identify personality strengths and development opportunities Measures of student use of services Catalog of interventions Early alert systems Systems for data aggregation Predictive analytics to evaluate interventions LMS engagement |
One group often missing as an important stakeholder in efforts supporting student success is IT professionals. This might occur as a result of individual units viewing student success systems as primarily local initiatives with limited scope. As a consequence of not including IT, the individual units miss out on the benefits associated with good technology deployment: increased productivity of knowledge workers, integration of disparate systems to create a unified view, and standardization of practice that allows for ongoing adaptation and improvement of the individualized components. Given IT units willing to assist, institutions can begin to think holistically about these efforts.
A Common Model for Student Success
Through the development work of groups such as the PAR Framework [http://www.parframework.org/], Education Advisory Board, and Civitas Learning, a common model for student success has begun to resonate with academic leaders. Any campus pursuing a student success initiative should understand the common model. IT professionals must understand the data flows across different systems in this model to use technology to streamline the collection, processing, and dissemination of information supporting student success.
An institution starting a student success effort and with no existing programs or interventions could revise the model process. In reality, almost all institutions have programs or interventions in place, often for many years, yet they frequently struggle to collect good data to evaluate the efficacy of their efforts. These would include scholar programs, tutoring, summer bridge programs, etc. Recognizing that institutions have existing programs and interventions in place, the common model follows:
- Catalog all existing programs providing interventions at the institution.
- Develop an a priori risk prediction of student success based on available current and historical data.
- Develop tools to measure which students are taking advantage of these interventions.
- Regularly evaluate those interventions to make certain they are effective in supporting student success.
- Look for opportunities to add additional data about students into the system.
- Adjust the risk prediction based on the additional data collected.
- Repeat the process from step 4.
Figure 1 shows a system model for student success that focuses on how campuses should integrate data across systems.
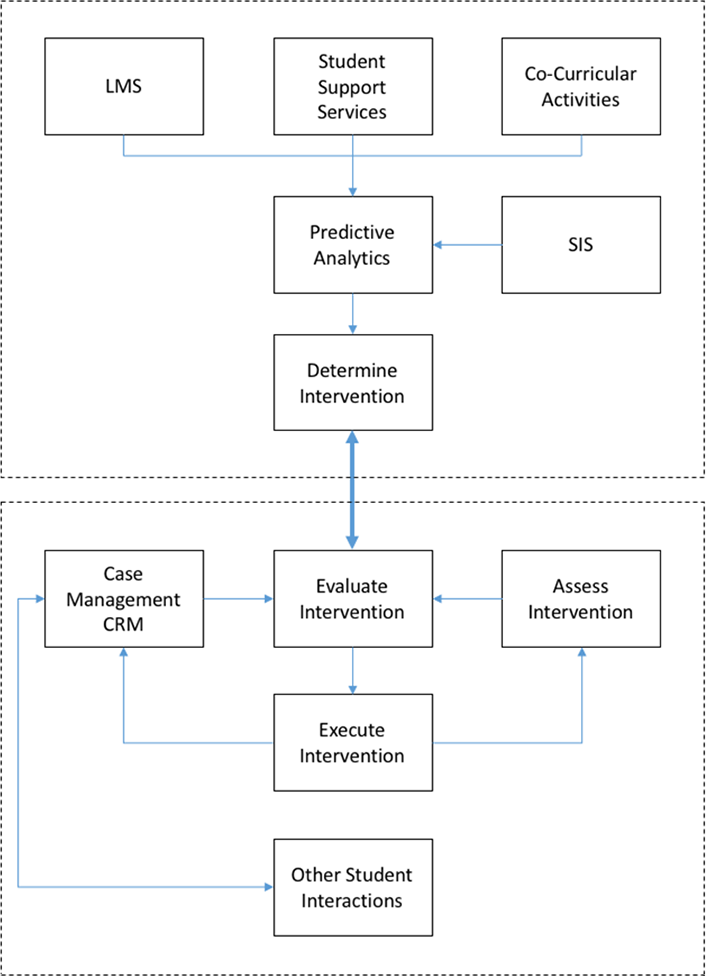
Figure 1. A systems model for student success
The systems model shows the importance of analyzing interventions, but hides the complexities of integrating these systems in a way that makes it possible. The top half of the figure focuses on aggregating data from a variety of source systems, such as the boxes labeled LMS, Student Support Services, Co-curricular Activities, and SIS. These systems provide the data necessary to develop a predictive model and provide business intelligence reporting. Those tools help identify both the students at risk in specific programs and potential student groups in need of interventions. The bottom half of the figure is designed to track student interventions and develop analyses that will assess an intervention's impact in terms of, for example, increasing student graduation rates. This section is useful for leaders who must fund interventions and for staff who must manage the day-to-day work that goes into providing interventions to students.
The top half of figure 1 also includes a box labeled "Determine Intervention," which would include activities such as the early alert system — a proactive mechanism to intervene with students as soon as we know they are at risk. (For more on implementing early alert systems, we encourage you to read "Two Case Studies of Learner Analytics in the University System of Maryland.") Ideally, the early alert system connects with the case management system, which should support campus staff managing interventions. It should provide a holistic view of students and identify the interventions attempted, along with other relevant information regarding actions and communications with students. For many institutions this might constitute a student-focused customer relationship management (CRM) system.
In the bottom half of figure 1 the first goal is to determine whether interventions targeting specific student populations are in fact used by those students. Often, institutions develop targeted interventions for transfer or first-generation students, but the group performing the intervention doesn't limit the students who can take advantage of the intervention. In that case it might turn out that few of the target groups actually use the intervention. Or, the intervention might reach its target population, but not effectively. This might show up when you know that certain interventions work elsewhere in similar circumstances, but don't seem to work at your institution.
Every institution has some unique characteristics based on the students it enrolls, the academic programs it offers, and the interventions in place to help students succeed. As a result, student data must often be integrated from a variety of systems. Creating an aggregate record is necessary to use predictive analytics techniques to identify attributes with strong positive and strong negative correlations to student success.
Using the Model Framework for Student Success
Historically, institutions establish programs to improve student success by implementing a number of interventions that support all students or target specific subgroups. Obviously we can't wait for six years to assess the impact on graduation rate, and most institutions use macro indicators such as first- or second-year retention rate. Although useful, these measurements can miss key indicators of risk. An alternate approach relies on a technique called intervention analysis, which uses advanced statistical techniques to determine whether a specific intervention has an impact.
Intervention analysis requires the following:
- Accurate data on who did and didn't have the intervention
- Documentation of who the intervention targeted and whether it reached the intended group (intervention execution)
- Frequent repetition to regularly assess the intervention
- Knowledge of what, if any, other interventions the student has participated in
With this information, we can use intervention analysis to measure the impact in persistence associated with an individual intervention.
While intervention analysis is a powerful technique, it requires a more systematic approach to tracking and documenting the program interventions with students than most institutions have in place. IT professionals can provide a critical service by implementing systems that can do this across units. Technology is an essential component in successfully supporting intervention analysis, and IT leaders should work with their counterparts on a five-step process:
- Create a catalog of the interventions in place. With expertise in system analysis, IT is well positioned to do this. An excellent model for this is the Student Success Matrix [http://www.parframework.org/ssmx/] developed by the PAR Framework.
- Develop tools for tracking service delivery to students. IT must work with stakeholders to understand how interventions are done and create an effective — but not too burdensome — business process.
- Aggregate the data collected in step 2 into your business intelligence system. If you don't have a business intelligence system, IT can create a database to store this data across interventions.
- Integrate the data from step 3 with other institutional data so that statistical experts can apply intervention analysis on the data collected.
- Using the results in step 4, work with the stakeholders to use the data to improve the intervention, especially in terms of reaching the target audience.
Another aspect that can benefit from IT expertise is that many of the student interventions will likely use software-as-a-service (SaaS) applications, which requires IT expertise to get that data out of the SaaS application and into the business intelligence system (BIS). IT must lend its expertise with managing and aggregating data by creating or purchasing solutions that can do this across the institution and bring a cross-unit perspective to the student success initiative.
Case Study: UMBC Student Success Implementation
UMBC has about 14,000 students. The university's Carnegie classification is high-research, selective, and residential. Between 45 and 50 percent of students graduate in a STEM major, and UMBC is known as one of the most diverse undergraduate institutions in the state. The student success challenges are increasing the six-year graduation rate to 70 percent (from 63.3 percent) and increasing the four-year graduation rate to 50 percent (from 43.6 percent).
UMBC as an institution made a commitment to student success starting back in 2006 when a group of senior administrators began to collaborate on a plan to improve graduation rates. Every unit made student success a priority, and dozens of interventions were created. In 2012, UMBC created an endowment fund, the Hrabowski Innovation Award, to encourage curricular and pedagogical innovation. A recent analysis found that from 2010 to 2016 the six-year graduation rate increased by seven percentage points, from 56 to 63 percent. This is good news; however, missing was a systematic approach to understand exactly what was working.
Over the past two years a broad-based strategic planning effort produced a new strategic plan for the campus. Student success remains a key part of this plan; however, for the university to reach its goals requires a more systematic approach. As a result of conversations that took place during the strategic planning process, the IT department is working with campus stakeholders (see table 1) to redesign IT systems to support student success.
Figure 2 illustrates UMBC's IT systems in place to support student success. At the bottom are the core systems, which include the three ERP modules student, finance, and HR. Above those three systems are the LMS and all SaaS offerings. The student-facing SaaS offerings include housing, parking, student judicial, club sports and intramurals, student organizations, learning resource system, placement testing, service management, and student course evaluations.
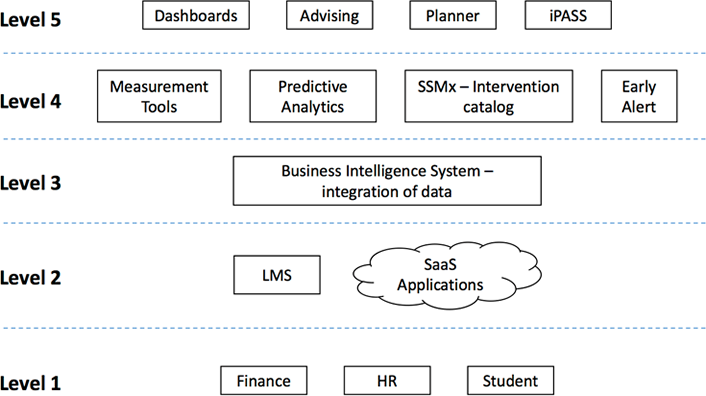
Figure 2. UMBC student success implementation
Level 3 is the university's business intelligence (BI) system, named REX.1 Purchased from a third party in 2006 and now part of Blackboard Analytics, the BI system was designed to take data from UMBC's key source systems — student, finance, HR, and LMS. UMBC developed the expertise to add additional data from other source systems not traditionally captured in ERP systems, and as a result the BI system is the place where the university aggregates and integrates data, especially on the student experience. One of the major efforts underway aims to retrieve important data from student-facing SaaS systems and integrate it into the BI system using application programming interfaces (API) or daily extracts.
The level 4 systems drive student success initiatives. These include an early alert system, measurement and activity tracking tools, predictive analytics, and an intervention catalog. The intervention catalog, named the Student Success Matrix (SSMx), was purchased from PAR, and allows UMBC to track interventions using a common web-based approach across the institution. As part of this effort managers and leaders will receive reports on which interventions are in place at different points in the student lifecycle.
With the interventions identified, IT staff are building activity tracking tools into UMBC's systems for use in identifying which students take advantage of different interventions. Many of these activities are associated with courses, and enrollment in the SIS permits tracking participation; however, for extracurricular efforts IT is working with student affairs to build tools to simplify this effort. Several examples are already implemented:
- Scanning the barcode on the UMBC ID card when requesting a service
- Utilizing IMS Global digital credentials to track co-curricular and applied learning
- Using a SaaS application that does ticketing to see who obtained tickets for activities
All of the data collected in the activity tracking system flows back into the BI system. An early alert system built in 2008 was recently updated to support mobile notifications.
Predictive analytics uses three different approaches. First, UMBC recently signed with Civitas Learning to use Illume Impact for courses and students to measure the impact of interventions in the catalog. Illume Student will provide a student risk score that will be used with the early alert system when significant downward changes occur within a semester; otherwise, it will be integrated into tools provided to students and advisors. Second, UMBC purchased and implemented the EAB Academic Performance System. This tool is used to develop metrics and indexes around the cost of instruction of different academic programs. Third, IR and IT are developing predictions using statistical modeling on specific questions that arise from the academic leadership, usually in the context of setting academic policy.
The final level in figure 2 includes dashboards, advising, planner, and iPASS. These tools use information from the BI system and predictive analytics to present end users with information appropriate to their role.
- iPASS: In beta release, the Interactive Planning and Advising for Student Success, or iPASS, provides students with a visual degree audit where they can quickly identify what requirements they have completed and what they are missing. The iPASS implementation also tracks co-curricular achievements aimed at supporting career readiness or success in graduate school. Both students and advisors use this tool.
- Planner: In development, the multi-semester planner is personalized to each student with the courses sequenced properly to complete their academic goals. A simplified planner was launched in fall 2015, and a more personalized planner is being launched in early 2017. The planner is being designed to ultimately use data generated from Civitas Learning on course combinations that might put the student at risk or to identify courses ahead of time that are known to be difficult and for which the student must allocate more study time. Both students and advisors will use the planner.
- Advising system: In development, this system is being redeveloped for the 2017–2018 academic year. Presently, it provides faculty with a variety of data about the student and allows the advisor to generate advising notes and degree reviews. The new advising system will use the academic planner and iPASS. In addition, IT is working with faculty advisors to understand what information will make advising sessions more productive. Faculty and professional advisors will use the advising system.
- Dashboards: In development, the dashboards are designed to provide academic leaders with indicators covering academic performance. The EAB Academic Performance System indices and reports from the BI system and Civitas Learning will give the provost, deans, and chairs information that is helpful in understanding the academic performance in their department as well as anticipated future demand for courses.
UMBC has benefitted from earlier efforts to build a robust BI system. In developing that system, IT worked closely with IR, the Registrar, Admissions, and Financial Aid to build a culture of using data.2 Today, IT staff are moving beyond managing transactions to using their expertise as system analysts and integration specialists in support of student success. IT staff at all levels work closely with academic affairs and student affairs as a valued and trusted partner. As the CIO, it has been my job to work on developing a shared vision with the other leaders on how IT can assist them in reaching their goals.
University of Arizona Student Success Implementation
UA, one of three state institutions in Arizona, is the designated land-grant institution. Total enrollment is about 43,000 students, with close to 34,000 undergraduate students. UA is a large research institution with roughly $600 million in annual research expenditures. Unusual among large research institutions, UA has a strong access mission related to Arizona residents, which it shares with its sister institutions. Thus it has a diverse student population, and improving student success is a critical part of the UA mission. The institution's size and complexity have a significant effect on the implementation of systems to support student success.
Historically the university has done a number of things to support student success. A predictive analytics function around first-year academic success has been in place for 10 years or more, with regular tuning to reflect the potential changes in preparedness of incoming students. A large number of programs provide a menu of support services to students, including tutoring and counseling of various kinds. Programs have been added, revised, and retired in a continuing effort to provide the services that students need. Many of these programs were implemented as point solutions by the responsible departments, with recordkeeping done locally. Student surveys have been used regularly to understand the views of various subsets of the student population. For several years a Retention Committee has actively focused on persistence, especially first-time, full-time freshman retention. An experimental early alert function was implemented several years ago.
Academic advising is largely administered within the colleges and schools, but there is also a central advising unit called the Advising Resource Center that provides communication, coordination, and advocacy for the advising community. A few years ago a new tool, Smart Planner, was internally developed and implemented to try to help students (with support from advisors) better understand, plan, and track their progress toward degrees. This effort was sponsored jointly by Academic Affairs, Student Affairs and Enrollment Management/Academic Initiatives and Student Success (SAEM/AISS), and IT. But the size and complexity of the hundreds of possible degree paths, along with the large caseload of advisors, has proven more difficult to operationalize than initially thought.
By means of these efforts and programs the metrics around student success have improved. The university is committed to further improvement, and these metrics are now proving to be more stubborn. This has led the institution to step back and then go forward around these basic ideas:
- Better and more fine-grained predictive analytics
- More integrated solutions
- Greater attention to organizational change
Starting about two years ago UA began working with Illume from Civitas Learning to improve predictions around student success as indicated by course completion, persistence, and graduation. Initially this was set up as an experiment. The goal was to integrate information from the student information system (Oracle PeopleSoft Campus Solutions), learning management system (Desire2Learn), and one of the student support systems (TutorTrac, from Redrock Software), and apply sophisticated statistical techniques, aka data science, to make better and more fine-grained predictions. This experiment was successful, and a number of insights were gained and continue to be gained. For example, analysis revealed that non-resident female students in strong academic standing were at significantly increased risk of not persisting from freshman to sophomore year.
In addition, the university wanted a closer look at "curricular flow," which are the paths that students take in declaring and then changing majors on their way to either graduating or leaving the university. This information is delivered via Tableau in UA's BI environment, which is built on Oracle Business Intelligence Enterprise Edition (OBIEE).
The general premise is that if the university can do a better job at predicting, then staff can do a better job at intervening and thus improve UA's student success measures. However, this is not a given, since knowing something doesn't always mean being able to do anything about it. Nevertheless, the university continues to invest in the area of intervention.
Often viewed as a broad category, intervention is fundamentally the attempt to use probabilistic knowledge to do something that in turn makes a difference in the outcome. Typically it would involve a communication of some kind with the student. But the issue, the agent, the timing, the channel, the message, etc., are all potential variables — not to mention the history of previous interventions with that student. Thus there is a need to take an integrated approach to intervention, and to take seriously the issue of assessing which interventions are effective for which students. UA plans to use Illume Impact from Civitas Learning to help in this assessment.
The university is currently experimenting with and/or initially implementing solutions from Civitas Learning that focus on faculty (Inspire for Faculty) and advisors (Inspire for Advisors) as the agents. A partnership with Civitas Learning in this endeavor helps achieve the integration of services seen as necessary. The faculty component is strongly driven by data made available from the LMS and oriented around course completion. The goal is to help faculty identify students who could benefit from an intervention such as a timely communication.
For the larger view of student success UA is focusing on advisors and students and looking to better leverage the advisor/student relationship. Rather than concentrating on a specific new tool, the university will take a more holistic look at the full set of tools and information that advisors do or could use. This project, called "Advising Analytics," was consciously named based on the function performed rather than the software tool(s) used. The project team will attempt to integrate Degree Map from Civitas Learning with other tools already in place such as PeopleSoft Campus Solutions and the UA BI environment built in OBIEE. This effort is just starting.
The Advising Analytics project involves Academic Affairs, University Analytics and Institutional Research (UAIR), IT, and SAEM/AISS. It is both a technical challenge and an organizational change management challenge. Further improvements in student success require not only significant data integration, but significant organizational integration as well. Toward that end UA has combined the IR function and the BI function into a single group that plays an active role in issues of student success, not just reporting.
Future plans include adding data to help make still better predictions. All stakeholders, including the students, will have more complete and more timely information available to them. For example, predictive analytics findings are now being shared with colleges and schools. This could in turn lead to their considering further the interplay of curriculum and student success.
UA's current architecture is shown in figure 3.
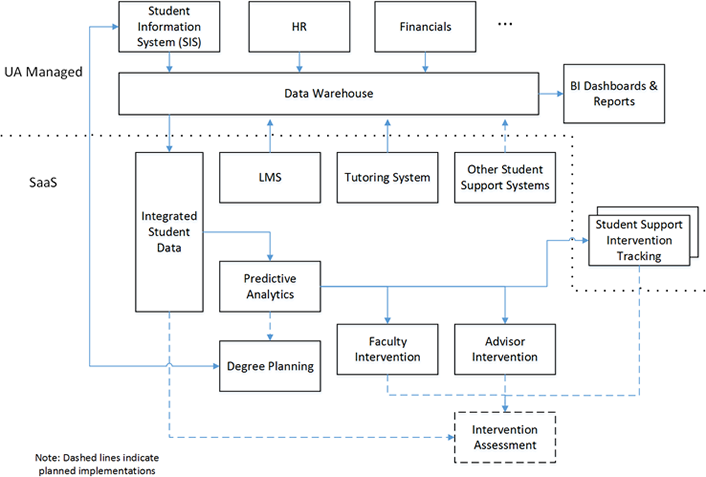
Figure 3. UA's architecture supporting student success
The data warehouse plays a central role in assembling data from disparate sources. Unlike the source systems, the data warehouse provides a degree of normalization and a stable one-stop shop. These sources include the ERP systems, of which the SIS is the most important, the LMS, and a diverse set of student support systems. The tutoring system is included, and others are planned.
Once this information is assembled, further integration and preparation are needed to ready the data for predictive analytics. For example, data is segmented on the basis of what is available, e.g., students with test scores vs. students without test scores. Also, a large number of "features" are derived based on data values. These become part of the integrated student data.
The predictive analytics function then operates on this integrated data. Interventions follow based on those results. This statement hides complexity, however. Much of the university's work with predictive analytics is interactive, with a knowledgeable user driving the Illume tool in an effort to gain insights. It is not really machine learning. UA's approach is to explore in an effort to find useful and often unexpected results, and then verify those results and seek to understand them. The "story" that surfaces influences the approach to intervention.
Intervention typically entails communication or outreach by advisors, faculty, and/or SAEM/AISS professionals. These interventions are tracked, but not in a centralized way at this point. UA is in the early stages of working with a new degree planning tool called Degree Map, which will partially or fully replace the in-house developed Smart Planner tool. Of great interest is bringing to bear the predictive analytics around toxic and synergistic course combinations, for example, in developing the individual student degree path.
Following an intervention, staff will use the intervention assessment tool Illume Impact. This should be significantly faster than previous approaches, which will allow adjusting the intervention strategy on a more timely basis.
The interconnectedness of these components is critical to success and to adapting to changing and expanding requirements.
Lessons Learned
Both of us have been involved in our campus student success efforts for years. While we have documented some successes in the case studies, we also want to acknowledge some challenges and setbacks and share lessons learned along the way:
- Student success will be driven by the senior academic and senior student affairs leaders. Unless they regularly meet with IT leaders, IT may not be involved in the selection and implementation of products. We encourage IT leaders to proactively engage with their counterparts in academic and student affairs and discuss opportunities for furthering student success.
- The breadth and variety of stakeholders in the area of student success should not be underestimated, as documented in table 1. This puts a premium on coordination and communication. IT is in a unique position to see across the entire institution and to champion effective organizational change management.
- Fundamentally the opportunity is to create and support a culture that uses data to advance student success. Many of the programs that exist to support student success rely heavily on interpersonal contact, and staff in these departments may be reticent to take a data-intensive approach. Staff and faculty must understand that using data to improve student success does not diminish the personal connection with students, but helps focus that connection on those students best served by intervention.
- Integration of different data systems requires technical design and support. Collecting and integrating data from a number of different SaaS services already in place to support delivering interventions will require IT expertise to collect and integrate that data into a master data set. IT may have to assist the units to do this effectively.
- Institutional data validation and data quality are important when implementing cloud-based student success systems, which need to interface directly or indirectly with ERP systems. If there are data quality issues inside the ERP systems, they can undermine the usefulness of the results produced. Working closely with the IR team is probably the best way to address these issues.
- Identifying and cataloging the institutional interventions taking place can be a challenge. Asking departments to do this on their own will likely result in a wide variety of documents that are difficult or impossible to integrate. We recommend using a tool such as the student success matrix or developing your own tool to provide for common definitions and use across units.
- Measuring interventions often requires changing business processes to support capturing which students had the intervention. IT can be helpful in developing tools that make this easier to do.
In addition to these issues, two of the most challenging issues facing student success are (1) determining the most appropriate way of using the predictions you generate from the data to improve student outcomes, and (2) determining when and how to share these predictions with the individual student or others who work with the student. These issues require conversations across the institution and need academic and student affairs leaders at the table to facilitate those discussions across stakeholders. We feel that it is important for students to be recognized as stakeholders who should be consulted in these discussions.
Concluding Remarks
With this article we intend to spur conversation within the IT community about how to support student success initiatives on campus. The first premise is that a student success initiative should understand that this effort involves many stakeholders with different needs. To ultimately meet the needs of all stakeholders requires a systemic approach that allows the institution to expand efforts over time. The second premise is that intervention analysis is one approach that should be considered for measuring impact; however, to do this well requires a disciplined approach to documenting the interventions in place and developing business processes to measure who is being served.
As IT and data leaders, we have found working on a student success initiative personally rewarding. If you can help a student complete college, you will have positively affected their life. We hope that readers in IT especially will see student success as an area in which the IT profession has much to add. IT organizations pride themselves on being innovative problem solvers, and this area definitely needs creative thinking. For many institutions, no problem will have a greater impact for your students than student success, and IT needs to step up and join the efforts as a true partner.
Notes
- UMBC purchased a BI system from a company named iStrategy, later bought, and this is now part of Blackboard Analytics.
- Listen to the EDUCAUSE podcast with three UMBC executives.
Jack Suess is vice president of IT and CIO at the University of Maryland, Baltimore County.
Hank Childers is executive director for University Analytics and Institutional Research at the University of Arizona.
© 2016 John J. Suess and Henry A. Childers. The text of this article is licensed under Creative Commons BY 4.0.