
Key Takeaways
- Two of USM's historically black institutions used analytics and institutional data about students to address problems with student recruitment and retention.
- The University of Maryland Eastern Shore has begun taking strategic steps to increase retention and graduation rates for an at-risk student population by using a dashboard that provides actual data as well as targets for key performance indicators specific to admission, retention, and progress toward graduation.
- To support efforts for student retention, Bowie State University implemented the Student Success Monitoring System, which in essence provides a social networking system to support student retention; success of this system depends on a continuous effort for promoting and fostering use of the network by the social actors.
The University System of Maryland (USM) comprises 12 universities (11 degree granting and one research-only) and two regional institutions of higher education. Highly diverse in terms of mission and student demographics, USM offers an excellent test-bed for experimentation in various approaches to common issues in higher education. Here we present two case studies on how two of the USM's historically black institutions have approached using analytics and institutional data about students to address student recruitment and retention:
- The University of Maryland Eastern Shore (UMES)
- Bowie State University (BSU), which was the subject of a recent ECAR Research Bulletin1 (the details of which will not be repeated here)
The experience of BSU serves to compare and contrast with the efforts at UMES.
University of Maryland Eastern Shore
An historically black university and Maryland's 1890 land-grant institution, UMES serves a diverse population of approximately 4,500 students in a rural environment on Maryland's Eastern Shore. The university offers undergraduate degrees in 34 disciplines; 18 graduate degrees, including two professional doctoral degree programs in pharmacy and physical therapy; and five additional research and educational doctoral programs. Of the 4,500 students, 2,200 live on campus, 1,500 live off campus in the surrounding community, and the others commute within a 45-mile region.
UMES has begun taking strategic steps to increase retention and graduation rates for an at-risk student population by helping them overcome significant financial, social, and academic challenges. Of the enrolled students, 93 percent receive financial aid, with over 60 percent receiving Pell Grants. Over 70 percent of the enrolled student population have been attracted to the institution's quiet location from urban or densely populated suburban Maryland regions, while 21 percent come from out of state, and 3.9 percent are international students representing 34 countries. This broad culture of diversity often involves searching for creative ways to help students transition socially into a rural environment. Further, first-generation students make up 53 percent of enrolled students, many of whom benefit from academic support services tailored to ensure successful progress toward degree.
Recently, UMES witnessed a three-year slide in average SAT scores, retention rates, and graduation rates. During this period, the institution began to register larger incoming classes to stabilize enrollment, which led to a shift in balance between upper- and lower-level course offerings. The result was an increase in the number of freshman-level courses offered, many taught by adjunct faculty. Correspondingly, decreased retention rates led to a decrease in the number of upper-level courses being offered and an overall imbalance in course offerings from the freshman to senior levels. In response, UMES acted immediately to increase the number of transfer students to balance out enrollment in upper-level classes. Simultaneously, the institution took steps to increase the quality of incoming students by developing support services. An analytics tool set was developed to generate, in real time, lists of students who might benefit most from the services.
The USM uses annual dashboard indicators related to graduation and retention rates to monitor institutional progress toward an initiative termed "Closing the Achievement Gap."3 Traditional dashboards provide insight into trends on an annual or semester basis; however, these timelines are too long for faculty and staff who need daily or weekly insight into the effectiveness of their student support strategies. A new analytics tool set was developed that allows daily monitoring of progress toward institutional goals.
Microsoft PerformancePoint and Microsoft SQL Server make up the core of UMES' analytic tool sets. The MS SQL Server pulls data from disparate databases (e.g., records from the student information system, admissions, student financials, financial aid, course management, dining services, public safety, and attendance) into a common data cube that is updated nightly. During registration periods, the updates may occur more frequently to balance system and user demands.
UMES leveraged a prior investment in Microsoft SharePoint to use PerformancePoint (Microsoft's business intelligence toolkit) to create and provide access to the new dashboards. The dashboards can be tailored to the roles of end users (e.g., administrators, faculty advisors, or support staff); they provide actual data as well as targets for key performance indicators specific to admission, retention, and progress toward graduation in a convenient format. Many commercially available analytic tools (e.g., Starfish Retention Solutions, GradesFirst) use a student-centered model to track flags or alerts. Typically, alerts arise in two formats: system data automatically generates the first type; faculty, staff, or even the students produce the second type. Once generated, alerts are assigned to the profiles of specific students. Often prioritized by their number and type, the alerts frequently undergo review by advisors or support staff assigned to the students. Collectively, student-support teams work to clear issues or challenges facing their assigned students.
A student-centered model works well when (1) only a small subset of students need support services, (2) a large staff can support the number of students needing help, or (3) the average student needs support in only a few areas. On a small campus, with high percentages of first-generation college goers and financial need, a student-centered model yields a large number of students with multiple flags. This presents a seemingly insurmountable scenario for a comparably small support staff. In response, UMES added a flag-centered model to supplement its efforts. In this flag-centered model, the university develops support services tailored to target specific behaviors that lead to student attrition. Staff members have responsibility for delivering a specific support service that helps to resolve a known flag. Rather than having advisors refer students to them, these staff members have access to a list of students who have been flagged as needing the service provided by that staff member. This allows the staff to use their lists to proactively communicate with students to resolve challenges rather than waiting for referrals. These lists are also "pumped" to Starfish EARLY ALERT as system-defined alerts in a manner similar to that described in the BSU case study below.
Figure 1 shows a sample screenshot from a financial dashboard. This dashboard, used at the beginning of each semester, connects students with specific services designed to help them through the registration and payment process. This screenshot represents the final days before registration closes and the data file is frozen. These dashboards encourage campus-wide participation in the retention effort. Specific staff members with prescribed action plans monitor each indicator if it falls outside the desired range. The live dashboard allows the staff member to click on the number that appears in the "Actual" column to generate a list of students needing assistance, their account balances, and their contact information to streamline the communication process. Collectively, senior staff members monitor the indicators daily to ensure overall progress toward the defined targets.
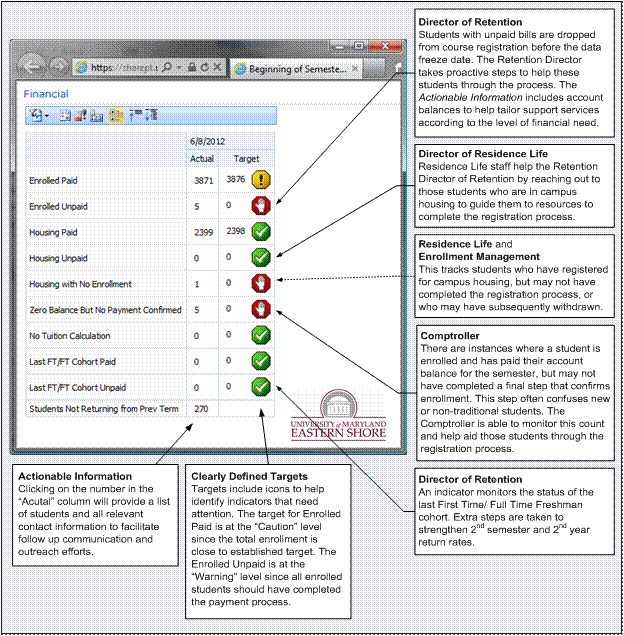
Figure 1. Dashboard connecting students with financial support services
Figure 2 shows a sample spreadsheet produced by clicking on the "Enrolled Unpaid" field. The spreadsheet includes vital information such as student names, IDs, account balances, and contact information to streamline the communication process with students in need of a specific type of support service. Using this alert-centered method, support staff can systematically identify and contact those students for whom they have responsibility. While this sample spreadsheet identifies five students, some lists result in hundreds of students in need of a specific support service. As the numbers needing a specific support service increase, the magnitude of the situation can be easily overlooked when alerts are displayed in a student-centered reporting or display model alone.
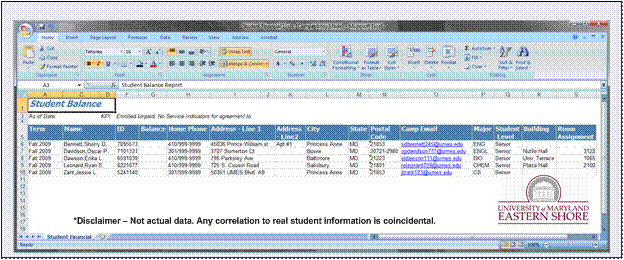
Figure 2. Alert-centered reporting: screenshot of a dashboard-generated spreadsheet
In the past four years, UMES has used analytics to increase average incoming SAT scores by 65 points and transfer-student enrollment by 150 percent, while still maintaining strong enrollment growth and a commitment to first-generation college students (still over 53 percent). In addition, freshman class size has decreased from 1,128 in fall semester 2006 to 748 in fall 2011. This has reduced the number of adjunct faculty needed to teach introductory level classes and the caseload for tutors and support staff responsible for managing the freshman-year experience. During the same period, total transfer-student enrollment increased from 289 in fall semester 2006 to 658 in fall semester 2011, providing better balance between the number of sections of upper- and lower-level courses offered. Although these improvements have not yet affected institutional graduation rates, third- and fourth-year retention rates (precursors to graduation rates) have each increased by 6 percent. See figure 3.
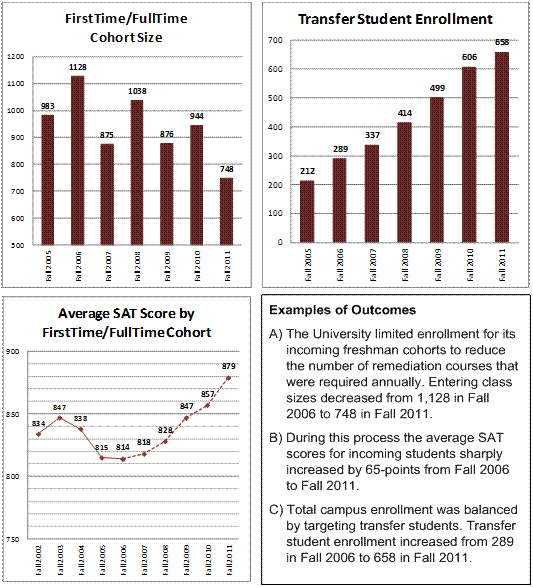
Figure 3. Outcomes for limiting enrollment, increasing SAT scores, and targeting transfer students
One of the lessons learned from this implementation — that analytic tool sets currently provide unprecedented insight into data sets — allows users to disaggregate complex collections in real time. The ability for end users to manage, or slice and dice, data at their desktops means that missing or incorrect entries — once obscure in aggregated reports — become noticeable in the course of daily reviews. To eliminate holes in its data and give end users confidence in the accuracy of institutional data, UMES has implemented dashboards that monitor the integrity of specific data records integral to generating disaggregated data reports (figure 4); the data owners monitor these indicators. Similar to previous examples, clicking on the number in the "Actual" column produces a spreadsheet that includes the Student ID and the noncompliant records so that individuals responsible for maintaining data accuracy can address them.
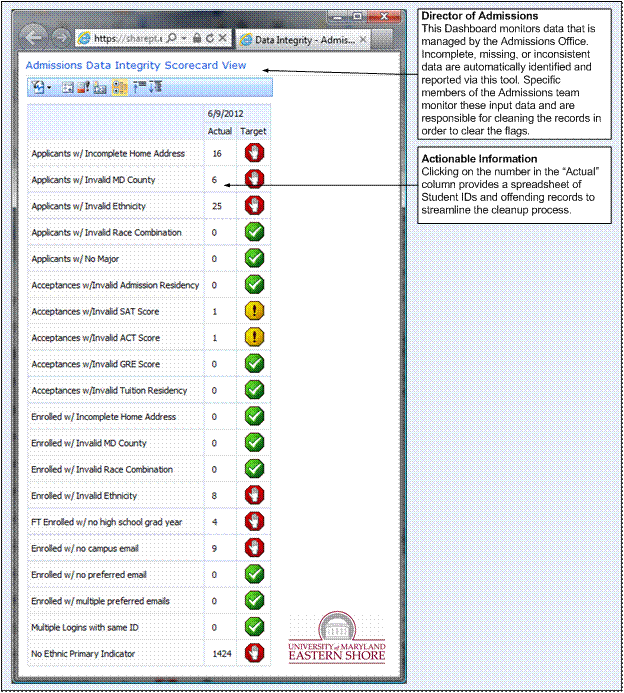
Figure 4. Screenshot of a dashboard used to monitor data-source integrity
Future plans include continuous system maintenance, adding data, and new support services based on classroom, tutoring, dining, and campus event attendance. Staff will attend professional seminars to monitor new and developing system additions or other technologies that will lead to improved retention and graduation rates. Data-processing skill sets are similar to those required for standard institutional data reporting.3
Bowie State University
Another historically black university member of the USM, BSU has a different locale, program portfolio, and student demographic. The entirely urban BSU environment rests at the intersection of Baltimore and Washington, D.C. African Americans make up the majority of the student population, and approximately 64 percent of students are female. The full-time equivalent (FTE) population is similar to that of UMES. The two universities share the problems related to having a significant number of students with disadvantaged backgrounds or first in the family to enter higher education. While BSU did not need to increase the number of transfer students significantly to balance out classes, it did need to deal with a significant number of at-risk entering students. A great majority of new students require developmental courses in their first two years; over several years, the second-year retention rate has declined slightly, currently ranging near 70 percent.4
In this context, a task force on Achievement Gap Reduction Initiatives identified two key problems:
- Tracking students' significant variables during their progress toward graduation to facilitate decision making
- Providing early alerts to resource staff who can intervene to prevent dropouts
The task force defined the clients or users of the system as academic advisors, faculty, tutors, the Athletics Program, university bands, and the students themselves.
As described in the ECAR Research Bulletin,5 BSU used a student-centered approach to address how to apply analytics to improve students' success. The university used a commercial product (Starfish EARLY ALERT/CONNECT) to:
- Capture in real time student data relevant for any serious individual- or group-oriented student-retention effort
- Communicate the flagged issues to students, faculty, advisors, and other support staff
The commercial product is supported by institution-developed middleware that extracts relevant data from the ERP application, PeopleSoft, and the learning management system initially (ANGEL and currently Blackboard Learn). This system also has interfaces to campus e-mail and calendaring systems, which allows easy scheduling of appointments to assist in resolving emerging problems.
Figure 5 represents a top view of the system architecture, dubbed the Student Success Monitoring System (SSMS); it comprises an integration of BSU-designed middleware and vendor components. The squares represent the institution's organizational units, which are sources for different types of data indicated in the corresponding lists. The core elements, in the middle of the picture, are the BSU Data Center, with two major applications, the ERP and LMS. The middleware, the Data Pump or data extractor, operates in two steps: 1) it extracts data from the ERP and LMS databases to form flat files; and 2) it "pumps" these data to the remote Starfish System. The Starfish local client, which is a friendly user interface, has a different "skin" depending on whether the user is a student or a faculty/staff member. Students see their self-profile, their courses, academic services, and service-people or programs available to them, and the communication tools for e-mail, messaging, and scheduling appointments. The system tailors each student interface automatically by the student's major and support group membership. The faculty/staff interface allows the user to see the previous information for the students under the purview of each particular faculty or staff member, e.g., an instructor sees her students, while an advisor sees his group of advisees. In addition, this interface has tools for tracking students, checking attendance, flagging observed problems, conducting brief surveys, and sending automated e-mail messages; it also provides a more powerful scheduling tool.
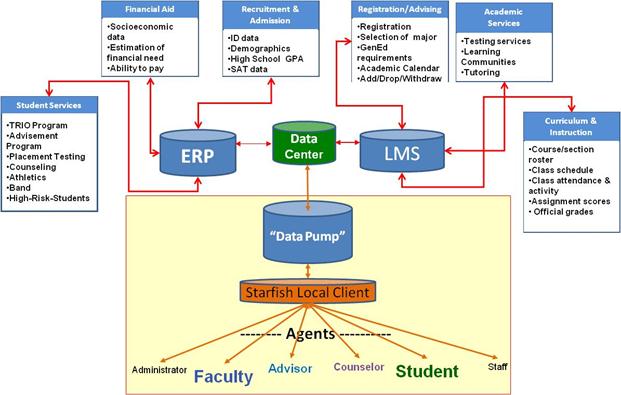
Figure 5. Top view of the SSMS at Bowie State University
The data extracted through middleware from PeopleSoft include demographics, socioeconomic profile, academic program choices, and performance (official grades and attendance); from ANGEL/Blackboard Learn, the extracted data include course rosters, community group membership, and intermediate or formative grades. Once operating, the system generates automatic flags based on criteria such as low grades or attendance problems, while faculty and staff generate other flags based on observation captured through surveys (managed within the system itself) or through a special "Flags Menu." The flagged issues are communicated as appropriate to students, faculty, advisors, and other support staff. The internally developed middleware system also has interfaces to campus e-mail and calendaring systems, which allow the ready scheduling of appointments to assist in resolving emerging problems. Overall, it is an efficient tool for monitoring individual data relevant to student retention and for managing the actions of faculty and staff in response to these data.
A critical challenge for the SSMS involved recruiting a sufficient number of users who would register their profiles in the system and use it to monitor flags and establish communication to respond to flagged issues. To meet this challenge, the project management assumed by the Academic Computing Unit implemented advisory and tutor groups that were automatically generated as communities in the LMS. In addition, Academic Computing conducted an intensive training program based on face-to-face contacts, video clips, and additional web materials. These activities focused on 28 high-enrollment courses (almost all of them having multiple sections) and two key support programs, Advisement Center (six officials), and TRIO (three officials).
Academic Computing regularly maintains training videos for their student tracking and communication system (currently Starfish Early Alert), which are displayed in the unit's website.
One logical question remains: how can a system like this contribute to student retention? The answer involves three major factors:
- First, the university has critical information about each student readily available; if an instructor or staff member wants to obtain this information from the ERP or LMS, it would take half an hour to an hour per student to peruse these systems.
- Second, the early alert features automatically or manually trigger certain flags when an observer finds negative issues on a student, e.g., missed classes and appointments, grades lower than 70 percent, or behavior problems. These issues become known to the network of advisors and counselors involved with each student, so they can take appropriate actions.
- Third, the communication features allow reaching the students for messaging or appointments through the two most visited systems in campus: e-mail and the LMS. One might say that the SSMS in essence provides a social networking system to support efforts for student retention. Therefore, to achieve success it depends largely on the willingness of the social actors to use the network.
The SSMS has seen use at BSU since spring semester 2011, so it is premature to observe changes in the critical dependent variable, measured through variations in the second-year rate of retention. Nevertheless, the number of effective users per term has doubled from 250 to 500, plus the activity indicators of flags reported and communications initiated through the system have risen.6 New retention coordinators hired by the four university colleges constitute a new group of primary users of the SSMS starting in fall 2012; this strategic move means that the retention coordinators have responsibility for the transition of students from general education courses to academic programs. They need a system such as the SMSS to reach students, as it is the only tool available to connect instantly with a dispersed group that does not fall within the boundaries of a specific class or group of classes.
The University has documented every aspect of the theory framework, design, implementation, and training activities of the SSMS, as evidenced in the ECAR Research Bulletin.7 Therefore, another institution could easily replicate such a system in response to the problems of low student engagement and accentuated dropout — problems which occur more frequently than those of us in higher education would wish.
Summary
This article contrasts and compares analytic approaches to common problems at two comparable institutions. In keeping with this intent, it features complementary sets of issues focusing on recruitment and related issues at UMES and retention at BSU. UMES does extend its efforts into student retention, though the details are not explicated in the article. Additionally, UMES is implementing the retention-focused aspects of Starfish Early Alert as BSU has done. Still, there are differences in approach: UMES relies primarily on the flag-centered model, while BSU relies on the student-centered model for interventions. Both institutions have integrated commercial products for data collection, analysis, and response, but BSU has invested in a locally developed analytic engine, while UMES has repurposed an investment in Microsoft's Performance Point to support collection and analysis.
Use of analytics in support of student retention and success is increasingly strategic to UMES and BSU. In an effort to improve access to higher education for minority and economically disadvantaged students, who often have educational deficiencies, both universities have reached out to many at-risk students. The institutions feel an obligation to assure that these students succeed. Analytics provides an important, and previously underutilized, tool set for the institutions to achieve this. These issues are increasingly common in higher education, and the approaches taken should be broadly applicable.
- Fabio J. Chacon, Donald Z. Spicer, and Alirio Valbuena, "Analytics in Support of Student Retention and Success," EDUCAUSE Center for Analysis and Research (ECAR), Research Bulletin (April 10, 2012).
- University System of Maryland (2012), USM Institutional Research Annual Reports, Office of Institutional Research.
- For details of architecture and code, contact Dr. R. G. Forsythe ([email protected]).
- Maryland Higher Education Commission (2012), Retention, Graduation, and Transfer Reports, Office of Research and Policy Analysis.
- Chacon, Spicer, and Valbuena, "Analytics in Support of Student Retention."
- Ibid.
- Ibid.
© 2012 Ronald G. Forsythe, Fabio J. Chacon, Donald Z. Spicer, and Alirio Valbuena. The text of this article is licensed under the Creative Commons Attribution-Noncommercial-No derivative works 3.0 license.