
Key Takeaways
- Facing financial pressure during the great recession and the need to cut budgets, Cornell focused on reducing application support to achieve savings in the IT area.
- IT chose an application portfolio management approach, which led to the Application Streamlining Initiative to tame "application sprawl" across campus.
- ASI had three goals: synchronize IT and business priorities; manage apps as key assets; and reduce total cost of ownership of the apps portfolio.
Dave Koehler, Program Manager, Application Streamlining, Cornell University
The great recession of 2008-2009 caused financial pressure on all higher education institutions. Not immune to the liquidity crisis, Cornell University faced the need for serious cuts in the operating budget, which would affect all divisions. Because Cornell is a highly decentralized institution, academic and administrative IT units as well as the central IT division had to make cuts.
Cornell engaged Bane Consulting to help with the analysis and determination of appropriate cost-reduction strategies. In the IT area, Bane recommended that Cornell make serious reductions in the cost of applications and desktop support. The analysis estimated that Cornell had a spend rate of 28 million dollars annually on application support and needed to reduce that amount by six million dollars. This article documents the method used to identify savings in the application support units.
Recognizing that Bane conducted its analysis using an accounting (or run-rate) perspective, the IT organization decided it needed to understand the magnitude of the problem. Cornell's CIO chose a portfolio management approach to gather information for the decision makers. This led to the Application Streamlining Initiative (ASI) in 2011.
Application Streamlining Initiative Goals
The ASI established three goals:
- Synchronize IT priorities with business priorities
- Manage applications as key institutional assets
- Reduce the total cost of ownership of the applications portfolio
Following a methodology often referred to as "application portfolio management" could meet these goals. It measures application value and cost. Results are often expressed in a two-dimensional table with value and cost as the two axes. When analyzed, applications fall in one of four quadrants (figure 1):
- High Value, Low Cost is the desirable quadrant for an application. Institutions need to maintain and evolve these applications (and learn how they were constructed).
- High Value, High Cost describes an application that is performing its business function successfully but at a high cost. Institutions need to reduce the cost through reengineering or replacement of the application.
- Low Value, Low Cost applications do not have very high value to the institution but also do not cost much, so they are often tolerated.
- Low Value, High Cost applications need to be addressed promptly. They don't provide high business value and have a relatively high cost. They should be retired.
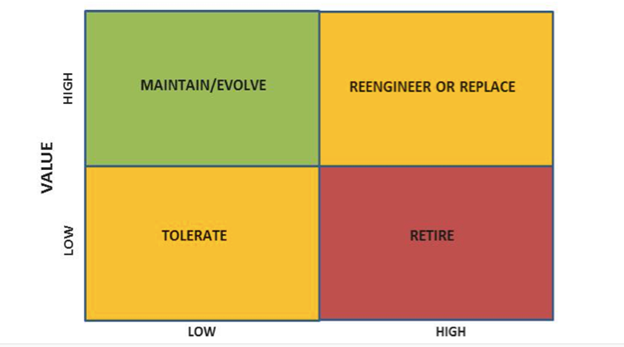
Figure 1. Application portfolio management quadrants
Application Streamlining Phase I
Measuring the value proposition of Cornell's application asset required an inventory of all campus apps. Not just a count of apps, this inventory process measured their cost and value.
To determine the methodology for capturing information about each application, Cornell chose to do a pilot with two units, one academic and one administrative. The College of Agriculture and Life Sciences and the Student and Academic Services units agreed to be in the pilot group.
The chief financial officers of each unit and Cornell's chief information officer served as the steering committee. A program manager from the central IT division (CIT) led a group of participants from each unit. Business analysts from CIT augmented the group.
Value Scoring
This team needed a methodology with which to count and measure application attributes. The first step was to determine a process by which we could convert qualitative data into quantitative information. We knew from experience that when asked, business owners of apps placed a high value on them, so we needed something more objective.
The group decided to measure applications based on six different criteria: uniqueness, risk, campus impact, data of record, utility, and strategy. Each criterion received a weighting factor that, when added to the others, equaled one hundred. To determine the value of each criterion, the business owner needed to match their view of the application with a set of statements designed to establish the value score and thus the app's objective value (see figure 2).
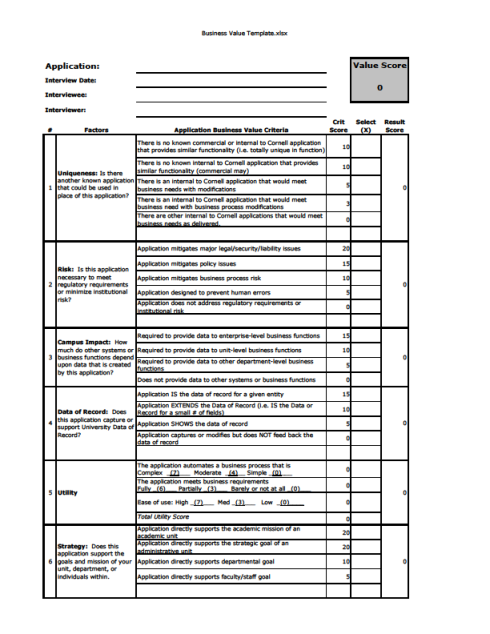
Figure 2. Weighting factors for determining apps' business value
Consider, for example, the measurement for application risk. In this case, risk to the institution was determined as if the application did not exist. The business owner had to choose between the following:
- Application mitigates legal or security risk
- Application mitigates policy risk
- Application mitigates business process risk
- Application reduces the chance for human errors
- Application does not mitigate any risk
Business analysts interviewed the business owners to gather an understanding of the applications and their various aspects of value. They asked the business owners to pick a statement that best matched their understanding of the application's functionality, without telling them the score assigned to each statement. After completion of the interview, the business analyst would complete the interview documentation and the spreadsheet used to score the application, which then were shared with the business owner for confirmation of correctness.
Adding the scores for each of the six criteria produced a value score for each application. Purposefully, the score fell between 0 and 100.
Cost Scoring
The team felt that the technical staff from each unit could determine costs. The categories required for the cost calculation were hardware, software, operations and maintenance, and labor. We chose to capture actual yearly costs and a calculated normalized number that would represent the size of the cost. This calculation was also designed to fit into the 0 to 100 scale.
A spreadsheet assigned a score to each of the actual costs determined by technical staff. The spreadsheet then determined the overall cost score.
Reporting
The pilot team tested several approaches to presenting the information to the chief financial representatives to facilitate complete understanding. Clearly, a list of applications with their business value and cost scores was available. However, a more graphical presentation also seemed in order.
Application Portfolio Management methodologies suggest a scatter diagram with four quadrants that describe the relationship between cost and value. When we tried this, the applications tended to group in the higher value areas. That is, our average business value exceeded 50 for most units.
Another approach involved showing the business value vs. cost for all applications, which were scored using a bar chart or stacked bar chart. This was helpful, but not exactly what we needed.
We decided to calculate the ratio of business value to cost and plot that as an overlay on the chart. When we sorted the application values from high to low, we had the presentation we considered most effective (see figure 3). On the left side of the chart, we had applications with the highest value in relationship to cost. On the right side we showed the applications that had the lowest value in relationship to cost. The CFOs could easily tell that they should learn more about the applications on the left side to determine best practices. They also knew that they had to address the applications on the right side to reduce costs or retire the applications.
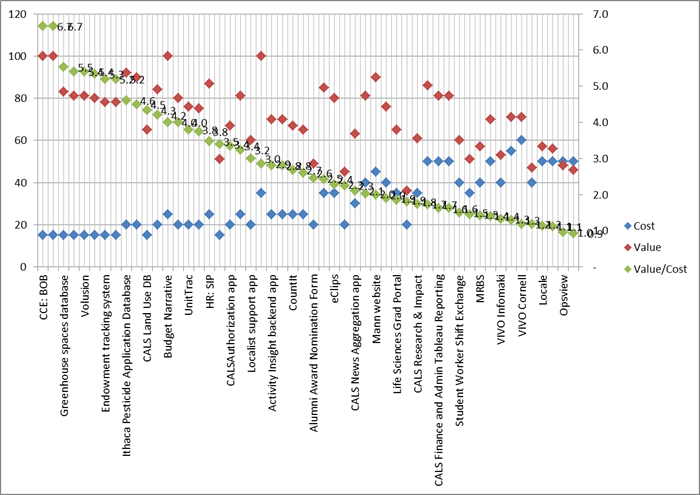
Figure 3. Chart of application value vs. cost (College of Agriculture and Life Sciences)
Pilot Completion
We presented our findings for the two units to the CFOs of those units and the CIO. They found the information informative, realizing that they never had known all of the apps in their portfolio. Before this project, they had no good way to do an objective evaluation of their apps.
The CFOs recommended asking for additional information when we released the approach to the campus. They wanted to be able to find "like applications" in other units. We decided that we would capture "primary function" and "secondary function" for each application.
Campus Rollout
Armed with CFO and CIO approval of the results, we began to develop the materials and communication strategies for rolling the methodology out to the campus. We identified 28 distinct units that needed to identify the cost and value of their applications.
The working group for engaging the entire campus consisted of two business analysts, two IT directors in phased retirement, and one project manager. Of course, everyone in the group had their "day jobs," so the average time spent on the project amounted to approximately 10 hours per week.
This group developed the spreadsheets, interview notes, and instructions for campus participants. The steering committee contained the CFOs of each unit. We did not have meetings specifically for this group, but we did schedule time slots on their regular monthly meetings when we needed their guidance.
The CFOs identified the technical manager to take the lead for their units. We set up two e-mail lists for the sponsors and for the technical leaders. E-mail became our primary communication mechanism for this large group of stakeholders.
The working group developed a process map to show everyone their responsibility for their unit (figure 4). It contained a functional (business value) track and a technical (cost) track.
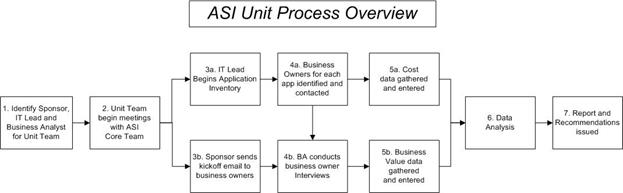
Figure 4. Process map
Business Analysts
We determined that we would not ask customers to evaluate the value of their specific applications. We knew that we could not depend on consistency of results using a self-service approach. Business analysts became critical in determining business value.
Our working group included two business analysts. We assigned the two phased retiree directors the role of business analyst as well. Each of the four was assigned a group of units as their responsibility. This was the most labor-intensive part of the project.
Units were asked to contribute a list of their applications, usually provided by the unit's technical leader. Business analysts had to solicit information from the financial and technical leads to determine the business owners of each application in the unit.
Interviews were scheduled with each of the business owners. Often, a business owner had more than one application, which helped move the process along more quickly. The business analyst came to these meetings with copies of interview questions and blank business value templates. During the meeting, the process was described, the interview questions asked, and the answers recorded. At the end of the meeting the business analyst completed the value template with the business owner's help. By that time, it was much easier to identify which of the statements on the template matched reality.
As a follow up, the business analyst completed an electronic copy of the template and shared it with the business owner to get their approval of the accuracy. This template calculated the business value score for each application.
Typically, we allotted one hour for a business value scoring meeting. If the business owner had several applications, the learning happened quickly, and we could do three or more in an hour and a half.
What Qualifies as an Application?
A key consideration for including applications to score was whether it truly was an application. We decided, by principle, that it was an application if it stored and retrieved data. We chose to exclude applications created using personal productivity products like Microsoft Word or Excel. We did expect to include applications in Access or FileMaker.
Our part-time project manager was responsible for driving the project to completion. He kept a scorecard for the status of each unit. Periodically, it was presented to the sponsor's group. It created some peer pressure that helped get the stragglers moving forward.
We completed 28 units in six months, capturing over 1,100 applications in our inventory and scoring more than 700 of them. (We decided that it was not worth scoring applications costing less than $500 per year.)
Project Completion
We saved all of the Excel templates that captured the application information by unit. We also created a master data spreadsheet that allowed technical staff to enter their information and automatically compute the application score. From this master spreadsheet we produced three graphs to aid the unit staff in prioritizing their plan of attack. As mentioned, the ratio chart was the most valuable visual representation of the information captured.
The sponsors and technical leaders received the results of their application portfolio analysis. We also asked the technical leaders to create a document that described their strategy, going forward, to reduce the total cost of ownership of their application portfolio.
Phase I Success
As result of the information captured and distributed we achieved two goals. First, the sponsors (CFOs) had a clear picture of their application portfolio, including relative value and cost. Second, we had action plans to reduce the total cost of ownership of those portfolios.
We have anecdotal evidence from units of their results. One unit discontinued over 100 applications. Another unit, recognizing the value of some expensive applications, decided to re-platform their costlier applications to reduce the cost. Typically, this is done by decommissioning a server in favor of a virtualized service. It can also be done by replacing software that was difficult and costly to maintain.
One unexpected benefit arose when a unit needed to create an application. Rather than start by coding a new app, they examined the various application inventories and found an application in another academic unit that performed a similar function. After negotiation, they received the application and modified it for their own business purpose. This might not have reduced TCO, but it did reduce the cost of application development for a valuable unit application.
We closed out the project by holding a meeting with the technical leaders. They shared their application portfolio goals with the rest of the technical leaders and offered suggestions for future phases of the project.
Phase II: Consolidation
Recall that the CFOs from the pilot group hoped we could capture enough information to find similar applications within the 28 units. We had added two fields to our data capture requirements, the primary and secondary functional purposes, that were used to accomplish this goal. A functional purpose would align with major application categories like Human Resources or Finance (figure 5).
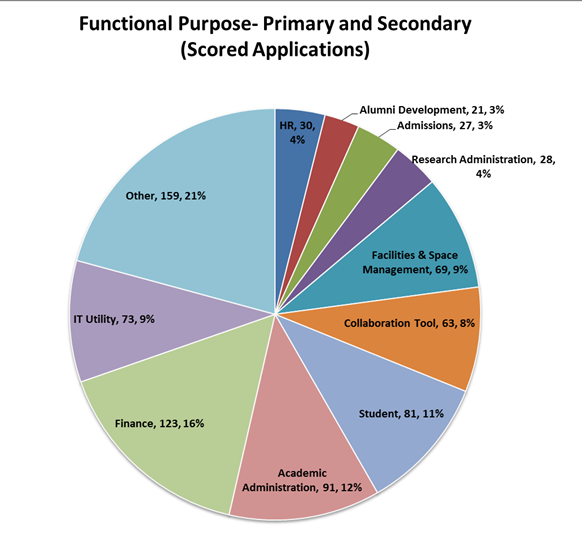
Figure 5. Functional purposes aligned with application categories
The second, or consolidated, phase aimed to find the most likely overlap applications. We determined this in several ways. First, we did a search of all of the inventories by functional purpose and sorted the applications by this attribute. Second, we read through all of the unit reports to look for hints of overlap. Third, we solicited feedback from functional and technical leaders.
We created a Consolidation Framework that allowed us to list the most likely candidates. We decided to weight them by Cost Savings, Motivated Units (who wanted to work on consolidation as a strategy), Alignment with IT Strategic Plan, and Alignment with Business Strategy.
When we assembled the top eight candidates, we created a Qualtrics survey for the sponsors and technical leaders. They were asked to rate the likely value of pursuing consolidation projects in the domains listed. From that survey, we got a prioritization of importance of the various weighting factors (table 1).
Table 1. Consolidation framework
|
Short Title |
Initial Thinking |
HIGH COST SAVINGS |
Motivated Units with the capacity |
Consideration of existing IT strategy ("Fluffy Test") eg. SOA |
Consideration of existing/desired business strategy |
Total |
Status |
|---|---|---|---|---|---|---|---|
|
Document Management |
Sorely needed. Big bang for big buck. Lots of energy around campus for this |
5.47 |
5.67 |
7.22 |
7.83 |
26.19 |
Discovery ongoing |
|
Archival Solutions (for historical data) |
Possible Candidate, probably not low hanging fruit, but should be evaluated as possible. |
4.00 |
4.56 |
5.69 |
6.69 |
20.94 |
Discovery pending completion of Doc Mgmt |
|
Project Management |
Effort tracking, Task Management, simple WBS, capture of effort against work (Simple is good) |
3.78 |
4.11 |
5.94 |
6.11 |
19.94 |
Unanet, MS Project Server |
|
Lab Management Tools |
Lots of them, with lots of overlap. |
3.00 |
4.40 |
5.80 |
6.67 |
19.87 |
Clare van den Blink leading group |
|
CRM System/Event Management (ILR willing to share theirs)/ Membership Management/ Dues Collection |
CRM/ Membership Management/ Event Management seem similar. Consider collapsing. |
2.06 |
3.82 |
4.47 |
5.59 |
15.94 |
Discovery scheduled |
|
Access Control Tools/Key Access |
Should consolidate on a COTS version (Weill) |
2.00 |
2.71 |
5.21 |
5.21 |
15.14 |
Weill hall solution |
|
Survey Tools |
We already feel like we have an offering, need to come up with a way to get folks to consider turning off their versions/ methods |
2.27 |
2.67 |
4.87 |
5.20 |
15.00 |
Qualtrics, SRI |
|
ELM (Electronic Learning Management) |
Good candidate. Could easily show savings. |
1.69 |
2.41 |
4.18 |
5.18 |
13.45 |
Discovery ongoing; led by HR with PPM involvement |
Consolidation Recommendations
We chose the eight top-priority application areas for further study and recommended three highly-rated application areas to enter the capital funding process: document management, archival storage, and customer relationship management. For the remaining five we published recommendations on an approach to reduce costs immediately: survey tools, learning management, project management, lab management, and access control.
One example recommendation regarding survey tools advised the campus to use the Qualtrics product, for which we had an enterprise site license, which could replace a number of local products or homegrown solutions identified in the inventory. Many of the sponsors and technical leaders did not know of the product's availability for institutional use.
As a result of the ASI, two of the recommended capital projects received funding: document management and customer relationship management. The archival storage project was included within the scope of document management. As a result of the document management project, our campus selected ImageNow as the enterprise document management system. For the CRM project, a business case was completed to determine the strategy. The campus was not interested in an ERP implementation. Units have gravitated to SalesForce as the de facto standard.
Refreshing the Inventory
The initial ASI project took place in 2012. An early phase I recommendation was to create a database to host the data and allow for modern searching and retrieval software. With the knowledge that we wanted a refresh in 2014, we decided to create the database in the fall of 2013. Rather than build it internally, we decided to try several things that were relatively new to Cornell. The first was alternative sourcing using Deloitte as an offshore vendor. The second was application development in SharePoint. We wanted to learn more about both of these approaches.
Deloitte has a competency center focused on SharePoint. We received a proposal, negotiated a contract, and began work in September 2013. The database was created and loaded with copies of our Excel information by November 2013.
We then announced the ASI inventory refresh, which was completed in the spring of 2014. Each unit had access to update only their information, but could search and view the entire database of application information.
Epilogue
The campus viewed the ASI as a successful project. Campus leaders had access to information about the value of their portfolio of applications and could act to reduce the TCO in each unit. The consolidation phase identified application overlaps on campus, filled some gaps on enterprise functionality with document management and customer relationship management, and offered the campus information about key central services that could obviate the need for independent apps. Converting information from Excel spreadsheets to a SharePoint database allowed searching and refreshing of information.
Several key decisions enabled the project's success:
- First, we enlisted the support of the unit leaders to help make critical decisions.
- Second, we provided business analysts to interview business owners to determine business value.
- Third, we used a project scorecard to track progress and create peer pressure to complete all of the units.
For more information on the project and to gain access to various project artifacts, access the ASI project site [http://www.cio.cornell.edu/planning-governance/it-projects/administrative-streamlining-initiatives/application-streamlining-asi].
© 2015 David W. Koehler. The text of this EDUCAUSE Review article is licensed under the Creative Commons Attribution 4.0 license.