
Key Takeaways
- To address the common quality-assurance problem of key performance indicators that don't reflect client experiences, Yale University's Information Technology Services formulated the four rights (4Rs) approach to Metric System Design.
- The 4Rs focus on measuring the right things in the right way and taking the right actions at the right time.
- Client expectations are key to this approach, so to determine those expectations, ITS gathered more than 30 hours of focus group video from major stakeholder groups, as well as conducting random interviews with student, faculty, and business partners on campus.
When annual service satisfaction survey scores for students, faculty, and employees is less than 50 percent and descending, significant change and process improvement are required. This was the challenge facing my manager, Yale University CIO Len Peters, and the impetus for a new metric design and service improvement plan. This case study shares one of the initiatives implemented to address this challenge.
Identifying the Problem
The classic academic "4Rs" are reading, writing, arithmetic, and recess. However, in Yale University's Information Technology Services (ITS) we've redefined the 4Rs to address a common quality-assurance problem: key performance indicators (KPIs) and scorecards often fail to accurately reflect the ITS experiences of our clients, which include students, faculty, alumni, employees, business partners, and other stakeholders.
As an example, imagine this scenario: The ITS help desk reports a call resolution rate of 98 percent, with a service target of 85 percent — so the actual performance is 13 percent better than target. However, 35 percent of all calls are abandoned after an average wait time of four minutes. Reporting only the incident-resolution KPI — without understanding its relationship with call abandonment and call wait time — could lead a manager to falsely conclude that no incident management improvement was needed.
As this scenario illustrates, if the relationship between operational, or operations-centric, KPIs and critical-to-satisfaction, or client-centric, KPIs is not transparent, understood, and integrated, the measurement system will fail to meet its quality-assurance objective. To remedy the discrepancy and facilitate the design of a more integrated reporting and management system, ITS established the four rights (4Rs):
- Measuring the right things
- Measuring the right way
- Taking the right actions
- Acting at the right time
In addition to the 4Rs, Peters added four operational imperatives: that our metric system design (MSD) produce reports that are easy to use, easy to understand, valid, and timely, and that KPIs align with the university and department strategic objectives.
Identifying Client Needs
Answering a simple service question — "What do our clients expect from ITS?" — had a profound impact on our MSD. We discovered that our managers had a plethora of data and reports, yet little actionable information. That is, they had a lot of data about a lot of things, but not necessarily the right things. So, ITS's first challenge was to objectively determine what our community needed and use that data to develop the right metric assessing ITS's capability to meet the right requirements. This was a crucial step, because if we failed to identify client expectations correctly, the MSD would fail to measure the right things. Representative comments include the following:
Professor X: "IT Management spends too much time and effort measuring quantity of things and not quality of service."
Manager X: "We generate over 1,200 Crystal and Brio reports each month, but overall performance is getting worse."
Manager Z: "I provide the report because I'm required to do so, but I don't see any actual value or management doing anything with the data."
As Yogi Berra reportedly put it, "If you don't know where you're going, you'll probably end up somewhere else." And, in point of fact, that was exactly where ITS was when we began this project. We either didn't know or misunderstood many of our community's critical needs, which resulted in a significant discrepancy between what we measured and what our faculty, staff, and students expected and experienced.
With the support of the CIO and Yale's Provost, ITS (specifically the Community Satisfaction Focus Group Committee) launched an initiative to collect critical-to-satisfaction data from one diversified group and nine specific community groups. First, we collected and analyzed approximately 30 hours of video-recorded focus group material from the following nine client groups:
- Yale undergraduates
- Graduate students and professional schools
- Faculty, arts and humanities
- Faculty, science and engineering
- Faculty, life sciences and medical
- International
- Business office and general administration
- ITS staff
- ITS partners
Second, the Focus Group Committee gathered data from a diversified client group by setting up a survey station in a campus area with high foot traffic and interviewing anyone who happened by and was willing to participate in a short interview that would be video recorded.
Initially, the mood of the ITS staff was somber as we evaluated the survey results. Objective analysis of the data made it unequivocally clear that our service performance was not acceptable and had to be improved. Fortunately, our CIO did not shy away from the obvious, although somewhat disappointing, insights the data provided; rather, he embraced the opportunity for change and made client service and satisfaction his top priority.
The results of analyzing the data collected offered a guide for our MSD and subsequent service-improvement action plans. ITS managers having access to the unedited raw video and topical editing of the data (segmenting comments by client type and grouping by affinity topics) provided a change-management benefit as well. Change is difficult to accept when people don't think it is required. However, when you can directly see and hear your clients say your service performance is unacceptable, assumptions are challenged, the need for change becomes apparent, and inertia dissolves, replaced by energetic support for change. Two managers responded to the client feedback data as follows:
Manager X: "I had no idea faculty felt that way about our service. I thought we were meeting their needs, but it's clear from these videos that we are not."
Manager Z: "No one has ever told me directly that they were so unhappy with our web service."
Further external review and analysis of client satisfaction studies and IT service performance best practices also answered a frequently asked MSD question: "How do I know if I'm measuring the right things and if I'm measuring them in the right way?"
From Objectives to Metrics
Our internal analysis of existing data and reports showed that too few, too many, or badly designed metrics and reports were producing undesired results and confusion. A good MSD measures things that really matter and lets you draw valid inferences from the data. So, our next step was to identify and vet the few critical community satisfaction and operational metrics from the useful many — and then to assure that we were measuring them right.
The results of our analysis clearly showed that, to achieve our ITS strategic objectives, we needed to measure:
- Client satisfaction
- Financial performance
- Service quality
- Service cost
- Compliance
We also recognized the importance of establishing performance benchmarks to measure improvement, trends, and KPI relationships. Unfortunately, we often found that historical metrics did not exist or were inaccurate or inconsistent. So, we decided to establish new metrics and KPIs and — rather than integrate the historical data with the new data — benchmark current capability utilizing the new MSD. Our goals were to use the MSD to facilitate process and service stability and then continuously improve capability based on the new data. Figure 1 shows the integration model.
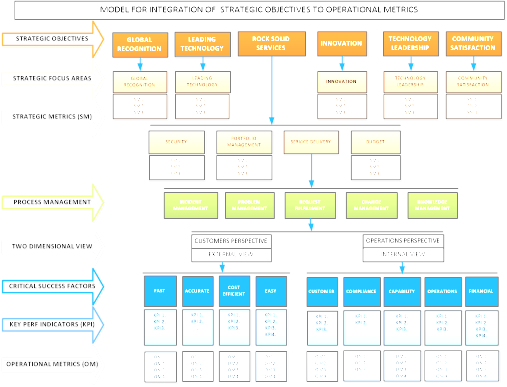
Figure 1. From strategic objectives to operational metrics
We learned from the work of Capers Jones and Associates that the best way to decide what to measure is to find out what industry leaders measure, and then measure the same things.1 Jones recommends using metrics in four categories: Quality Measures, Productivity, Schedule Measures, and Business and Corporate Measures.
Many web articles and process improvement/quality assurance webinars strongly suggested that organizations with lower MSD maturity should avoid doing too much, too soon. Instead, they should choose a few useful metrics and apply them across the board. Then, as experience and confidence are gained, more metrics can be added, and those that fail to add significant value can be removed.
We were determined to avoid the gravitational pull of measuring things just because we could and focused instead on only the metrics that matter. Through the work of Robert Austin,2 we became aware of two main uses of measures — informational and motivational — as well as of the risk of unintentionally mixing the two.
Informational measures provide process and product insight and serve as a basis for decision-making; they should not affect behavior. These measures have two kinds of problems, however. First, their numbers might not be clearly understood if the implicit model between the numbers and the reality is not clearly understood. Second, not all numbers can be meaningfully averaged or otherwise combined or manipulated.
Motivational measures promote greater effort in pursuing organizational goals and should affect behavior. The main problem with motivational measures is that they can become dysfunctional — that is, they can motivate undesired behaviors. As Austin put it, "Dysfunction occurs when the validity of information … is compromised by the unintended reactions of those being measured, aka the Risk of Unintended Consequences."3
Finally, from our own work, we found that the question of what to measure can be succinctly framed within two mnemonics that address two essential MSD perspectives. The first is FACE, which lets analysts map operational metrics to customer expectations and facilitates comparative analysis across business functions:
- Fast: clients want their ITS needs met as quickly as possible (speed)
- Accurate: clients want IT services that meet or exceed their specifications (quality)
- Cost efficient: clients want IT services at the best price possible (value)
- Easy: clients want IT services that are simple to access and to use (simplicity)
FACE addresses client-focused metrics and values. The second mnemonic, Captain Calling Officers For Review, addresses the five key categories of operations metrics/KPIs:
- Customer/contract (including service-level agreements, or SLAs)
- Capacity/capability
- Operational
- Financial
- Regulatory (security and compliance).
We determined that our MSD's value proposition or success criteria would be based on its ability to help each service manager and process owner objectively answer the following four questions from both the client and operations perspective:
- How is my service performing?
- How do I know?
- Where must it improve?
- Where can it improve?
Implementation
Having completed our MSD analysis, design, and change management plan, we implemented the MSD on April 14, 2012. The metrics and KPIs we selected were based on our two mnemonic models, six ITS strategic objectives, and SMART (Specific, Measurable, Aligned, Realistic, and Timed) guidlines:
- Community satisfaction: 90 percent or better score on biannual Yale Technology Survey
- Financial management: Revenues and expenses meet FY established targets
- Rock-solid service: All Core ITS services meet service level agreements (SLAs), and average point of delivery (POD) scores exceed 89 percent client satisfaction
- Staff development: Job performance evaluations completed on schedule, approved staff training initiatives met, and employee satisfaction scores exceed 89 percent based on the biannual Yale Technology Survey
- Technology leadership: ITS service innovation objectives met
- Global recognition: ITS external publication and knowledge sharing objectives met
Successful Implementation of the 4Rs model required critical focus on four pre-implementation steps. These steps are the gyroscope of the MSD:
- Seek to objectively understand your community's needs and wants (survey and data analysis).
- Establish service baseline performance and identify performance gaps and process improvement opportunities.
- Establish process improvement teams responsible for improving ITS performance in the identified deficit areas.
- Define and agree upon your metrics and key performance indicators that will be used to assess improvement and goal attainment.
In working through the survey results and the planning, development, and implementation of the 4Rs model, we learned several things:
- The honest and unfiltered "voice of the client" is a powerful tool for change.
- Focus group participants must feel confident that their candid feedback will be protected and shared only as they have agreed.
- A problem must be well defined and understood before it can be effectively resolved.
- One cannot effectively and efficiently manage services that have no measures of performance
- Keep your metric design simple: focus on the critical few metrics and KPIs rather than the useful many.
Yale Campus Technology Service (CTS) Senior Director Jeff Capuano provides operational validation for these learnings: "Establishing service performance goals [is] important, but defining the right metrics and KPIs, measuring them right, and providing the right level of transparency to clients and staff is critical to the provision of world-class service."
Initial Results
By our initial estimates, we expected the MSD to take at least three years to reach full process maturity and deliver all expected benefits. ITS provides more than 58 business services, and because IT client interaction and perception are so heavily influenced by help desk and DSP performance, metric system design efforts began there with incident management followed by problem management, change management, request management, and knowledge management. We will systematically take the same approach for the remaining services and all future services. As shown in figure 2, we are seeing excellent results at just one year into our three-year plan.

Figure 2. Example of service desk improvements
Figure 3 shows our MSD maturity plan. By all indications we are on schedule and making good progress. However, with any new initiative there will be early adopters, wait and see-ers, and resisters, both passive and overt. Going into the process we fully understood those challenges and are leveraging the success of the early adopters to encourage participation by those staff less receptive to change.

Figure 3. Timeline for SMS maturity
Despite the newness of our initiative, we've already seeing positive signs:
- Organizational recognition and acceptance that service performance metrics are needed and useful
- Significantly improved satisfaction scores for help desk service and incident management
- Improved client communication and IT service transparency
- More fact-based decisions and less reliance on anecdotal information
- Better utilization of Tier I and Tier II resources (lower cost per incident and higher quality)
It was surprising to see how significantly and quickly some processes improved and sustained their improvement simply by providing staff with immediate feedback and transparency. We achieved this through the 4Rs — measuring the right things right and focusing on the right actions at the right time. We intend to continuously monitor our IT service performance metrics and seek feedback from our clients through biannual and point-of-delivery surveys as well as focus groups. Our approach is designed to be a continual process: pause, collect, analyze, improve, and sustain.
Conclusions
Our metric system design experience has taught us that design, implementation, and maintenance of a new measurement system goes far beyond just defining new metrics, reports, and displays of isolated data. Real, sustained value requires a well-thought-out plan and design that take into account the management challenges involved with changing the way an organization's service performance is measured and evaluated. Realization of all potential benefits will take time, iteration, and an effective change-management process. Buy-in by those who will use the MSD to guide and improve performance is essential. We are confident that the 4Rs of metric design will help our managers achieve higher levels of performance and process improvement than before implementation of the new model.
- Capers Jones, "Focus on Industry Leadership," Applied Software Measurement, McGraw Hill, 2008.
- Robert D. Austin, Measuring and Managing Performance in Organizations, Dorset House Publishing, 1996.
- Peter Brooks, Metrics for IT Service Management, Van Haren Publishing, 2010.
- Timothy K. Perkins, "The Nine-Step Metrics Program," Crosstalk, Feb. 2001, pp. 16–18.
- Robert E. Park, Goal-Driven Software Measurement—A Guidebook, CMU/SEI-96-HB-002, Software Engineering Institute, Carnegie Melon University, 1996.
- William Florac, Robert E. Park, and Anita Carleton, Practical Software Measurement: Measuring for Process Management and Improvement, CMU/SEI-97-HB-003, Software Engineering Institute, Carnegie-Mellon University, 1997.
© 2013 John Rick Smith. The text of this EDUCAUSE Review Online article is licensed under the Creative Commons Attribution-Noncommercial-No derivative works 3.0 license.