
Key Takeaways
- The transition from a homegrown, stand-alone legacy system to a commercial enterprise resource system revealed the inadequacy of the ERP's standard reports for one community college's needs.
- Priority was given to developing reports essential to meeting state and federal mandated reporting requirements, and North Shore Community College gradually acquired an internal library of complex, customized, original reports created mostly by staff programmers.
- The transition to a new operational data store and enterprise data warehouse has positioned the college well for the future in terms of examining trends and indicators internally and reporting on state and federal metrics externally.
One of 15 Massachusetts Public Community Colleges, North Shore Community College has two credit campus locations and a third noncredit workforce institute. The college serves more than 11,000 credit students annually, plus another 5,000 noncredit students. Like many other higher education institutions, NSCC converted to Sungard HE (now Ellucian) Banner Enterprise Resource System in the mid-1990s. Prior to this, the college had a legacy homegrown, stand-alone registration system. The conversion was comprehensive — our management team elected to bring 30 years of student data (from the founding of the college in 1965) into the system. Similar to most colleges, we quickly learned that although Banner was a great system for transaction data, the options for extracting that data were considerably less plentiful. Because we were one of the first community colleges to use Banner, some of our forms and tables might best be described as "innovative" or "unusual." Although Banner and its subsequent upgrades often came with some "canned" reports, our ability to use them was limited. We relied heavily on our Information Systems (IS) department's lean staff of overburdened programmers to either adapt canned reports or, more usually, to write complex reports using COBOL, C, SQR, SQLplus, and in some cases, Access.
Priority was given to developing reports essential to meeting state and federal mandated reporting requirements. Gradually, we acquired a library of internal reports with which to track enrollment, applicants, registrations, and academic progress. The custom-written reports for Enrollment Services, Academic Affairs, Institutional Research, Fiscal Affairs, and the Alumni Office became the basis of operations. They were time consuming to define, labor intensive to write, and often labor intensive to read. With each upgrade, we made painful progress. A handful of users were approved to produce ad hoc reports through Banner Population Selections and Letter Generation for academic and enrollment use, and end users could pull some canned reports, with limited parameter options, in areas where Banner had been used without customization.
Over time, our ability to improve business practices was constrained by concern for the effect changes in policy might have on our custom written reports, which in many cases were already out of synch with or obsolete for current business needs. As IS staff came and went, the prospect of adapting or amending reports to reflect more current reporting needs became daunting. As a result, functional staff began using "shadow system" Excel and Access databases to create reports they wanted — a development that threatened the Banner system's data integrity. Serious efforts ensued to reduce the number of shadow systems by taking advantage of existing Banner functionality. For example, IS worked with the Disability Services department to completely streamline their operation by using Banner exclusively for automating their operational workflow and reporting. These efforts ensured that data would reside in a central repository, available for export to a centralized reporting system, and that the institution was ready for the transition to ODS.
What Now?
With 90-plus programs of study spanning career, vocational, and technical certificates and degrees as well as transfer degrees, fall enrollment has grown by 30.6 percent in the past 10 years, and annual enrollment has increased by 25 percent. We welcomed the additional students, but the stress on our physical and technological infrastructure has grown with enrollment. By 2007, with the development of web-based everything, our ability to rely on IT for report development needed to end.
Pushed inexorably toward "data-driven decision making" by both the New England Association of Schools and Colleges (NEASC), the college's accrediting agency, and the state and federal agencies to which we report, our Institutional Research (IR) office was drowning in a sea of data requests. With a president and an executive staff who fully embraced the "culture of evidence," the phone calls and e-mails were flying between IS and IR as we struggled to respond to a daily onslaught of ad hoc requests. Grant proposals that had previously consisted of anecdotal data began to require detailed charts and graphs with associated concrete outcomes, while state and federal reporting began to shift to disaggregation. The death knell rang for our demographic reports when, in 2007, the Integrated Postsecondary Education Data System (IPEDS) announced a major change in race/ethnicity reporting. Our patchwork approach of combining old reports with data extracted via Toad and Access no longer sufficed. We turned to our in-house cross-component Banner Implementation Team (BIT) to strategize solutions.
Guided by the CIO, the BIT team compiled a list of needs and wants, along with risks and mitigating factors of identified solutions. Several staff members were working with data warehouses used at the state level, so there was familiarity with the systems and an understanding of how they worked. A data warehouse combined the possibility of enhanced report-writing capability with the autonomous empowerment of users to look at data in different ways by removing the impediment of "how will we get the data?" By reducing dependency on IS, we could redeploy highly trained staff to work on strategic priorities.
As Chief Finance Officer Janice Forsstrom pointed out,
"It is imperative for College Cabinet leaders to make the investment in data reporting systems and staff development to use data-driven decision making to address the current challenges of all higher education institutions — a systematic approach is a critical strategic direction that makes the competitive difference for our institution."
Making the Leap
For this IR department, adopting an operational data store (ODS) wasn't unlike deciding to have a child. We thought about it a long time. Drew up a list of pros and cons. Imagined how it would make our lives better. Made a leap of faith and committed to it. In the beginning, we experienced some doubts about our decision, but when we finally began using an ODS and realized what was possible, we were totally hooked. Once we got the hang of it, we really couldn't remember life without it. Like any good parent, the IS office was with us every step of the way.
Once the decision to adopt a data warehouse was made, we considered our options in light of the timeline with which we were working. Based on staffing levels and existing project commitments, internally developing a warehouse was not an option. We needed a product that integrated fully with baseline Banner, would give us access to a community of users, and provided implementation and ongoing support services. Ultimately we chose the SunGardHE Operational Data Store/Enterprise Data Warehouse (EDW), an "out of the box" solution that would utilize our core ERP Banner system, and selected Oracle Discoverer as a report-writing tool. In preparation, we worked with the Disability Services and Trio areas, which had begun using Excel and Access systems, to convert those shadow systems and bring their data into Banner. We met with staff across all components — Academic Affairs, Student Enrollment Services, Fiscal Affairs, and Institutional Advancement — to identify key users and their needs, while also defining expectations. SunGardHE completed a formal assessment, which we used as a roadmap for ODS implementation. Forming a Strategic Reporting Team comprised of cross-component representation, we addressed major policies determining security, access, and overall control of information. The Strategic Reporting Team addressed common nomenclature to ensure that all users had with a baseline understanding of terms and definitions. Documentation covering customization of the baseline product was developed, along with common naming conventions to standardize the report library.
With an implementation framework developed, we turned our attention to training. A pilot group of users from each department were invited and strongly encouraged to attend training conducted by an outside vendor. Following the initial training, we set up biweekly and ongoing walk-in training sessions. These biweekly "workshops" have continued to the present, with participation purely voluntary. From inception to implementation, the process of ODS implementation took in excess of two years. It has been both painful and exhilarating. At this point, IR and Finance are fully invested and using the system on a daily basis. IS estimates that users throughout the college now do 50–60 percent of all reporting, with some departments – Fiscal Affairs, for instance – almost 90 percent self-reliant. In addition to "report writers," a separate group of staff were trained to be "report viewers." Those people work with the designated report writers in their components to design reports that can be run at will, by any viewer. In the Student Support Center, for instance, operational reports such as these are an ordinary part of the work day. Staffers have mechanized the process for scheduling orientations and advising sessions, and with access to the Discoverer Viewer, all of these operational tasks are handled autonomously, with no IS involvement.
Jennifer Kirk, director of Recruitment and Admissions, explained the benefits to her group as follows:
"Since the conversion to ODS, the IR office has worked with report writers in our area to provide me with detailed reports that fit the needs of the Admissions Office. I am able to view these reports and send out appropriate communications to targeted audiences."
Growing Pains
Four years into this project, it's fair to say that IS underestimated the technical expertise needed internally to support the ODS/EDW. It became clear that we needed a full-time business intelligence analyst to support these complex systems. In fall 2012, we brought a BI analyst onboard to manage the ODS/EDW. As a result, we plan to pick up the pace on bringing other data views into the ODS. For example, our Early and Midterm Alert process, used for both academic and financial aid purposes, resides in a homegrown system called "Oasis," a customization to the Ellucian system. In the past, the only means of accessing Oasis information was through a crudely written Banner report formatted to print on green bar paper, using a printer that went out of service years ago, leaving us reliant on a PDF version that can't be printed. Thanks to our BI analyst, that system is now fully integrated with ODS, so that reports can be written to disaggregate Alert data by demographics and program. The sooner program directors, advisors, and tutors can intervene with these students and the more common data elements we can find, the greater our opportunity to provide the right kind of support services to help students succeed. As retention and completion have moved into the forefront of performance measures, the ability to pinpoint academic stumbling blocks will be key to reducing achievement gaps in gender and race. The ODS has become our primary means of disaggregating and mining data.
Running Before Perfecting Walking
For the past four months our BI analyst has led the transition from Discoverer to IBM's Cognos as a report-writing tool. Given that most of our report writers had not yet become comfortable with Discoverer, this change is a challenging process. Discoverer and Cognos are dissimilar products, and Cognos is new to both the IS department and almost all other functional users. The process of converting the existing report library has proven valuable to re-thinking the naming conventions originally implemented. Based on the lack of adherence to the stated nomenclature, we are experimenting not only with new naming conventions but also with enforcement techniques. Converting to Cognos wasn't in our original plan. And when we learned last year that we would need to convert, we weren't fully aware that the conversion would need to be completed by March 2013, so as to ensure supportability and minimize requisite training and learning. When completed, the conversion will mean that both ODS and the EDW system we plan to implement will use the same report-writing tool.
Careful What You Wish
From an IR perspective, transitioning from Banner Reports to ODS Reports enabled staff to respond more nimbly to data requests, to test hypotheses quickly, to make adjustments more easily. The ability to access disaggregated data provides a platform for data mining heretofore unavailable. On a daily basis, using ODS has improved the responsiveness of the IR office to internal and external data requests and reporting needs. Having removed the impediment of how to extract the data, the focus has shifted to correctly identifying which pieces of data will give us the information we need to make key decisions.
Figure 1 (Exhibit A) shows an example of a pre-ODS enrollment report aggregated by program. Race and gender are delineated, but not related to age, disability, limited English, or other special population information. Figure 2 (Exhibit B) shows a Cognos-designed report, with disaggregated data by race/ethnicity and gender, also with age and special population information: Limited English, First Generation, Financially Disadvantaged. Having that specific information allows the IR office to produce data directed at reviewing completion and retention rates by special population, for instance. Current performance metrics for the state of Massachusetts aim to reduce achievement gaps between minorities and non-minorities and males and females as a major state priority. This information is an important piece of the puzzle as we develop initiatives to address this priority.
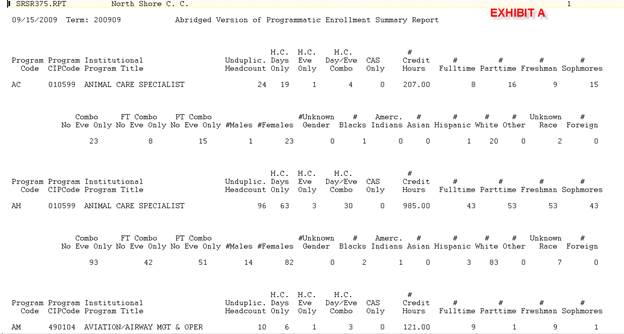
Figure 1. Pre-ODS enrollment report aggregated by program
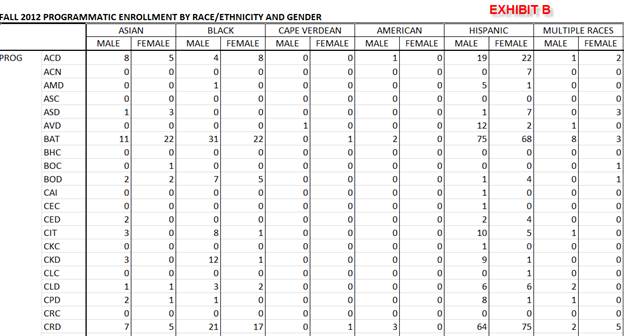
Figure 2. Cognos-designed report with disaggregated data
Law of Unintended Consequences
We've seen an unanticipated benefit of using ODS: it has caused us to review and improve business practices. Data doesn't always provide answers, but when it keeps exposing the same questions, it inevitably becomes the impetus for change. The ability to retrieve data with more focus and strategy in mind revealed a number of ways in which we were not utilizing Banner to its fullest capabilities or entirely to our advantage. Subsequent to implementing the ODS, we implemented more course and student levels in Banner. That succeeded so well that we tackled the long-awaited addition of new campus and session codes as well.
Now that we can extract the data we collect in customizable reports, there's a much greater motivation for collecting information and getting it entered correctly in Banner. Ultimately, using the ODS has improved data integrity in Banner by providing the ability to create highly specific discrepancy reports. As a result, we have tightened policies around readmission and change of program, to name a few.
Increasingly, users want information from the ODS that isn't discretely available in Banner. We are a multi-campus institution, which complicates reporting. An issue as simple as "How many parking spaces do we need on the Danvers campus on a Monday morning at 10:00?" prompted us to define a "Campus Slot Table" in the ODS. The ODS enables us to more easily extract information and code it in the process, to make it more useful.
Lessons Learned while Hurtling Forward
The process has not been without challenges — though exciting ones. Early on we realized that knowledge of how Banner works makes the transition to ODS fluency much more effective. Not all staff will become report writers. But all staff have the ability to be report viewers, so even staff who aren't fluent in "ODS" have increased their independence by learning to view and run reports written by others. Maintaining user involvement in some departments has been a challenge, and in retrospect, participation in report writer training should have been mandatory. In the long term, we might need to rethink departmental organization to fully use the ODS in all functional areas. The ability to write reports, or at least view them, should be a priority for new hires.
The attention given to community college enrollment management, completion and retention metrics, alternative measures of success, and reduction of time to complete developmental math and English, as well as national trends toward performance budgeting, make investment in a robust data reporting infrastructure (and training) a critical strategic direction for NSCC institutions. The chief finance officer was a sponsor of the ODS/EDW project for exactly this reason. NSCC President Wayne Burton said:
"I was sold on ODS when the College's 2009 NEASC Accreditation report highlighted and commended the creation of a culture that understands the importance and use of data — positive confirmation that the time and effort involved in this project were very worthwhile!"
Overall, the transition to the ODS and EDW has positioned the college well for the future in terms of
- examining trends and indicators internally and
- reporting on state and federal metrics externally.
Massachusetts is currently moving toward a performance-based budget formula for public community colleges, so NSCC's investment in developing a robust reporting system has proved to be the right strategic direction. We're not at the point of considering a second "child," but we are very committed to this one.
© 2013 Laurie LaChapelle. The text of this EDUCAUSE Review Online article is licensed under the Creative Commons Attribution 3.0 license.