
Key Takeaways
- The results of a 2010–2011 survey of mobile device ownership and use are helping the University of Florida make informed decisions today about how best to allocate limited resources to maximize the impact of its mobile initiatives.
- The IT organization at UF is now developing annual surveys related to IT services, including mobile capacities, to provide ongoing and potentially longitudinal user feedback.
- Future mobile surveys must reflect changing technology despite a potential negative impact on longitudinal studies, and shifting surveys more toward identifying attitudes and experiences will mitigate that problem.
Like many universities, the University of Florida is exploring options to enhance the experience of students, faculty, and staff using mobile devices to access online campus resources. As part of this exploration, the Office of Academic Technology and the Warrington College of Business Administration collaborated to design and deliver a survey of mobile device ownership and use to UF stakeholders. The results of this survey are now being used to help UF make informed decisions about how best to allocate limited resources to maximize the impact of its mobile initiatives.
While this survey was conducted in 2010 and some of the results are fairly dated, four years later many of the results continue to be applicable for institutional planning around mobile device initiatives. Likewise, the discussion of methodology and strengths and weaknesses of the survey instrument will be of significant benefit to institutions looking to elicit user input into mobile-device initiatives and IT services generally.
Context
Web-enabled mobile devices have been around for many decades; however, the era of the handheld device really began in 1973, when Motorola employees were granted a patent for portable cellular telephony.1 Ten years later the Motorola DynaTAC 8000X was launched as the first commercially available cellular portable telephone.2 Widespread use of mobile cellular devices did not emerge until the 1990s,3 with the invention of “second generation” digital cellular technologies combined with the rapid decrease in size of the mobile devices themselves.4 Although mobile phones had been able to connect data networks such as the Internet for many years, it took the widespread availability of good-quality 3G coverage in the mid-2000s to enable the mobile Internet, at which point mobile devices and use began to proliferate.5 As a result, it is estimated that more than two-thirds of the world's population now have mobile phones, and mobile phones are rapidly being replaced by Internet-enabled "smartphones."6
The convergence of mobile devices and wireless technologies is also critical for the success of mobile devices. Not only can mobile phones access services over cellular networks, but wireless networks have proliferated such that mobile phones have become portable computing devices that leverage digital signals to access the Internet anywhere there is a signal to which they can connect. This is arguably the most important issue for higher education as faculty, staff, and students increasingly use mobile devices to access online services, driving institutions to continually expand wireless coverage and capacity.7
The trend toward smart and mobile is emerging as a dominant market driver. According to Gartner, by 2014 more than 3 billion people will be able to engage in electronic transactions using traditional computers and Internet-enabled mobile devices, and the shift to a "bring your own device" world is being driven by consumer markets rather than by business technology adoption.8 Furthermore, Gartner predicts that in 2013 combined smartphone and web-enabled phones will surpass traditional computers as the dominant devices to access the Internet — a trend they suggest will continue. But these trends will not just affect how people access the Internet; they will affect the content of the web as well: "Websites not optimized for the smaller-screen formats will become a market barrier for their owners — much content and many sites will need to be reformatted/rebuilt."9
Of course, many colleges and universities are aware of these trends and are seeking to engage the mobile Internet in effective ways such as converting web content to fit mobile devices and developing smartphone applications.10 Acknowledging these trends, in September 2010 University of Florida Information Technology (UFIT) commissioned a taskforce to research mobile trends; investigate current mobile use at the university; identify existing client groups and desired services for mobile access; evaluate and predict trends related to infrastructure, systems and services, data sources and support; and investigate other issues necessary for a successful mobile initiative at UF. This research and subsequent recommendations were to lay the groundwork for mobile development at UF that would be carefully targeted to UF needs and therefore deliver the most cost-effective solution and the best benefit for UF stakeholders.
The Survey
To guide the UF mobile initiative, representatives from the Office of Academic Technology and the Warrington College of Business developed a short survey designed to:
- Identify which Internet-capable mobile devices were in use on campus
- Gauge the extent to which Internet-enabled devices were being used at UF
- Identify the kinds of devices in use
- Elicit recommendations about what campus services would be most desired for access from a mobile device
The draft questions for the survey were reviewed by a subcommittee of the Technology Innovations Advisory Committee [http://www.it.ufl.edu/governance/committees/at/innovation/docs/bylaws.pdf], and the survey was tested with a small sample of self-selected student volunteers. The survey was delivered using the Qualtrics web-based survey system.
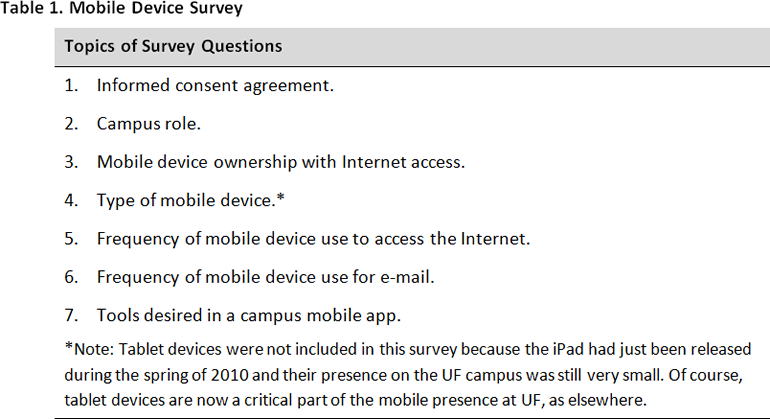
The survey was deliberately short to maximize participation and was optimized for smartphone display. Ultimately, seven questions were identified, including an informed consent indicator (see table 1).11 Participants were required to agree to participate in the survey, after which they self-identified as undergraduate student, graduate student, faculty or instructor, or staff. They were then asked if they owned a web-enabled mobile device, even if they did not use it to access the web. Participants who indicated that they did access the Internet with a mobile device continued the survey; those who did not use the Internet were finished with the survey.
Participants who continued the survey were then asked what kind of mobile device they used, given checkboxes for iPhone, iPod touch, Android/Google device, BlackBerry, Treo, Palm, or Other. Participants choosing "other" were given a text box to identify the device.
The next two questions sought to identify the level of use for web-enabled devices. Question 5 asked, "How often do you use your mobile device to access the Internet on an average day? Please include the time spent on apps that use the Internet like NPR, CNN News, Facebook, etc., but do not include time spent checking e-mail." Response options included:
- I do not use the Internet on my mobile device
- 1 to 15 minutes
- 16 to 30 minutes
- 31 minutes to 1 hour
- More than an hour
Question 6 then asked, "How often do you use your mobile device to check and/or respond to e-mail on an average day?" The response options for this question were the same as for question 5.
Finally, participants were asked about preferred and hypothetical use of web services: "In an official UF mobile web application, what tools would you use the most?" The survey lists several low-hanging fruit–type options and, once again, an "Other" option was available:
- Campus map
- Sports information
- News feeds
- Dining guide
- News/alerts/emergency information
- Campus directory
- Course information
- Other
Participants
Consistently ranked as one of the nation's top public universities, the University of Florida has 16 colleges serving a student population of roughly 34,000 undergraduate students, 12,000 graduate students, and 4,000 professional students.12 These students are taught by nearly 5,100 full-time faculty, plus an uncertain number of part-time instructors as well as graduate teaching assistants and nonfaculty teaching staff. UF's freshman retention rate of 96 percent is among the highest in the country; 65 percent of all students graduate in four years and 83 percent in six years.
A semirandom sample of 22,500 participants was invited to participate in this survey. We use the term "semirandom" because 10,000 students enrolled for the fall 2010 academic term were randomly selected (roughly 20 percent of the UF student population) to participate in the survey. However, all UF faculty teaching in the fall semester (2,500) and 10,000 current staff were also invited to participate. All participants were notified by e-mail of the purpose and location of the online survey. While consideration was given to inviting all students to participate, because this survey included open-ended questions, it was decided this would take too long to process data from the complete population.
The first e-mail invitations to participate in the survey went out September 27, 2010, with two reminder e-mails sent October 1 and 7. Unfortunately, the first e-mail notification was inadvertently constructed such that many users refused to take the survey because the e-mail looked too much like a "phishing" e-mail. Specifically, during the time frame in which the survey questions were developed, one of the research team members left UF to take a faculty position at another university, but his name was listed first on the e-mail. Furthermore, the e-mail came from Qualtrics, a proprietary survey system not then in widespread use at the University of Florida but licensed within the College of Business. As a result, the invitation to participate appeared to come from a non-UF system over the signature of a non-UF employee. Therefore, the follow-up and second reminder e-mails were both rewritten to better align with UF security standards, successfully recapturing some of those who deferred in the first round.
In the end, 3,526 people took all or part of the survey — 15.7 percent of those invited to participate — with 84 not answering all questions. These participants' responses are included in the data analysis where possible.
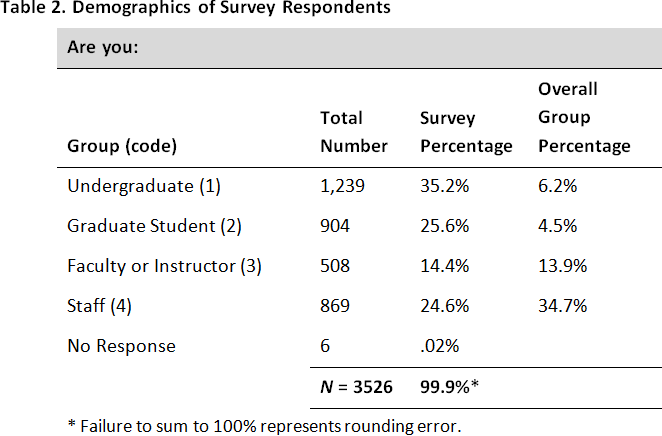
Representation across the four survey target groups (undergraduate students, graduate students, faculty, and staff) was unequally distributed, reflecting a number of factors including unequal distributions of participant "types" on campus (see table 2). For example, there are more undergraduates than there are graduate students and more staff than faculty. Furthermore, survey participation as a percentage of each population type was even more unequally distributed, with relatively low response percentages from undergraduate and graduate students (6.2 percent and 4.5 percent, respectively) and significantly higher response percentages from instructors (13.9 percent) and staff (34.7 percent). The relatively low student response rate unfortunately puts some constraints on the confidence with which we can generalize survey results to the student population at large, much less other undergraduate populations. Faculty and staff results allow for more confident in-group generalizing.
Results
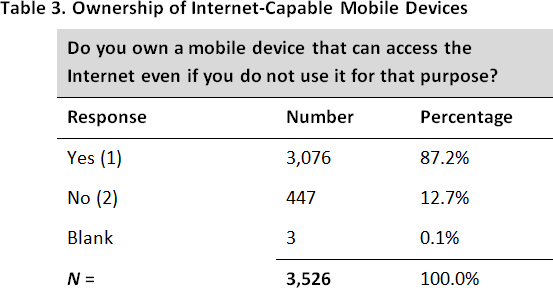
As table 3 shows, respondents overwhelmingly indicated that they owned a mobile device capable of accessing the Internet (87 percent) and that the iPhone and other Apple products were the largest single group of those devices (34.2 percent), though far from a majority (see table 4). Unfortunately, 17 percent of our respondents indicated they used some "other" kind of mobile device, which suggests that some users were unsure of what constituted a mobile device (is a laptop "mobile?") or were unsure of what device they had, and/or that we missed some important device types. Possibilities include Windows Mobile devices as well as iPads, which had just been released during the spring of 2010, but whatever the unidentified devices were, a significant part of the UF population used them.13
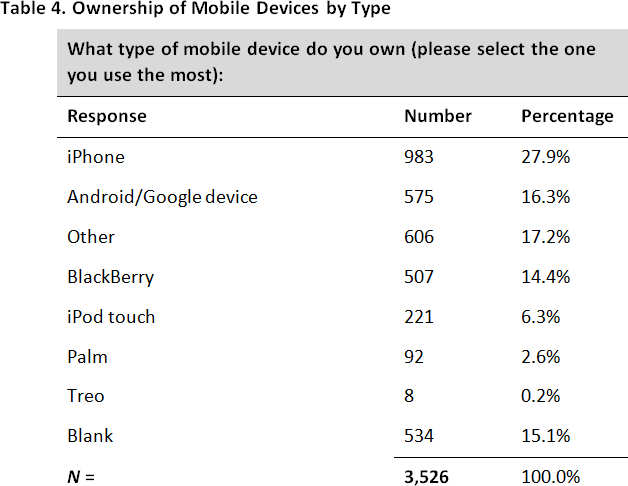
It is interesting to note in this context that, while overall trends in smartphone ownership have changed substantially since this survey was taken, at the time of this survey UF differed significantly from national trends in that iOS devices (iPhone and iPad touch) were more common on the UF campus.14 This probably reflects the relatively affluent nature of UF students.15 Likewise, Palm devices retained a small presence on campus, though they were no longer a significant factor in national sales, which undoubtedly reflects use continuing after purchasing declines.16
Internet Access and Services
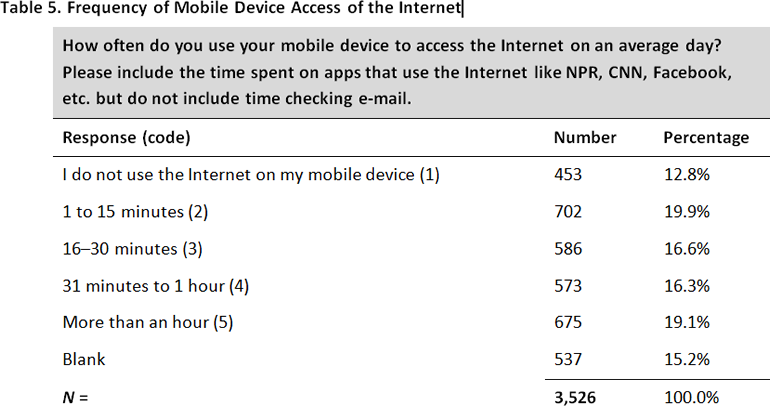
Question 5 began the process of digging into use profiles by asking, "How often do you use your mobile device to access the Internet on an average day? Please include the time spent on apps that use the Internet like NPR, CNN, Facebook, etc. but do not include time checking e-mail." As can be seen in table 5, we found a fairly even distribution of use with each time range, from "1–15 minutes" to "More than an hour," ranging between 16 percent and 20 percent.
What is perhaps most interesting is that nearly 13 percent of respondents indicated that despite having an Internet-enabled device, they did not use it to access the Internet. This finding may reflect phone plan choices (e.g., additional costs for data services) or other concerns; however, it may also indicate that some users did not see the value proposition in mobile Internet, which suggests that deploying campus mobile surveys may require some marketing and "evangelism" to reach the full spectrum of the target audience. Whatever the cause of Internet nonuse, more than 1 in 10 users reported that they did not use this significant capability of their device.
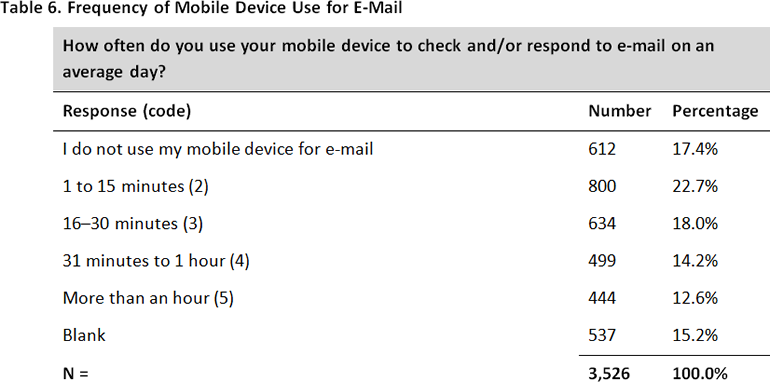
Perhaps even more interesting than the 13 percent of people who do not access the Internet, question 5 revealed that more than 17 percent of users do not check or respond to e-mail on their phones (see table 6). This may represent the growing prevalence of SMS or text messaging as the preferred medium of communication from mobile devices, particularly among younger users.17 It may also represent issues related to the previous question, where often phone plan choices require additional cost to check e-mail.
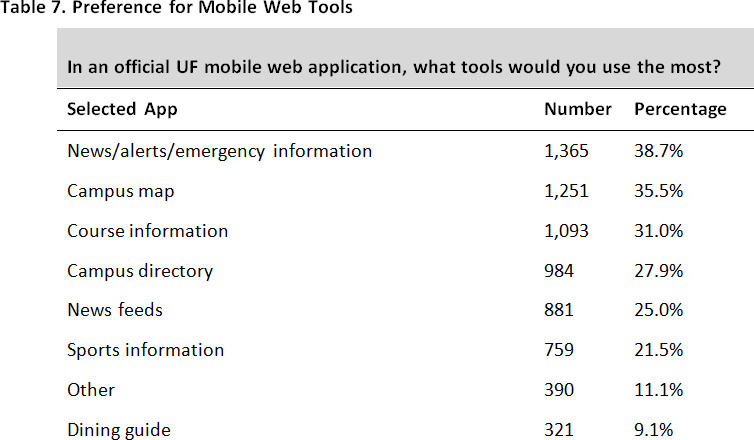
The two final survey questions elicited respondent input into the kinds of services desired for mobile access. Question 6 gave a checklist of common services found in mobile applications developed across a number of institutions but also provided a text field with the option of "Other" (see table 7). Here respondents indicated that the most desired applications include news, alerts, and emergency information (38.7 percent); a campus map (35.5 percent); and course information (31.0 percent). We suspect this same question asked at other institutions would result in a somewhat different selection profile. UF is a very large campus with courses distributed across a wide variety of locations, for example, with the result being that a campus map would be more valuable than it might be at a smaller, more-compact campus or one where the large majority of classes were offered in a common classroom building.
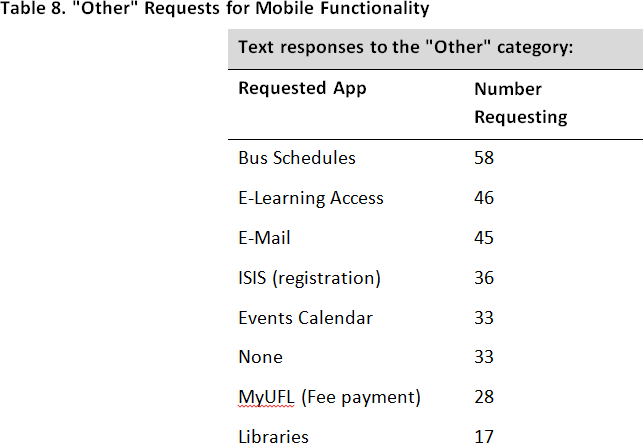
Question 7 gave respondents who chose "Other" the opportunity to write in a text response indicating their most desired mobile app (see table 8). Most of those who selected "Other" provided a written response (92.8 percent); those options are discussed below. As mentioned previously, because the University of Florida is a very large enrollment university (54,000 students) and has a large physical campus (more than 2,000 acres and more than 900 buildings including 170 with classrooms and labs), it is perhaps no surprise that the single most desired function to emerge from this survey was information about the regional transit (bus) system (58 requests).
The second most desired function (46 requests) was access to learning services. However, a key lesson learned from this survey is that we needed to define some terminology more clearly. Because of some unclear definitions, we don't know whether "learning services" meant the course management system tools and functions; the official student calendar and registration information, or both; use of mobile devices for classroom response systems; or something else entirely.
Coming in third (45 requests) was access to campus e-mail. This request probably reflects a homegrown web-mail system at UF almost exclusively used for student e-mail. While the UF web-mail system supports IMAP, it would seem that configuring an e-mail client is a technical hurdle many would rather not face.
Other top-ranking requests included access to the UF registration and integrated student information system, or ISIS; the campus events calendar; access to MyUFL (the campus fee payment and business services portal); and access to library services. Interestingly enough, "None" was entered as a text response more frequently that either access to MyUFL or the libraries.
Other app requests mentioned included access to traffic and parking information, class notices, weather, and news. Furthermore, a number of people from UF's Academic Health Center indicated they wanted access to local IT and academic services including e-mail, medical libraries, and the medical center portal, as well as access to "medical software, patient information, medicines, etc." Finally, 12 people used the open-ended text field to indicate they wanted "all" apps.
Correlations
Correlational analyses revealed a number of interesting insights into user responses to the mobile survey. In light of frequent discussions of "digital natives," we first asked, "Do students use mobile devices more than instructors, and do undergraduate students use mobile devices more than graduate students?"18 (institutional role [Q1] × Internet use [Q4]). Our hypothesis was that undergraduate students (digital natives) would use mobile devices more than graduate students, who would use them more than instructors. The data in figure 1 clearly support this hypothesis, and the disparity of use is most evident at using mobile devices more than one hour per day.
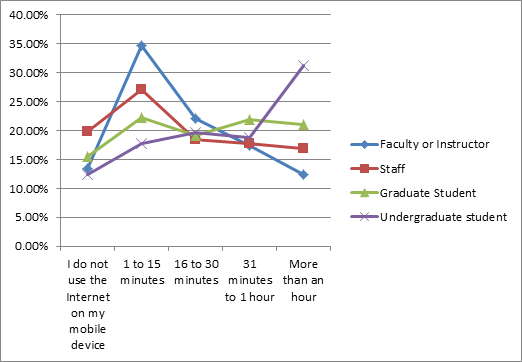
Figure 1. Institutional role × Internet use
It is also interesting to note that from somewhat equivalent levels of nonuse, faculty, staff, and graduate student use of mobile devices all peak at 1–15 minutes, while undergraduate use peaks at more than an hour. Furthermore, in terms of length of time used, faculty and graduate student use of mobile devices trends generally downward, while staff use remains largely constant and undergraduate student use trends upward. Both of these patterns confirm our hypothesis and the oft-stated assumption that "digital natives" make use of mobile technologies far more extensively than "digital immigrants."
In light of recent research suggesting that e-mail is passé among traditional college aged students and instant messaging (SMS) is the preferred method of communication, we next asked, "Do undergraduates use e-mail on their mobile devices less than graduate students and instructors?"19 (e-mail use [Q5] × institutional role [Q1]). Once again, our hypothesis was that this would be true. In this case, however, the data suggests a mixed picture, as shown in figure 2.
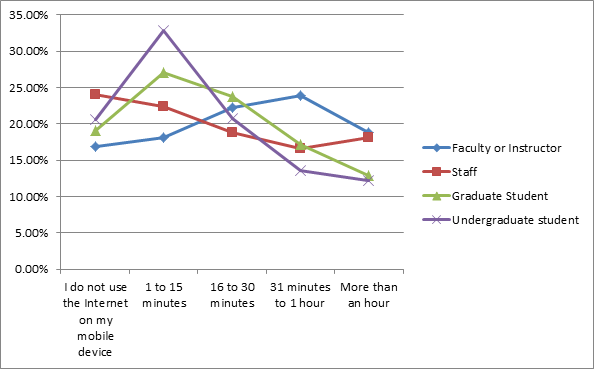
Figure 2. E-mail use on mobile devices by institutional role
As figure 2 illustrates, use of e-mail on mobile devices remains quite high among both undergraduate and graduate students, although student use diminishes at longer time lengths. It is notable, however, that student use tapers off more rapidly at longer time lengths such that more instructors and graduate students use e-mail on mobile devices than do undergraduates in the time spans greater than 15 minutes per day. These data support the student movement away from e-mail use but also suggest that e-mail use on mobile devices continues to be an important function.
Another interesting pattern is that e-mail use on mobile devices by both undergraduate and graduate students follows a similar trajectory; however, in terms of Internet use, graduate students more closely mirror the faculty trend line (see figure 1). This suggests that if there is a divide between "digital natives" and "digital immigrants," graduate students may fall into an ambiguous category that might be a function of a wider age spread or some other factor. While this was somewhat expected, it remains unclear where the line between natives and immigrants lies; but once again the differences in this data are too small to draw sweeping conclusions. Furthermore, the UF mobile survey did not ask about SMS/text messaging, so we cannot correlate e-mail and SMS use to further address this hypothesis. Thus, the issue of where the dividing line should be drawn between digital natives and immigrants should be a subject of further research.
Finally, our third correlational question asked, "Is there any relationship between the type of device owned and the type of services desired?" (device [Q3] × service [Q6]; see table 9). In asking this question we sought to address a concern that simply tallying desired functions and services for mobile use had some potential to skew priorities toward specific devices. In some contexts, the decision to develop for specific devices makes sense, for example, if an institution has chosen to support a particular device or operating system.20 However, in many cases neglect of certain mobile device types is undesirable, which would make the selection of services for development and integration into a portfolio of wireless services also undesirable.
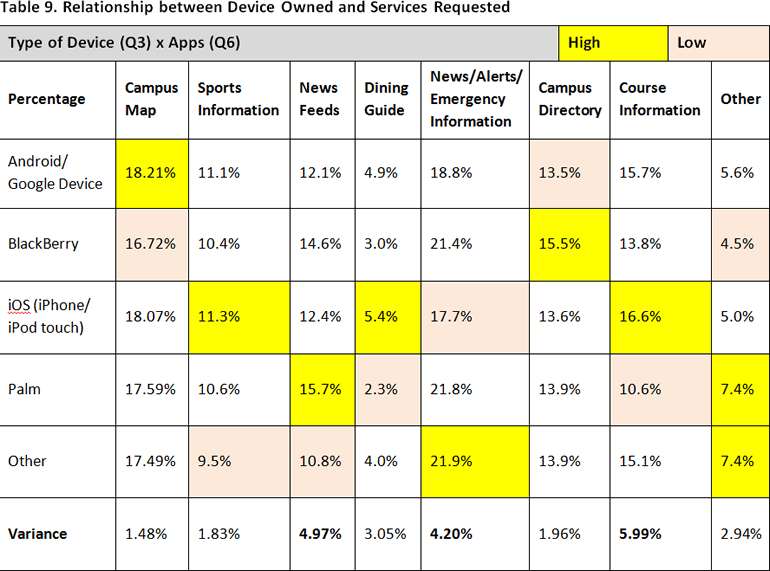
Table 9 illustrates highs and lows in the data points across a device by desired application grid with variance calculated at the bottom of each column. From this, we can quickly see that for the most part there is no statistically significant variation across desired services and device types, with News Feeds (4.97 percent variation), News/Alerts/Emergency Information (4.2 percent variation), and Course Information (5.99 percent variation) presenting as possible outliers if evaluated under different circumstances. The absence of significant variation is even better illustrated in figure 3, where the responses for all devices track together with a high degree of uniformity.
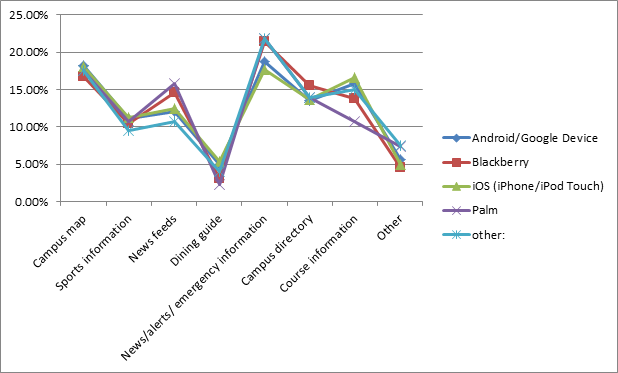
Figure 3. Devices graphed against applications desired
It is of some interest that the greatest variation lies in the area of access to course information, where Palm devices scored unusually low. This may represent the development of Palm devices primarily as personal organizers and reflect their limited web-surfing capabilities, but once again, we cannot make too much of this finding (and with the decline in use of Palm devices, this is rapidly becoming a moot point). Finally, access to course information is a vague category, and without further research we cannot delve more deeply into the significance of the variance.
Conclusions
The University of Florida has used this data to help guide its mobile initiatives, particularly in terms of building capabilities into its mobile applications as well as investing in the infrastructure to support the increasingly mobile future. Specifically, the most requested applications (access to bus schedules, the e-learning system, the registration system, the UF calendar, and fee payment) have all been implemented in UF's mobile initiative. Likewise, this survey reinforced UF's commitment to Project Keitai, the mobile Sakai project for mobile course management system access and use. Furthermore, UF is investing heavily in its wireless and cellular infrastructure.21 Finally, the IT organization at UF is also developing annual surveys related to IT services, including mobile capacities, to provide ongoing and potentially longitudinal user feedback.
More broadly, salient features of these survey results suggest some important trends for mobile initiatives in higher education:
- The survey reinforces the common understanding that mobile devices are proliferating and demand for mobile-enabled services is increasing. As a result, more institutions are launching mobile initiatives, and schools without them are experiencing pressure to do so.
- Most campuses provide a variety of services, from registration to fee payment to course activities to news about campus events, that students, faculty, and staff desire to access through mobile devices. As a result, it is increasingly likely that mobile access to services will become a decision point that will help prospective students and employees decide where to attend, where to work, and how to rank an institution. Therefore, it is increasingly important for institutions to "go mobile."
- The services desired by users reflect everything from easy-to-implement "low-hanging fruit" to more complex access profiles that implicate security issues (access/authorization) and privacy considerations (FERPA, HIPAA, PII) as well as protection of institutional revenue streams and intellectual property. Therefore, institutional mobile initiatives will need to engage policymakers, legal counsel, security experts, and others as well as IT and development shops when an institution "goes mobile."
- This survey provides some useful guidance to institutions considering the development of mobile apps and mobilized services by identifying numerous desired functions that are common across many higher education institutions including access to academic services and course activities on mobile devices.
Beyond these issues, this survey provides data to support a number of common understandings:
- Undergraduates more heavily use mobile devices than either graduate students or instructors.
- Instructors use e-mail on mobile devices more than undergraduate students, with graduate students falling somewhere in between.
- Demand for apps is driven by their functionality and usefulness rather than the type of device being used.
In all cases, the findings of this study reinforce the common understanding that "the future is mobile."
Some Thoughts for the Future
Because the market and landscape for mobile devices is still rapidly evolving, surveys related to mobile devices need to be carefully crafted to maximize predictability. Surveys that focus on current technologies and needs are often dated as soon as the results are gathered. For example, since the data evaluated here was gathered, Android devices have replaced the iPhone as the market-leading mobile device, but Apple also recently won an important (and costly) lawsuit against Samsung by arguing, in part, that the Android operating system used on Samsung devices violated a number of Apple patents.22 Furthermore, current reports indicate that Samsung is preparing to sue Apple, should Apple release an iPhone with long-term evolution (LTE) capabilities.23 As a result, the future of mobile devices now operates under a cloud of legal challenges that will take many years to resolve. Regardless, it is clear that mobile devices will continue to proliferate, and the current legal uncertainties are likely to spur even greater diversity in mobile devices and their operating systems.
Under these circumstances, future research needs to ask more questions focused on decision making related to mobile devices rather than on the devices themselves. For example, future surveys might ask non-owners why they do not own mobile devices or choose not to own smartphones. Does this choice involve cost or security concerns? Specifically, 13 percent of our survey respondents who reported owning an Internet-enabled device reported not using that device to access the Internet. Understanding why may indicate some important considerations or suggest decision points such as cost or perceived ease of use at which this may change. Or again, more than 17 percent of our respondents reported that they do not check e-mail on their Internet-enabled phones. Is this a "digital immigrant" issue, as speculated here? Or is there something else going on? Answering each of these questions may help better understand use trends and enhance predictability of future trends.
Another important area for exploration would be to dig more deeply into demographics. For example, we saw in this study some hints that undergraduate and graduate students may both function in general as digital natives, but few years separate graduate students from many instructors. Furthermore, all traditional higher education cohort labels (undergraduate/graduate, lower division/upper division) are becoming more diverse in age — some graduate students are younger, while some undergraduates are older — and higher education is now serving an increasing mix of ages.24 Therefore, it may become more important in the future to subdivide undergraduates (lower division/upper division), to track narrower student cohorts, or even to abandon institutional cohort labels and focus on student age over the coming years to track whether the separation point between digital natives and immigrants will eventually disappear. Alternatively, it is also possible that these cohort labels may become increasingly meaningless as proxies for age. Likewise, it is possible, though not likely, that this "divide" may reflect changing needs intrinsic to the shift from undergraduate to graduate studies and/or the transition into work, career, and family. Regardless, we suggest that college cohort may no longer be an effective category for evaluation and that different analytical frameworks might be needed.
Finally, future mobile surveys must reflect changing technology. The obvious issue here is device type, but new and emerging technologies will also change the landscape of necessary and desirable apps and mobile functions. This change will have a potential negative impact on longitudinal studies, but again, shifting more toward attitudes and experiences will mitigate that problem, continue to draw valuable input, and enable valuable conclusions for the foreseeable future.
- Stephen Miller, "Motorola Executive Helped Spur Cellphone Revolution, Oversaw Ill-Fated Iridium Project," Wall Street Journal, June 20, 2009.
- See Retro Brick [http://www.retrobrick.com/moto8000.html] and "The Top 100 Gadgets of All Time" [http://www.mobilepcmag.com/features/2005_03/top100gadgets-5.html], Mobile PC Magazine, March 2005.
- See “Second Generation Mobile Phone Systems,” BBG Communications, March 3, 2009.
- See "The Changes to Mobile Phones Over the Last 30 Years," The People History, and Christopher Barnatt, "Mobile Computing" [http://explainingcomputers.com/mobile.html] Explaining Computers.com.
- Guy Rosen, "The Mobile Data Economy: How Much Data Do You Need to Buy?" Forbes, June 13, 2012.
- John Naughton, "Now 4 Billion People Know the Joy of Txt." The Guardian, May 5, 2012.
- See UF Wireless Network FAQ.
- See "Gartner Highlights Key Predictions for IT Organizations and Users in 2010 and Beyond," January 13, 2010, and "Gartner Says Bring Your Own Device Programs Herald the Most Radical Shift in Enterprise Client Computing Since the Introduction of the PC" [http://www.gartner.com/it/page.jsp?id=2136615], August 28, 2012.
- For a related but divergent viewpoint, see Kevin C. Tofel, "Here's Why Tablets Will Replace the Smartphone," Bloomberg Businessweek, August 2, 2012.
- See Campus Computing 2011: Big Gains in Going Mobile; the section on tablet computing in the NMC Horizon Report: 2013 Higher Education Edition; ECAR's "BYOD and Consumerization of IT in Higher Education Research, 2013"; and David Michael Ruth, Thomas M. Mastre, and Ron Fricker, "A Study of Mobile Learning Trends at the U.S. Naval Academy and the Naval Postgraduate School," EDUCAUSE Review Online, January 28, 2013.
- The informed consent indicator is required by the Institutional Review Board of the university. See http://irb.ufl.edu/irb02/.
- See Facts and Rankings and Enrollment.
- The University of Florida does not have a policy or a recommendation regarding device types, though some colleges and programs have their own recommendations or requirements.<
- See Statista and Tomi Ahonen, "Smartphone Bloodbath 2010: Now Final Numbers and Full Year 2010—and Each Rival Awarded Their Final Grades," February 9, 2011.
- The average annual family income of a typical UF student is roughly $105,000. Kristin Harmel, "License to Dream" [http://magazine.ufl.edu/2012/09/license-to-dream/], Florida, September 17, 2012.
- Ahonen, Smartphone Bloodbath 2010.
- See, for example, Tamyra Pierce,"Social Anxiety and Technology: Face-to-Face Communication versus Technological Communication among Teens," Computers in Human Behavior 25, no 6; Dick Ng'ambi, "Mobile Dynamic Frequently Asked Questions (DFAQ) for Student and Learning Support, Centre for Educational Technology, University of Capetown, South Africa; L. Srivastava, "Mobile Phones and the Evolution of Social Behavior," Behavior & Information Technology 24, no. 2, 2005; Louis Leung, "Unwillingness-to-Communicate and College Students' Motives in SMS Mobile Messaging," Telematics and Informatics 24, no. 2, May 2007.
- Marc Prensky, "Digital Natives, Digital Immigrants," On the Horizon 9, no. 5 (October 2001).See also Sue Bennett, Karl Maton, and Lisa Kervin, "The 'Digital Natives' Debate: A critical Review of the Evidence," British Journal of Educational Technology 39, no. 5 (September 2008): 775–786; and Chris Jones and Binhui Shao, The Net Generation and Digital Natives: Implications For Higher Education (York: Higher Education Academy, 2011).
- Adam Ziegler, "Smart Phones Beating Out Computers," The Daily Nebraskan, June 27, 2010; Belinda Nyakeke, "Why Student[s] Prefer Texting" [http://www.thecitizen.co.tz/sunday-citizen/40-sunday-citizen-news/2535-why-college-students-sms.html], The Citizen, June 19, 2010; Richard Kajumbula, "The Effectiveness of Short Messaging Service (SMS) Technologies in the Support of Selected Distance Education Students of Makerere University, Uganda," paper presented at the Fourth Pan Commonwealth Forum for Open Learning, October 30–November3, 2006, Ocho Rios, Jamaica; Steve Kolowich, "How" Inside Higher Education, January 6, 2011; Matt Richtel, "E-Mail Gets an Instant Makeover," New York Times, December 20, 2010.
- See, for example, Oklahoma Christian University's [http://blogs.oc.edu/talon/cat/campus_chooses_apple/] decision to go with Apple.
- Claudia Adrien, "UF Improves Wireless Access, Network on Campus," University of Florida News, September 20, 2012.
- See the Adobe 2012 Mobile Consumer Survey Results White Paper and Nick Wingfield, "Jury Awards $1 Billion to Apple in Samsung Patent Case," New York Times, August 24, 2012.
- Brad Reed, "Samsung's Plan for Revenge: Sue Apple If It Dares Release an LTE iPhone," BGR, August 30, 2012, and an overview of LTE.
- Eric Hoover, "The Many Facets of Adult Students," The Chronicle of Higher Education, May 10, 2010; Ella Powers, "Getting Older Students Into the Mix," Inside Higher Education, April 8, 2008; Elizabeth Redden, "Demographic Boom and Bust," Inside Higher Education, March 20, 2008; National Center for Education Statistics, Fast Facts: Enrollment. Also see U.S. Department of Labor, "Adult Learners in Higher Education: Barriers to Success and Strategies to Improve Results," Employment and Training Administration Occasional Paper 20070-03, March 2007.
© 2013 Douglas F. Johnson, Tawnya S. Means, and David N. Khey. The text of this EDUCAUSE Review Online article is licensed under the Creative Commons Attribution-ShareAlike 3.0 license.