Key Takeaways
- WCET member institutions sought more effective ways to identify and deconstruct risks to student success.
- PAR Framework partner institutions provide a full set of de-identified undergraduate student data and contribute an inventory of student interventions that allows for comparative investigation of student success trends over time, at the individual student, course, and degree level.
- While the ability to predict risk associated with each de-identified student in the PAR data set is powerful, knowing what to do to maximize each student's probability for success is even more powerful.
- Collaboration, common data definitions, a validated intervention framework, and a standardized collection of student performance data pave the way for meaningfully leveraging successful practices across institutions.
The PAR Framework emerges from WCET's interest in testing the application of predictive analytical techniques to better understand patterns of student loss, and then determining action paths for responding. In our efforts to accelerate the adoption of learning technologies innovation in practice, WCET member institutions sought more effective ways to identify and deconstruct risks to student success. We recognized our need to actively mitigate risk on both the college completion and online learning efficacy fronts.
Despite high enrollment numbers, postsecondary education completion rates have generally remained unchanged for the past forty years. Of all students who enroll in postsecondary education, less than half (46.1 percent) attain a degree within 150 percent of "normal time" to degree.1 Further, measures of student outcomes too often ignore the significant and growing population of nontraditional and adult learners. While online learning offers a legitimate path for pursuing a college education and provides students with a convenient alternative to face-to-face instruction, it, too, is laden with retention-related concerns.
The PAR Framework was developed to take advantage of emerging decision-making approaches that use business intelligence and data mining techniques to look for student retention patterns across institutions. We use a common data model and insights from pattern analyses to actively remove barriers to student success with specific local insights to the PAR institutional members.
About the PAR Framework
The PAR Framework is a nonprofit, multi-institutional collaborative venture focused on leveraging common data definitions and predictive analytics in the service of student success. Participating members voluntarily submit their student, course, and intervention data for inclusion in a massive data set created from the records of a cross-section of U.S. colleges and universities to focus on academic risk identification and to find actionable paths for providing interventions at points of relevance and need. The PAR Framework uses common data definitions for core measures across institutions to seek patterns of student loss and success. Predictive analytics methodologies and data mining techniques are applied to institutionally anonymized and student de-identified information to identify the factors that directly and positively influence student success and momentum towards completing a high value postsecondary credential.2
The PAR Framework is predicated on identifying factors that affect success and loss among undergraduate students, with a focus on at-risk, first-time, new, and nontraditional students. While attention had initially been paid only to online students, the sample now includes records of students from on-the-ground, blended, and online programs. Viewing normalized data through a multi-institutional lens and using complete sets of undergraduate data based on a common set of measures with common data definitions provides insights that are not available when looking at records from a single institution.
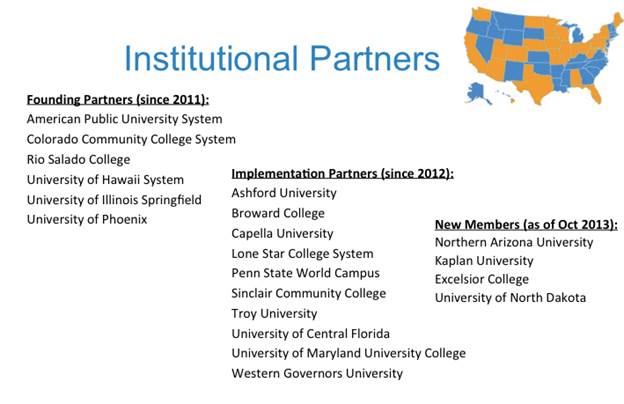
PAR Framework participation depends on having partner institutions (figure 1) provide a full set of de-identified undergraduate student data that allows for comparative investigation of student success trends over time, at the individual student, course, and degree level. PAR members provide incremental data updates at the end of each term/course enrollment period to measure changes over time, evaluate the impact of student success interventions, and enable the PAR predictive models to be adjusted and tuned for current data.

including the six founding partners
In this video from the January 2013 NMC Horizon Summit, co-author Ellen Wagner talks about the PAR Framework and why it matters (18:03 minutes).
Status of the PAR Framework
The PAR Framework commenced in May 2011 with six institutional members joining the WCET-managed and directed undertaking. In August of 2012, 10 additional WCET member institutions joined the original six to contribute student and course data to the federated data set. Four new institutions joined the implementation partners in October 2013. These include Excelsior College, Kaplan University, Northern Arizona University, and the University of North Dakota. PAR is on track to more than double the number of institutions actively working with PAR data definitions and student success intervention resources by March 2014. We plan to add another 20 PAR members by January 2015.
The PAR Framework data set currently consists of close to 2 million student records and more than 13.1 million course records, dating back to 2009. The PAR analysts are currently working with more than 70 variables, commonly defined by PAR institutional partners and available from each partner. These definitions have been openly published under a creative commons license for others to use. Hundreds of institutions, prospective partners, and researchers have downloaded the PAR data definitions since they were published in February 2013. Russ Little, Sinclair Community College (a PAR partner institution), recently described PAR as "The Rosetta Stone of Student Success" in a Campus Technology interview. IMS Global cited the PAR Framework as one of the open frameworks in its new anticipated Caliper data interoperability specification.
PAR researchers and data scientists use descriptive statistics, inferential techniques (including regression analysis), and predictive methods and modeling techniques (including clustering, decision trees, neural networks, and dimensionality reduction) to identify the factors that influence student success in the combined sample and at the individual institution level. Participating institutions have access to comparative benchmarks against peer institutions and the entire PAR sample at the course, modality, program, degree, and institution level. These graphical reports provide detailed information about the institution's own data compared against data from other anonymized institutions with similar profiles, as well as the aggregate data set of all PAR institutions.
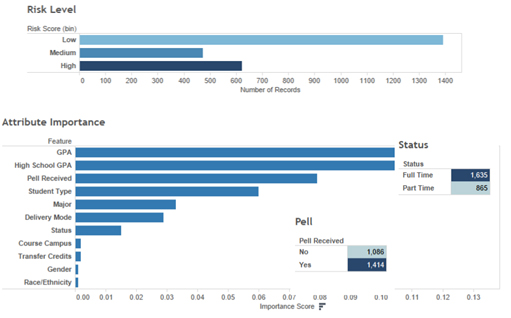
The PAR Framework provides customized, actionable predictive models for participating institutions that identifies student risk in key situations including passing gateway courses with a C or better, earning a certain number of credits at the institution, or returning to the institution during the next course term. The predictive models give member institutions insight into the factors contributing to risk on their campus. See figure 2.

success on a given PAR member campus
What has made PAR's work so immediately useful is that each institution's predictions offer a way to take action on interventions and supports for each partner institution's student segments. While the ability to predict risk associated with each de-identified student in the PAR data set is powerful, knowing what to do to maximize each student's probability for success is even more powerful.
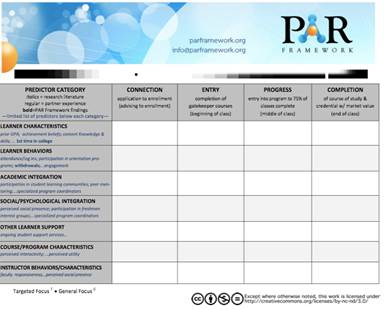
Under the leadership of Karen Swan, University of Illinois–Springfield and Peter Shea, SUNY–Albany, PAR has developed a framework for mapping interventions at points along the student course (and program) completion life cycle. The Student Success Matrix (downloadable from the PAR Framework iData Cookbook page), shown in figure 3, is a powerful means of inventorying, organizing, and conceptualizing supports aimed at improving student outcomes, with a focus of tying student interventions to known student risk factors. Using the SSMX, PAR member institutions contribute and openly share the interventions and student supports currently in use on their campuses, including programs, services, actions, interventions, and policies. The common structure for categorizing and student supports paves the way for truly understanding, measuring and scaling the highest impact tools for improving student outcomes.

Currently, PAR Framework member institutions are participating in qualitative and quantitative field tests and observational studies, measuring the effects of targeted student interventions including peer mentoring and developmental education approaches. The findings of these tests regarding effective interventions for certain pools of students identified as at-risk will be shared within the PAR Framework community and will inform future PAR Framework product roadmaps.
Challenges and Resolutions
Our biggest challenge was working through the process of creating common data definitions that will apply to a broad cross-section of universities. However, the intense level of collaboration required to achieve the goal of developing common definitions set the stage for ongoing sharing and collaborative engagement. PAR is fortunate to have encountered relatively few challenges. We included institutions from across the entire higher education ecosystem to make sure we represented diverse perspectives: public, private, and for-profit institutions; 2-year schools and 4-year schools; competency-based learning institutions, and online institutions. We spent time together to openly discuss similarities and differences. Initially it was intimidating to talk openly with one another about what doesn't work. But despite our different missions and business models, we quickly learned that each of us, all of us, are dedicated to improving student success in our respective institutions. From creating common data definitions and shared student success intervention frameworks, our differences have become strengths. Each institution is openly sharing effective practices, and major stumbling blocks with one another in the spirit of finding better pathways for encouraging student success.
One of the project's significant achievements to date is the publication of shared, common data definitions published under a Creative Commons license. A second major milestone for the project and for higher education is a common framework for categorizing student interventions across institutions and tying those interventions to the literature and PAR institutional experiences of the predictors for academic risk. In July 2013, PAR released its Student Success Matrix and supporting definitions under Creative Commons licensing utilizing the iData Cookbook. The Student Success Matrix is the first step in allowing institutional members to measure the effectiveness of interventions and student supports within and across institutions. Our shared commitment to transparency, openness, and trust, while keeping our focus on improving student success, seems to have provided PAR with a solid collaborative foundation.
Known or Anticipated Impact
Academic risk is a term used to cover a panoply of conditions that are directly and positively correlated to student loss. At present, there is no common, systematic framework for understanding the range of factors contributing to academic risk. This means that there is no common, reliable way to diagnose the conditions that cause a student to fail a class, drop out of a semester, or dis-enroll from an institution. Without a common diagnosis, it is difficult if not impossible to treat the causes of student loss, making many intervention efforts seem as if they are, metaphorically speaking, putting a band-aid on a headache.
Co-author Beth Davis, PAR Framework director, has asserted that:
"Without common diagnoses, it is difficult to agree on treatments for diagnosed problems. Without agreed-upon treatments, it is difficult to measure the efficacy of treatments. If one cannot measure efficacy, it is impossible to scale. Perhaps worst of all, we continue to guess about what really works in student success."
The cross-institutional benchmarking capabilities made possible through institutional collaboration and the aggregated data set help PAR member institutions identify their respective areas of institutional strength and areas for improvement. The combination of institutional outcomes and intervention benchmarks facilitates the conversation about what interventions work, and which indicators we can rely on. The common framework for identifying students at risk and target interventions to improve learning outcomes for students aim support at the point of need. Additionally, by targeting points where interventions will make the biggest impact for specific types of students, institutions benefit from greater efficiency in resource allocation; students benefit by receiving targeted help at identified times and points of need. PAR dashboards offer institutions a highly customized visual representation of how a range of variables' interactions influence student progress.
Beyond the value of the PAR specific data analyses, institutional partners have reported that the that the process of assembing a commonly definted data set gave them the opportunity to do more intra-campus collaborations. PAR partners indicate that they are already applying PAR Framework–derived insights to modify campus policies leading to improved student retention. Some of these insights have led to simple decisions (such as changing an add/drop date to keep students from getting too far into a semester, where credits and financial aid may be at risk). Others are leading to broader points of discussion, such as how institutions must actively plan to address non-cognitive variables leading to student loss.
PAR has demonstrated that it is possible for institutions to openly collaborate on matters of institutional effectiveness and student success. This collaboration has made it possible for the insights revealed through predictive analytics to be shared with institutions regardless of their ability to create those insights internally. PAR has shed light on all the ground to be covered to understand which interventions have the potential to move the needle with the students who can most benefit from additional support. This massive, expanding data set on student outcomes tied to interventions will provide food for researchers at PAR member institutions for years to come.
For More Information
In the EDUCAUSE 2012 presentation "When Learning Analytics Meet Big Data: the PAR Framework," co-author Ellen Wagner joined Pearl Iboshi, Mike Sharkey, and Jonathan Sherrill to discuss and explain the PAR Framework. See the resources for that presentation to learn more.
- Laura G. Knapp, Janice E. Kelly-Reid, and Scott A. Ginder, "Enrollment in Postsecondary Institutions, Fall 2010; Financial Statistics, Fiscal Year 2010; and "Graduation Rates, Selected Cohorts, 2002–2007," NCES 2012-280 (Washington, D.C.: National Center for Education Statistics, 2012); U.S. Department of Education, National Center for Education Statistics, Integrated Postsecondary Education Data System (IPEDS), Spring 2009, Graduation Rates component (Table 33).
- See the "PAR Framework Executive Summary."
© 2013 Ellen Wagner and Beth Davis. The text of this EDUCAUSE Review Online article is licensed under the Creative Commons Attribution-Noncommercial-No derivative works 3.0 license.
