
![New Horizons [The Technologies Ahead]](https://er.educause.edu/-/media/images/articles/2013/10/newhorizons2010.jpg "New Horizons [The Technologies Ahead]")
There is no denying that the chatter around analytics in higher education continues to rise. Analytics runs a close second to MOOCs in the category of "topics one must address at an ed tech conference in 2013." As the Gartner hype cycle has proven time and time again, there's a natural up-down-up function that most new technologies seem to follow. Today, it appears as if we're at the apogee of the analytics orbit and things may soon start to come back to earth.
My focus here is not to confirm or deny the hype. The point is that the spotlight is on the wrong aspect of analytics. All too often, the spotlight falls on the sexy part of analytics—the complex math that has the ability to uncover seemingly simplistic predictions and grab multiple RSS headlines. Whether it is nerd-chic terms like "Monte Carlo Simulation" or multiple re-postings of the "Target Knew Teen Was Pregnant before Her Dad" story,1 this side of analytics builds on the popularity of the Freakonomics, Malcolm Gladwell, and Nate Silver wave in recent years. Even though I don't want to do anything to harm the trend of making math majors look cool, I do think this focus does a disservice to institutions looking to leverage the power of data.
Recent higher education analytics conferences have revealed a dissonance among attendees, who believe that there is valuable information waiting to be unearthed from the troves of data. However, there is no clear place to start and no defined path to follow in the realization of that value. So if the complex math isn't the focus of analytics, what is? I would argue that it is the much less sexy part of the project: the ins and outs—that is, the mundane acts of getting data into one place in order to do the analyses and then moving it out to where someone will act differently due to the information provided.
The Hype
Is there any evidence that the analytics trend has officially hit the storied Trough of Disillusionment on the Gartner Hype Cycle? How about a blog posting by Gartner called "Big Data Is Falling into the Trough of Disillusionment"?2 This fall from grace should be expected, and the optimists look at it as a sign that the Slope of Enlightenment is just around the bend. But how did we get here?
I'd argue that the inflated expectations came from an unrealistic comparison to the use of analytics in other industries. The financial industry has been using complex analytics for decades. It seems only natural to use technical analysis on events that have definitive quantitative measures. More recently, the consumer web space has added to the lore of analytics, with Amazon's "customers who bought this item also bought" acting as patient zero.
Why hasn't this trend taken hold in higher education? I believe it is because measuring output with a single transaction is difficult to do in education. In the financial markets, the transaction is buying (or selling) stock. In the consumer web space, the transaction is clicking on the "buy" button. Unfortunately (or fortunately), there's no "buy" button in education. A student doesn't learn how to add mixed fractions after answering the tenth question. From an analytics perspective, there isn't a simple dependent variable that can be used in the model. There are cases where we can try to predict whether a student will still be enrolled after one year or whether a student will pass his/her current class with a C or better. And there is value in answering those questions. However, such predictions present a much more nuanced problem, with many contributing factors. Focusing solely on the analysis side of the problem can leave the institution wanting and in need of stronger context. This is where the "ins and outs" come into play.
Data In, Information Out
By focusing on the aggregation (the ins) and the distribution (the outs), an institution can get most of the heavy lifting done and then start to realize value incrementally. There is no silver bullet. There is no magic predictive model that, when completed, will answer the one tough question and increase retention by 20 percent. But institutions can set the foundation for good data analysis and then start answering many little questions, each of which will contribute to student success.
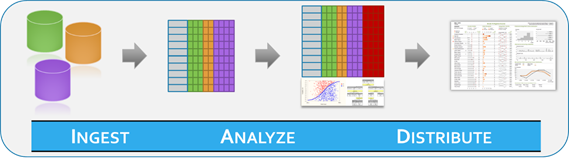
The "ingest" part of the work is aggregation. Rare is the higher education institution that puts all of its data natively in one place. The ecosystem to aggregate includes sources such as the LMS, SIS, admissions, student services and CRM, tutoring, and vendor/publisher content. A good analytics project will likely require data from more than a few of these sources, so aggregation is vital. A common approach is to focus on the analysis and worry about the aggregation later. In this case, the researcher will pull data from all systems onto a desktop machine, run complex analyses using SAS or R or some other statistical package, and come up with interesting correlative findings. The problem is that this approach is done as a one-off research project, and it is not easily implementable as a production system. The right foundation for aggregation might be a traditional relational data warehouse or a data store using a NoSQL system. This now sets the stage for any type of cross-system data analysis.
The "distribute" function involves taking the valuable information that has been extracted from the data and putting it into an application so that it is surfaced to the end user. Surfacing the information might be a red/yellow/green light for students in the LMS or a dashboard for faculty.3 If the institution does not execute on this step, the value will never be realized. A typical scenario today might involve that same researcher who pulled the data onto his/her desktop to run the analysis. The researcher might find incredible results with a predictive model, but those results may show up in an Excel file that has to be generated manually. What the institution needs is a way to programmatically move those results to the user-facing system.
Once the foundation is set for ingestion and distribution, one's perspective on the "analyze" part of the lifecycle changes. In baseball parlance, the institution can now move from trying to hit a home run to being content with hitting lots of singles. The institution no longer has to look for the sole model that will achieve a 20 percent increase in retention. One analytic may get the institution 2 percentage points, and another report may get 1.5 points.
Notice the use of the term "report." If the ins and outs are taken care of, then the definition of analytics changes. There's a spectrum:
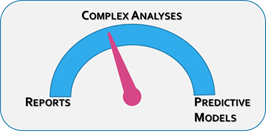
Not every analysis has to involve complex statistics; value can be generated anywhere along this continuum. Simple metrics such as grade-to-date, relative level of engagement, and assignment/attendance counts go a long way toward identifying at-risk students. As an example, the Predictive Analytics Reporting (PAR) Framework found that a simple ratio of the number of courses passed divided by the number of courses attended (the "Rebecca Ratio") had significant predictive power.
The takeaway is to maintain focus on the goal. The goal is not to create a complex predictive model. That may (or may not) be a means to an end. The goal is to improve student success. If that can be done in a simpler fashion, then all the better.
Breaking the Cycle
If there is agreement that focusing on the complex, big-data-modeling aspects contributes to the hype black hole, then how will we accelerate enough to reach escape velocity? The following are a few factors that may help march higher education toward the Slope of Enlightenment:
- Technology. As always, the torrid pace of technology will bring about solutions to help solve one problem after another. On the data side of the equation, high-end solutions like Apache Hadoop have helped to create buzz, and as those technologies mature, they will bring about more solutions. As an example, Cloudera Impala delivers real-time querying to the Hadoop platform. This means that a Hadoop solution might work for "the rest of us" and not just for the Googles and the Facebooks of the world.
- One use case. The feeling of being overwhelmed by analytics should be replaced by the attitude of "let's just pick one case and go with it." If a good data foundation is in place, then an institution can start small instead of betting the farm on an all-or-nothing implementation.
- Business justification. Most institutions are subject to the sword of finance. Diligent institutions will be on the hook for delivering quantifiable results. Although this can be challenging (especially in the realm of pure learning analytics), there is a better chance of showing results through the implementation of multiple smaller analytics initiatives than through large, cross-departmental ones.
Setting a good foundation for analytics means aggregating data in one place and having a means to distribute results to the end consumer. By maintaining a focus on these basics—on the ins and outs—an institution may be able to codify its approach to analytics instead of being sucked into the undertow of the "big data" tidal wave.
- Charles Duhigg, "How Companies Learn Your Secrets," New York Times, February 16, 2012.
- Svetlana Sicular, "Big Data Is Falling into the Trough of Disillusionment," Gartner, January 22, 2013.
- See, for example, Ellucian Course Signals; "Predictive Research Aims to Improve Student Success," Rio News (Rio Salado College), May 24, 2011.
© 2013 Mike Sharkey. The text of this article is licensed under the Creative Commons Attribution-NonCommercial-ShareAlike (by-nc-sa) 3.0 Unported License.
EDUCAUSE Review, vol. 48, no. 5 (September/October 2013)