
Key Takeaways
- Using existing student data and current grade information, Purdue created Signals, a system that gives students early and frequent performance notifications and helps faculty members steer students toward additional campus resources as needed.
- The student success algorithm considers not only demographic and performance data but also data on student effort and engagement.
- Results thus far show that students who have engaged with Course Signals have higher average grades and seek out help resources at a higher rate than other students.
Like other institutions across the country, Purdue University collects huge amounts of data on students and stores it in some warehouse, possibly never to be touched again. Also like other universities, Purdue offers many “gateway” courses — large, usually entry-level courses in which students must demonstrate a level of proficiency (a grade of C or better) to move on to upper-level or later-sequenced courses. Students in these large-enrollment courses rarely know where they stand or what they need to do to succeed in the course.
Our question, then, was how to use the data collected about students, along with their current grade data, in a way that would give them early and frequent notifications about their performance in a class. In so doing, we could point them to various campus resources that could help them successfully complete a course.
Building on a History of Success
Purdue is one of the top 30 largest public universities in the United States, serving more than 72,000 students. Enrollment on its main campus in West Lafayette is approximately 40,000, including students from more than 120 countries and all 50 states. Recognized by the Association of American Universities as one of the nation’s leading research institutions, Purdue continues to focus efforts on increasing student success and excellence in the education it provides. This drive to achieve goals in both areas impelled development of Signals.
The Course Signals System
In planning our system, we considered both the predictive power of data and the linkages between student success and effort and engagement. Then, under the guidance of John Campbell, we developed Signals, a system that takes course management system (CMS; in our case, Blackboard) data into account in predicting whether a student would succeed in a given course.
Course Signals is a student success system developed on a predictive analytic model (see figure 1) that contains elements from the academic technologies and the student information system (see figure 2). The model (1:52 minutes) is behaviorally based and considers student performance, effort, and characteristics. The algorithm runs on real-time data and provides a risk indicator for each student (see figure 3). Using this risk indicator (a red, yellow, or green traffic signal) as a formative guide, faculty members can give students in their courses meaningful feedback, suggesting behaviors that students might wish to change to improve their chances of success, thus placing the emphasis squarely on action.
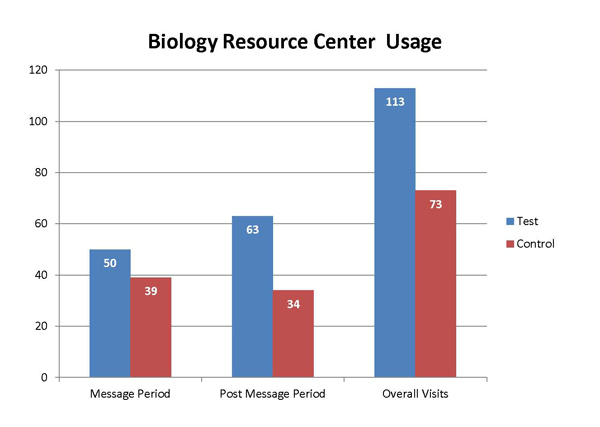
Figure 1. The analytic model
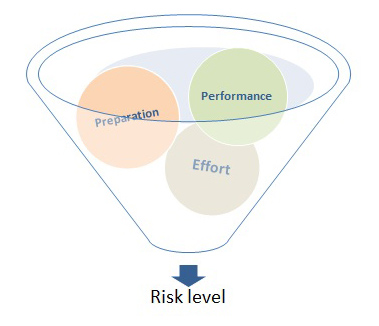
Figure 2. Elements affecting risk
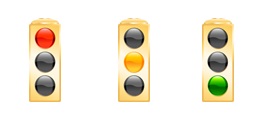
Figure 3. Familiar stoplight risk indicator
Faculty members Larry Deboer, Agriculture; Frank Dooley, Agricultural Economics; and Jenna Seabold, General Studies, explain when they run Signals interventions (2:34 minutes):
Faculty members Jenna Seabold, General Studies; Frank Dooley, Agricultural Economics; and Larry Deboer, Agriculture, explain how long it takes to run an intervention (0:58 minute):
Acquiring Data — and Faculty Support
Initially, our biggest difficulty was the acquisition of data. As a siloed university, different data was owned by different stewards, and compiling all the data needed for the student success algorithm was an uphill battle that took well over a year. However, now that we have achieved this, our most pressing concern is Course Signals implementation.
Over the semesters, we have developed data-derived best practices and effective messaging solutions. The research is sound and the practices are simple; however, getting all faculty members on board with those practices is a challenge. For example, we have found that one of the most effective uses of Course Signals is to intervene early and frequently. The average number of interventions sent within successful courses ranges from 4.8 to 6.2, depending on semester. However, faculty are already carrying intense workloads, and intervening more than two times is not as common as we would like (the overall average is 2.3).
A final challenge we faced was in finding a way to explain to students how their risk indicator was calculated. For this, we created a short video detailing the components of the student success algorithm.
Video explaining algorithm success components (2:16 minutes):
Impact on Grades and Help-Seeking Behavior
Course Signals has produced numerous positive results.1 For example, when grade results from courses using Course Signals were compared to those of a previous semester (same course, same term, same professor), significant differences were found. As Table 1 shows, collectively, students have earned more A’s and B’s and fewer D’s and F’s.
Table 1. Grade Improvements Using Course Signals
| Course | Technology | Grades (Percentage) | ||||
|---|---|---|---|---|---|---|
|
|
| N = | A/B | C | D/F | Withdrew |
| Agronomy | Signals | 78 | 80.77 | 14.10 | 2.56 | 3.56 |
|
| Comparison Cohort | 78 | 69.86 | 23.29 | 4.11 | 2.74 |
| Statistics | Signals | 297 | 56.9 | 27.61 | 13.8 | 1.68 |
|
| Comparison Cohort | 486 | 30.45 | 33.13 | 31.07 | 5.14 |
| Psychology | Signals | 2,263 | 65.16 | 18.22 | 13.69 | 2.93 |
|
| Comparison Cohort | 2,445 | 56.31 | 22.49 | 19.42 | 1.78 |
In the case of trackable help-seeking behavior, students who experienced Course Signals sought help earlier and more frequently than their peers (see figure 4). Anecdotal evidence indicates that students continue this behavior in future semesters. The increase in help-seeking behavior suggests that Course Signals empowers students to become better independent learners. Pattern matrix data suggests that when students do “graduate” (move up) a level — from red to yellow or green or from yellow to green — they rarely fall back into higher risk categories.
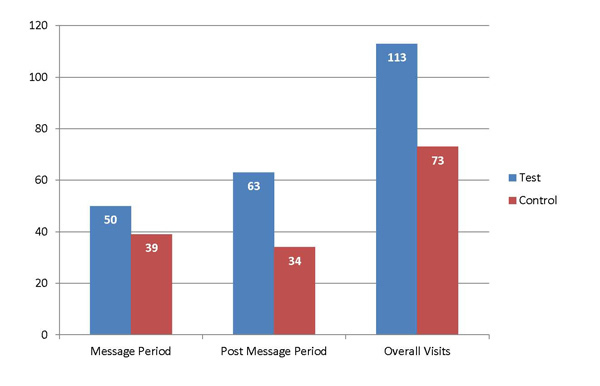
Figure 4. Biology Resource Center usage
Analysis also demonstrates that using Course Signals positively affects student retention (see table 2). Students experiencing Signals at least once in their academic career at Purdue are retained at a rate of 87.42 percent, while their peers who did not are retained at 69.40 percent — a difference of nearly 20 percentage points.
Table 2. Retention Rate after Four Years
| No. of Signals Courses | Cohort Size (N =) | 1 Year (%) | 2 Years (%) | 3 Years (%) | 4 Years (%) |
|---|---|---|---|---|---|
| No courses | 5,134 | 83.44 | 73.14 | 70.47 | 69.40 |
| 1 instance | 1,311 | 96.57 | 94.13 | 89.70 | 86.50 |
| 2 or more | 207 | 97.58 | 98.55 | 96.62 | 93.24 |
The four-year graduation rate has also seen improvement. Of those students never enrolled in a course employing Course Signals, 41.20 percent graduated after four years at the institution. In contrast, 45.27 percent of students enrolled in at least one Signals course graduated in four years, a four percentage point difference. Current research shows that students enrolled in two or more courses using Signals have a four-year graduation rate of 38.65 percent. While the number of students graduating after four years dips for students who have had Signals in two or more courses, we are not alarmed by these results. It is expected that the five-year graduation rate for students with two or more courses with Signals will surpass the other two groups when rates are released in fall 2012 for three key reasons:
- First, Signals is used largely (but not only) in gateway courses. This is pertinent because many times students will bring Advanced Placement credit for these courses or test out of them altogether. Most of the students enrolled in two or more Signals courses have to take these courses because they did not test out of them. This extends their time to degree. It is imperative to note that a larger percentage of the students taking two or more Signals courses are still enrolled for a fifth year of study than the percentage of students taking no Signals courses.
- Second, students often change majors at Purdue; this usually results in an increased time to degree, which is the case for the students here.
- Finally, many of our majors are, by design, five-year programs, which also explains part of the lower four-year graduation rate for students in two or more Signals courses. Overall, preliminary results suggest that Course Signals students graduate sooner, allowing them to enter the work world before many of their classmates (see table 3).
Table 3. Four-Year Graduation Rates
| No. of Signals Courses | Cohort Size (N =) | 4 Year (%) |
|---|---|---|
| No courses | 5,134 | 41.20 |
| At least 1 | 1,518 | 45.27 |
| 2 or more | 207 | 38.65 |
More than 100 courses taught by 162 instructors have used Course Signals to help their students become more successful, and more than 25,000 students have experienced intervention via this student success system. Additionally, faculty, students, and administration have responded favorably to Course Signals.2
Jenna Seabold, General Studies, and Frank Dooley, Department of Agricultural Economics, explain how Course Signals helps instructors (1:00 minute):
Jenna Seabold, General Studies, explains how her use of Course Signals affects her students (1:19 minutes):
Implementing and Scaling Signals
Course Signals proves that learning analytics can be successfully implemented in a scaled capacity. Further, the student success algorithm goes beyond the traditional characteristics of an early warning system and looks at effort and engagement data along with demographic and academic preparation and performance data. Course Signals is commercially available through Ellucian, making it possible for other campuses to replicate our results.
- Kimberly E. Arnold and Matthew D. Pistilli, “Course Signals at Purdue: Using Learning Analytics to Increase Student Success,” Proceedings of the 2nd International Conference on Learning Analytics, ACM Press, 2012 (in press).
- Angela van Barneveld, Kimberly E. Arnold, and John P. Campbell, “Analytics in Higher Education: Establishing a Common Language,” ELI Paper 1, EDUCAUSE Learning Initiative, Jan. 2012.
© 2012 Matthew D. Pistilli, Kimberly E. Arnold, and Matthew D. Bethune. The text of this EDUCAUSE Review Online article (July 2012) is licensed under the Creative Commons Attribution-Noncommercial-No derivative works 3.0 license.