
Key Takeaways
- A current focus at the University of Canterbury is to develop a culture of institution-wide accountability for the attraction, admission, support, retention, and success of students.
- Lecturers are encouraged to become part of the early intervention process and develop skills using this first step of the system so that they can effectively engage with learning analytics.
- LearnTrak software lets lecturers view data on student accesses to resources and activities in a user-friendly graphical form.
- An organization using Moodle can adopt this tool and Canterbury's method of implementation as a first step toward implementing learning analytics.
A current focus at the University of Canterbury is to provide an early intervention process to enhance student engagement, retention, and success. The university is investigating the design and implementation of a system that will draw from its various data sources to achieve its goals. As part of its program to create a supportive campus environment, the university is using learning analytics as a step in strengthening its ability to provide early identification of students in academic difficulty.
Enrollment and Retention Problems
The University of Canterbury, Christchurch, New Zealand, has more than 12,000 enrolled students, drawn from countries around the world. In July 2011, following several major earthquakes and prompted by a sharp decline in enrollments from 2010 to 2011, the university conducted an Enrollment Management Summit. Late in September student retention became the focus, and four working groups investigated topics and developed recommendations on:
- Mentoring, Service Learning, and Work-Integrated Learning
- Process and Area "Handovers"
- Student Engagement and Retention Strategy
- Student Tracking and Early Alert System
One of the primary tasks for the Student Tracking and Early Alert System working group was to recommend ways to develop a culture in which everyone understands that they contribute to the student experience and that there is institution-wide accountability for the attraction, admission, support, retention, and success of students.
The group's working definition of the Student Tracking and Early Alert System is
... a tool for engaging with all students — those identified, or who present themselves, as experiencing challenges during their course of study, as well as students experiencing success. The system is non-blaming and informative to students, and gives academics and support staff the responsibility to work together in order to provide an effective early intervention process to enhance student engagement, retention, and success.
Engaging Lecturers in the Solution
To encourage lecturers to become part of the early intervention process, the working group realized that one of the first steps in implementing a new system had to be to enable lecturers to effectively engage with learning analytics. With a focus on analytics at the most important level — student learning — the Electronic Learning Media team (ELM) chose to first enable interventions at the course level.
For lecturers to implement appropriate interventions at this level, they needed a greater awareness of student activity in all the learning spaces. The data available in the university's Moodle learning management system provided an opportunity for lecturers to observe student activity, but the form in which the data was available was not user-friendly. The problem was how to present all the data necessary to provide a full picture of student engagement within a Moodle course in a way that is both accessible and easy to understand, thereby removing barriers to its use. As a solution, and as a steppingstone to greater lecturer understanding and use of learning analytics data, the e-learning developer at the university was asked to further develop an existing software tool named Gismo. This customized analytics tool, renamed LearnTrak, gives our lecturers easy access to all the information provided within Learn, our Moodle LMS.
LearnTrak lets lecturers view data on student accesses to resources and activities in a user-friendly graphical form (figure 1). Data is available daily in LearnTrak for any combination of students or groups within a lecturer's Learn course, thereby enabling lecturers to better identify students' online behavior.
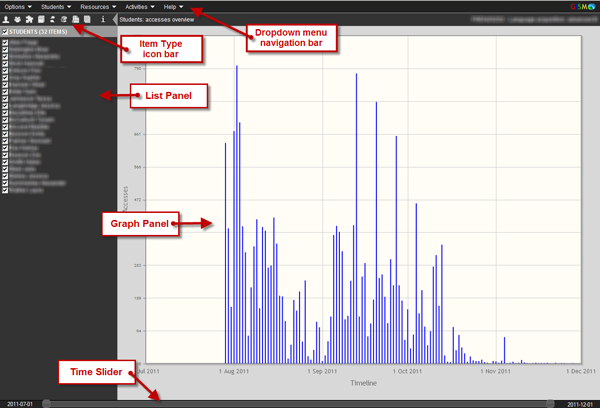
Figure 1. Screenshot of LearnTrak with elements identified
Challenges and Resolutions
The decision was made by the ELM team to develop and implement LearnTrak within the Learn LMS during the summer break. Following the sudden changes and disruption caused by the major earthquakes of 2011, the team did not want to present academic staff with the full-on launch of a new tool just as they were about to start the semester's teaching. Thus a "soft" launch option was chosen, with LearnTrak appearing as a block which cannot be deleted by lecturers, beneath the Course Menu in each Learn course (figure 2), and help documentation that includes all the new features added to the software. This implementation method lets early adopters quietly become familiar with the tool and step up as its champions in their academic departments. At present, lecturers display various levels of interest, ability, and use of our LMS, so a bottom-up approach to the introduction of new technologies holds a greater potential for success. The ELM team hopes that this approach will make collegial support more forthcoming when the use of LearnTrak is advocated more strongly to lecturers, following the completion of additional research.
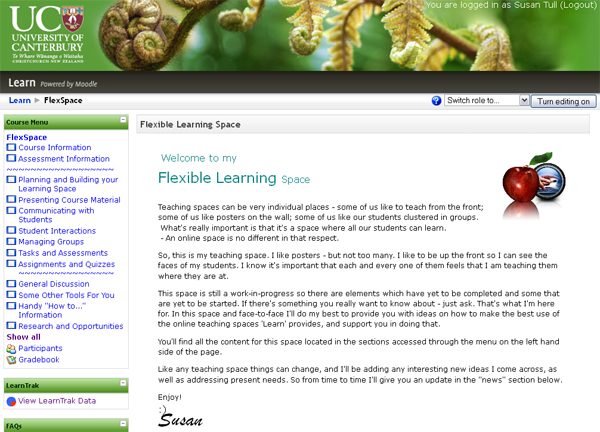
Figure 2. LearnTrak block below Course Menu
To repurpose the original tool for the university's needs, some important changes were required. The most important of these were to increase the range of the Moodle activities that LearnTrak reported on and to provide access to data about groups of students as well as about individuals. More detailed information on the developments needed to make LearnTrak a solution that fulfills the university's needs appears in table 1.
Table 1. Challenges and Resolutions in Refining LearnTrak
| Challenges | Resolutions |
|---|---|
| Some activities unreported | Added the ability to report data on the use of forums, wikis, and glossaries |
| Some resources unreported | Added the ability to report data on the use of Moodle books |
| No visibility of group activity | Added the ability to view student data for students in groups as well as individually |
| Slow in reporting large classes | Updated underlying libraries and triggered previous charts to be purged from memory when generating new ones |
| Increased speed available through the use of the Groups functionality | |
| Some visual aspects unclear | Added the ability to display the strength of activity or results in a new color scheme graduated from positive shades of green, through amber, to negative shades of red |
| Improved the visibility of Tooltips to identify grades or dates | |
| Added icons and adjusted the navigation bar to allow for changes and additions | |
| Changed default settings to use the new color scheme and to not display hidden items | |
| Need to treat teacher data differently | Teacher data no longer included in overview displays |
| Teacher access to LearnTrak now reported in course logs | |
| Inconsistency in reporting assignments | Improved accuracy in reporting all assignment items |
| Implementation and access | Deployed the LearnTrak block in all Moodle course sites as a "sticky block" not subject to deletion by teachers |
| Updated support documentation and added new graphics that reflect all the changes |
A Prezi presentation showing the possible display options, as well as how to use LearnTrak, is available at http://prezi.com/crajsq7l5uog/learntrak/.
One remaining challenge is that students' activities will be recorded only if they engage with the LMS. If a lecturer is not using the Learn site for a course or if a student perceives that the site content is not worthwhile and chooses not to engage with the site, no data will be generated. The Flexible Learning Advisors on the ELM team continue to work with lecturers to address this challenge.
Initial Reactions
Research is under way to determine the influence of LearnTrak on lecturers' practice during this first semester of implementation (February–June 2012). Participants in this research are lecturers from a range of disciplines across all the colleges of the university. A mixed-methods approach combining both quantitative and qualitative data is being employed. The data is being gathered from interviews with lecturers as well as from site activity logs and the interactions taking place within the Learn site belonging to their courses.
While the initial reactions of some lecturers included the words "Big Brother," overall their responses have been largely positive. At the student level, the lecturers see LearnTrak's potential to provide a real-time overview of student engagement within the site. Lecturers have commented on how easy it is now to differentiate between disengaged students, who seldom access the site, and those who are simply "lurking" within the site without openly participating. They think this will help to target students who might need support or a possible intervention to successfully complete a course. Lecturers see access to LearnTrak data on groups of students as an aid in troubleshooting group work, as well as enabling an easier comparison of student cohort behavior. Figure 3 shows an example for investigating group work. One group has been chosen from the list panel, and each day of access to a wiki for the four students in that group is displayed in the graph panel.
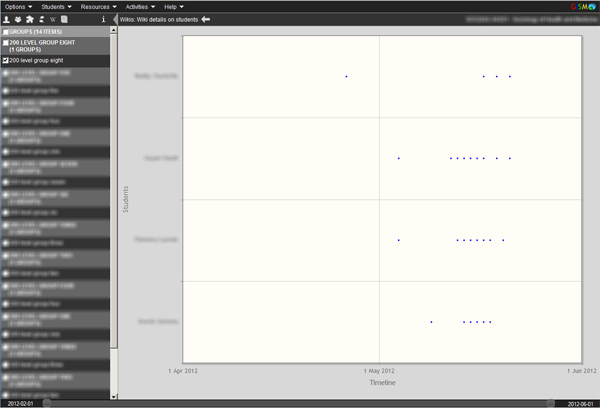
Figure 3. Investigating engagement in group work
Lecturers have noted that it is easier to see patterns of use within their Learn site and that these patterns can be used to determine a drop-off point in a course, ascertain the popularity of a selection of readings, and review the usefulness of optional materials and alternative formats. Figure 4 shows an example of how these patterns appear. As one lecturer put it, "Viewing LearnTrak is sort of [like] taking the pulse of the course and seeing how the pulse is holding at certain points."
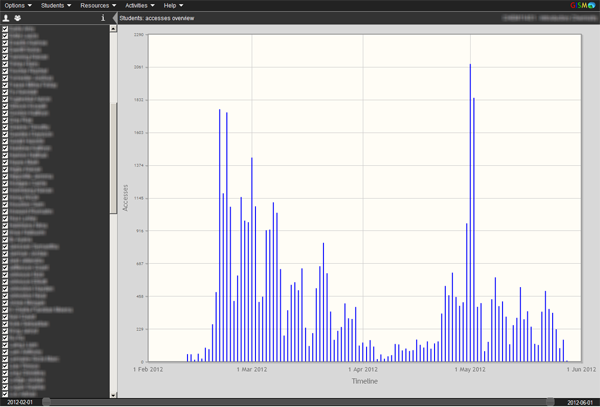
Figure 4. Investigating patterns of course site use
Most of the lecturers in the study were already aware of the limitations of the type of data LearnTrak produces: it tells you what, but not why or how. A student clicking on a resource might not actually read it, and a single click on a resource might result in downloading it once and reading it multiple times. Lecturers so far indicate that this limitation has been more than balanced by the greater ability they now have to identify students at risk and to refine their course materials and their Learn site on the basis of real-time data about student engagement. Figure 5 is an example showing the investigation of student performance. Only the tutorial quizzes have been chosen from all the quizzes in the list panel, and students' color-coded results appear in the graph panel above the students' names on the x-axis. Figure 6 displays student engagement with resources. The different formats in which the lecture content has been made available to the students have been chosen from the list panel, and the number of student accesses is displayed in the graph panel above the resource name on the x-axis.
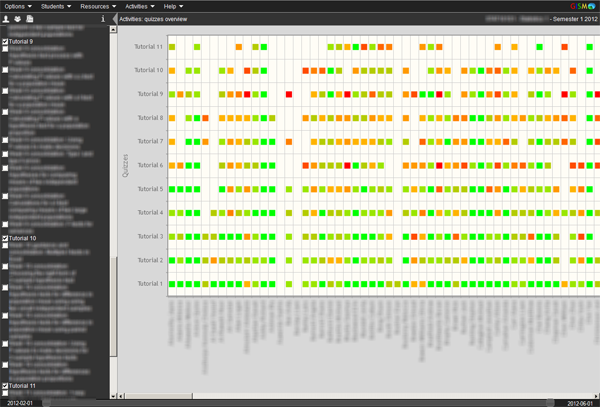
Figure 5. Investigating student performance
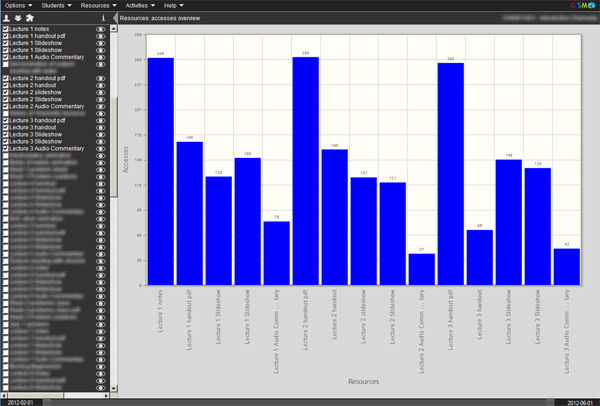
Figure 6. Investigating engagement with resources
Nicki Dabner, a senior lecturer in the School of Literacies and Arts in Education, has found LearnTrak especially helpful in teaching her course Best Practice in Online Teaching and Learning.
Interview with Senior Lecturer Nicki Dabner on LearnTrak (4:15 minutes):
Research Aims
The university's ongoing research aims to produce a body of knowledge on how LearnTrak's easily accessible student data influences lecturer practice. It will provide insight for the group involved in the tool's implementation, develop information for the future implementation and use of learning analytics tools within the university, and offer guidance for the wider higher education community. Practical information on how LearnTrak can be integrated into lecturer practice will also be distilled from this research. The information will be added to LearnTrak's Information Page within Learn to provide lecturers with clear guidance on both its use and its limitations.
An organization using Moodle can adopt this tool and our method of implementation as a first step toward implementing learning analytics. For those interested, the following URL links to the source code for LearnTrak, from e-learning developer Paul Nicholls: https://github.com/MaxThrax/moodle-block_gismo-uc.
© 2012 Susan Tull. The text of this EDUCAUSE Review Online article (July 2012) is licensed under the Creative Commons Attribution-NonCommercial 3.0 Unported License.