
Key Takeaways
- Without the feedback from face-to-face interactions, lecturers using virtual learning environments may find it difficult to identify and focus on students who are struggling in class.
- The Open University uses data from its virtual learning environment to pinpoint students who have an increased risk of dropping out of a class, as well as to study class structure and content with the goal of tailoring the learning experience to each student's unique profile.
- Predictive data can help instructors not only identify "at-risk" students but also use this enhanced feedback to improve the virtual learning experience.
Improving student retention is a key area where many universities can bolster student satisfaction, graduation rates, and make financial savings. To achieve these goals, it is necessary to understand both why and when students drop out, even when they do not make their problems or intentions clear to the lecturer. Post-module analysis can identify general problems with course structure or content that may be rectified for future sessions. In addition, during a session, a number of the failing students could be retained if they were offered appropriate assistance. The problem is how to identify these students in time to help them, even when they do not seek assistance.
The Open University Approach
The Open University (OU), a distance learning institution, is the largest university in the UK with more than 260,000 students and about 7,000 lecturers. The OU has more than 1,200 full-time academic staff and more than 3,500 support and administrative staff. It delivers modules predominantly through a virtual learning environment (VLE).
Without face-to-face interaction with their students, associate lecturers at the OU found it difficult to detect their students' developing difficulties during a module. Moreover, lecturers have limited time and resources and cannot schedule contact with all of their students on a regular basis. As a result, students who could potentially have benefitted from timely tutor contact may fail to progress, having to retake a module or dropping out altogether, thereby costing the student a positive outcome and costing the university money.
The key issue here was how to identify potential difficulties based solely on student data, so that lecturers could be more strategic by targeting interventions towards students who are most in need.
Video of Josie Taylor, Director of the Institute of Educational Technology, on learning analytics at OU (3:12 minutes):
Gleaning Insights from VLE Data
The VLE provides a rich source of information about each learner's online learning habits. Combined with other static data sources, such as the student's performance on scheduled assessments and their final outcome, VLE data has proven valuable in developing predictive models using historical data from different domains (mathematics, business, and arts) to effectively predict which students are potentially at risk of non-completion of their module and would therefore benefit from tutor intervention.
As part of the JISC-funded RETAIN project, the OU has developed and tested predictive models that take into account two kinds of features: students' performance scores for their regular assessments, and their engagement with the VLE as indicated by the number of pages visited on the website.
The study was conducted on three historic data sets for modules which made good use of the VLE. The modules had 7,701 students in total, and in total 5,539,161 VLE accesses were recorded in different activity categories, such as accessing course content, forum activities, and quizzes.
Two classification models were tested: "performance drop" classification and "final outcome" classification. The first aimed to predict whether a student who performed well until a specific point in time (scored above the "pass" level for assessments to that point) would either have their performance fall below the "pass" level at the next assessment, or not submit it at all. The features of this model included the assessment scores and the number of VLE clicks in each period between assessments.
The second model aimed to predict the final outcome of the module for a student in the broad categories "pass" or "fail" while possessing only information about assessment scores and VLE clicks until some given point in the module timeline, such as submission of a specific assessment. The respective features include the individual assessment scores, the average overall assessment from the start until the chosen point, and VLE clicks in the periods between submission dates of assessments. Training and testing were performed with the historical data from three modules using 10-fold cross-validation.
Data from non-clicking students was filtered out because we found during training and testing on the historic data that students who do not engage with the VLE can still achieve good results — either by having used offline materials, or by retaking assessments and exams after previously failing the module.
For both types of models, decision trees were found to outperform other kinds of learning algorithms. The performance drop classifier was able to achieve high precision for all three modules (between 0.77 and 0.98) and good overall accuracy (F-measure between 0.60 and 0.97 for two of them). Figure 1 shows the classification performance for three different courses when predicting the drop in a student's performance at the next tutor-marked assessment (TMA). Performance is measured as precision and recall for the target module ("performance drop expected").
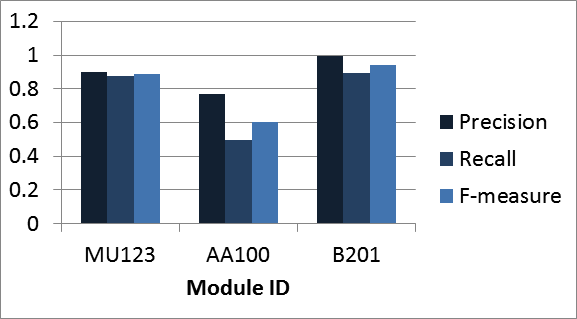
Figure 1. Classification performance in predicting student performance
Interestingly, the number of VLE clicks before the assessment being predicted was found to be the most informative attribute: a student who used to work with the VLE but then stopped is likely to fail the next assessment. Similarly, the final outcome classification model usually achieved high precision (above 0.73 for assessment number 2), which dropped as the assessment number increased. This meant that it was easier to identify students who would drop out at the beginning of a class, rather than those who had already managed to progress further toward the end of the module. Figure 2 shows the classification performance when predicting the final outcome of the course (pass/fail) based on the VLE and TMA data available before assessment 4. The figure shows precision and recall for the class "fail." Again, an interesting result was that VLE clicks were found to be more informative than assessment scores.
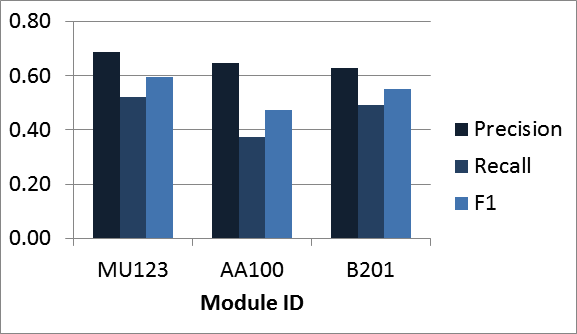
Figure 2. Classification performance in predicting course outcome
A dashboard was developed to pilot the predictive modeling with OU lecturers, in particular the performance drop classifier. They were able to log in to see the data set of their allocated students. The students were listed in a table (figure 3) that could be ordered by selection criteria such as the calculated risk category, which ranges from red (high risk) through amber (medium risk) to green (no risk), which isn't shown in the table as the students are being ordered from highest risk to lowest. In figure 3, each colored dot in the "at risk" column indicates a different type of risk. The dot on the right-hand side is the output of the predictive model for performance drop. In this case, the "final outcome" model was selected. (An admin screen allows some configuration in terms of selecting a model to build and a data set to run it on.) So "red" students, on the basis of their VLE activity to the date given, are predicted to fail the module.
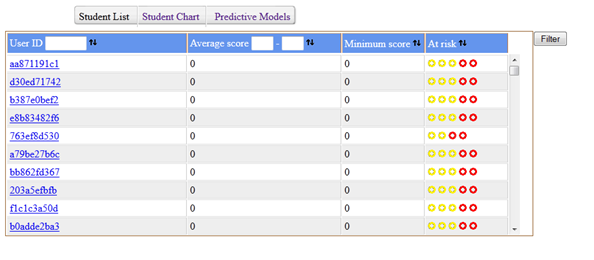
Figure 3. Students' predicted risk across five categories
The lecturer can inspect this data through a clickable pie chart that drills down to different types of risks, for example, if the student has stopped engaging with the VLE, or if they have dropped below a 40 percent average assessment score. This list of risks can be extended to include other types of risk factors in the future. Figure 4 shows the overall pattern of at-risk students across several risk categories. Lecturers can record actions taken, specifically if they have sent an e-mail or made a phone call to the student, which will enable analysis at a later date to discover what types of intervention prove effective.
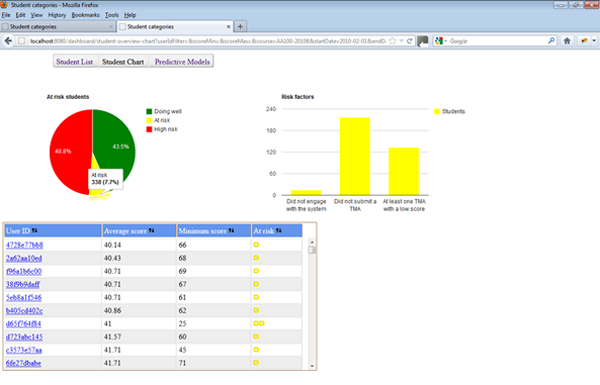
Figure 4. Overall pattern for at-risk students across several categories
Overcoming the Data Challenges
Like many institutions, the OU maintains multiple — and disparate — data sources, with responsibility for maintaining and protecting them divided among several departments; for example, the majority of student data is maintained by IT, but the VLE data is managed by the department for Learning and Teaching Solutions. Locating the appropriate data sources, and then validating the consistency of the data and learning how to interpret it with respect to learners' activities in the VLE and to individual module structures are complex and time-consuming tasks.
The VLE also comprises a very large data set, and not all of this data is relevant to the learning content of the modules. To understand the modules and filter out "noisy" data, a lot of time was allocated to speaking to the data owners and the module managers prior to developing these predictive models based on the historic data sets. As part of initial development, this was conducted as a one-off task, made possible through an externally funded project. For future iterations of development, the university will rely on the data warehouse currently under development to resolve some of the data issues, by making key data available in a central repository and providing a data dictionary that will facilitate use of the data contained in the warehouse. The needs of the predictive modeling tools will be part of the input for deciding what data is included in the warehouse and will need to be updated on a regular basis. The data warehouse is considered a worthwhile investment of time and resources for the OU, since in the much longer term it can be used to support not only the predictive tools described here but also other Management Intelligence reporting aimed to improve strategic planning and save money.
Shaping Functionality of the Data Warehouse
The process of undertaking this work has highlighted many issues related to the importance of data consistency and the need for data warehousing. The effort is helping to shape ongoing work at the OU to develop a data warehouse that will enable the predictive models and similar technologies to form part of the everyday tools that lecturers use to support students. Further developments of the predictive modeling will lead to new data requirements for the warehouse. This warehouse will combine filtered, regularly updated VLE data with other data sources, including the student's assessment data, which will enable full deployment of the predictive modeling tools to give OU lecturers "real-time" information on at-risk students.
The work on the data warehouse is currently ongoing. At the same time there is an initiative to develop a common dashboard for staff to access all the information that they need. The visualizations and functions trialed through the dashboard described in this case study are intended to form part of the tools available for lecturers. This needs to occur before it is possible to properly deploy the technology and start gathering data about how successful the tools are in improving retention. Currently, validation for the approach comes from the results obtained from the historical data, which demonstrate that it is possible to predict students who will fail based on their data combined with other information that has shown in small-scale studies that when making more interventions to students, the interventions do improve retention.
Making Predictions based on Learning Data
These findings have the potential to inform other institutions who are making predictions based on students' learning data, whether VLE activities or other engagement data such as tracking lecture attendance or library-related activities.
The key finding of this investigation has been that a student's behavior on the VLE is generally consistent, until they hit a problem. Students have their own learning profile, that doesn't necessarily match up against any norm. Some students click a lot and achieve very good results; others click very little and achieve the same results. Therefore, better predictive power is gained by detecting changes in a student's behavior compared to their own previous behavior, rather than trying to build a profile of an "average student" as a benchmark. The variability among learners, at least on the VLE, seems too great to make building the profile of the "average student" a viable option.
Other institutions making use of these results would need to identify what forms of engagement they can obtain data for, and then adopt a similar approach of using historical data to find which types of engagement data make the best predictions. Decision trees were found to perform best on the OU data; they provide the additional benefit that it is possible to inspect the model to see which attributes have been used to predict risk. However, different classifiers might prove better on alternative data sets.
It is not only students who are unique. Each module also has a distinct profile that causes learners to act differently from one module to another. The point in a module where students need to be most engaged is very dependent on how it has been structured. It is important to know where these points of engagement are expected to occur and what form they take so that this knowledge can be used to improve prediction.
Future plans will include integrating with the data warehouse as it becomes available, so that the output can be used to inform lecturers using live data. Further development and refinement of the models, for example integrating the module data, will lead to additional requirements for the data warehouse and additional risk categories that must be reflected through the dashboard. With more data being used as input for the predictive models, new visualizations are being investigated that will allow lecturers to view the risk factors that the models have identified as having the most impact in predicting risk.
© 2012 Annika Wolff and Zdenek Zdrahal. The text of this EDUCAUSE Review Online article (July 2012) is licensed under the Creative Commons Attribution 3.0 Unported License.