
Key Takeaways
- This four-part series on successfully establishing a business intelligence program at your higher education institution provides a how-to guide for strategic planning, building the organization, managing work, and marketing your products.
- Building the BI organization requires understanding the institution's needs and creates the opportunity to establish a strong, cohesive team to meet those needs.
- Comparing organizational design activities at the University of Washington and Purdue University revealed common themes: the value resulting from defining roles and structures, assessing skills, and being deliberate about building the culture of the organization.
Whether you are new to the field or a seasoned business intelligence (BI) professional, there are some basics (and not so basics) you need to run a successful analytics organization. In this four-part series, we cover key concepts to help you build, manage, and sustain your BI team. Taking the University of Washington and Purdue University as examples, we share practical tips for establishing your program, strategic planning, building the organization, managing the work, and marketing your products. We also reference industry best practices we have found helpful in building BI organizations at four institutions. Here we continue with a discussion on building the organization.
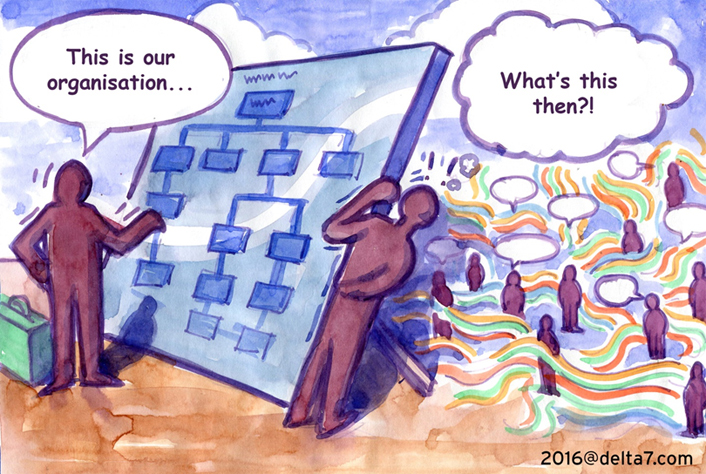
© 2016 delta7. Used with permission.
Building the Organization
Research suggests that certain characteristics define strong organizations and extraordinary teams, including balanced participation from all members of the team and the willingness to make yourself vulnerable and to trust.1 Members of high-functioning teams report that they value a compelling purpose, shared goals, just-enough structure, clear roles, and transparent, efficient decision-making procedures.2 In The Advantage, Patrick Lencioni demonstrates that the more carefully we plan when creating the organization and shaping its culture, the more likely a group is to weather the inevitable challenges that any organization will face.3 BI is no exception. But how do you get there, and why does it matter? Whether building the BI team or a new IT organization, or conducting a reorganization, several key steps can help you position your organization for success from the start.
University of Washington
There are many possible ways to design an organization. There are also many possible ways to conduct the process of designing an organization. How you go about it will depend on the culture at your institution. At the University of Washington, we value context. So when we embarked on redesigning the BI team, we first turned to research. In order to sell any organizational structure we came up with, we needed a good understanding of what had and had not worked for our peers. Relying on subscriptions we had access to, we first collected use cases and best practices by Gartner, the Corporate Executive Board (now CEB), and the Education Advisory Board (EAB). We also tapped into our professional networks and interviewed colleagues at several universities we knew had recently undertaken major reorganizations. From this, we extrapolated key trends relevant to our context. When presenting our recommendations for the new organization three months later, we anchored them in these key themes. Because we had relied on reputable sources and peer institutions, we had credibility from the start.
While outside research was an important first step, we needed more information from inside the UW environment to propose an organizational design for the group. We found four artifacts — produced in an all-day retreat — particularly helpful: a list of change drivers, a map of BI capabilities based on the Data Management Association Data Management Book of Knowledge, a heat map version of these capabilities, and a strategy-on-a-page. These artifacts all provided different perspectives on the context of BI at UW.
- The change drivers, including maximum resource capacity, workforce transitions, and emerging trends in BI technologies, helped us understand why we needed to change right now.
- The capability map showed the core capabilities needed to effectively support the services and products of the BI team now and in the future. Some of these were in place and well established, such as data modeling or operational reporting, but others needed to be established or strengthened, for example master and reference data management, data integration, or data quality.
- The heat map provided an easy way to assess the current state in each of these areas (figure 1).
- The strategy-on-a-page served as the anchor for our future state vision, mission, and goals (see Part 1 of this series).
Together, these artifacts allowed us to identify the roles, expertise, skill sets, and positions needed in the new organization.
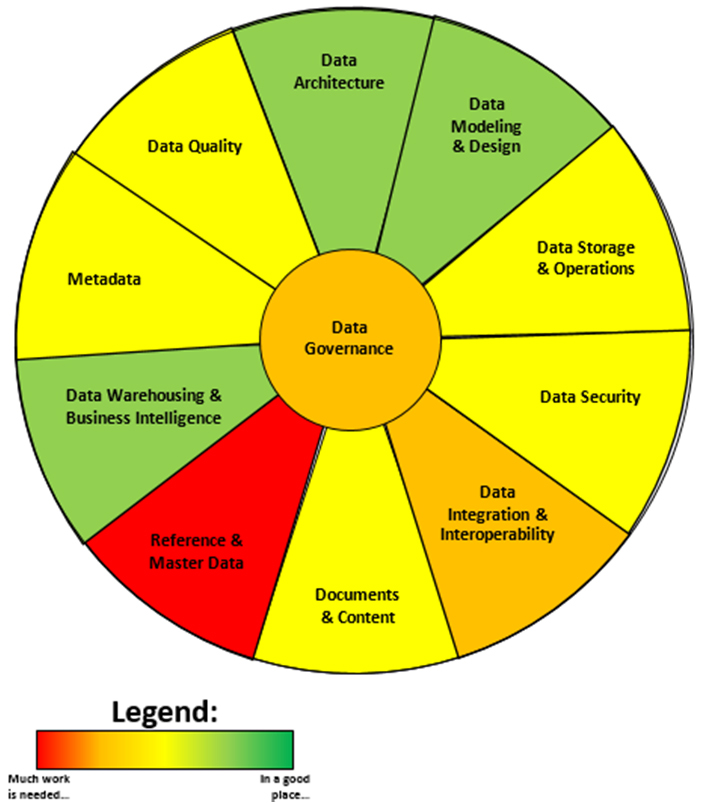
Figure 1. A sample heat map of UW's BI health by area
Determining Organizational Structure
When we combined what we had learned from our research with our own artifacts, we saw some clear themes to address. The following top four issues informed the new organizational design:
- Lack of breadth: The BI team focused primarily on supporting operations through reporting. Of course, legacy source systems commonly provide few or no reporting options, but it meant a relative scarcity of competencies in other types of BI such as advanced analytics. As a result, end users found it difficult to discover, obtain, link, and understand data. We needed to find a way to pivot in order to advance the data culture more broadly.
- Misaligned or multiple visions: Confusion over who made decisions and set direction in which areas established multiple paths forward. This proved especially costly when specialists spent time on work other than their core area of expertise in order to fix a problem. In addition to frustration, this situation caused delays.
- Redundancy: Duplicate, uncoordinated efforts occurred across disparate teams and projects. Work efforts often doubled as teams tried to work collaboratively across organizational boundaries. This led to suboptimal solutions and lost time.
- Untapped innovation: Although the BI team was known for innovation and creativity, innovation and data discovery were not always shared effectively across teams. Sometimes ideas were lost due to communication barriers. Sometimes misaligned discovery efforts led to inefficiencies.
A new organizational design had to reduce redundancy, provide consistency and coordination, facilitate effective decision making, and implement a solid long-term strategy. Now we had all the pieces in place to propose the design for the new team.
The New BI Team
Three teams from across the IT department merged into a single data group with an expanded charge that included data warehousing and BI, data integration (work on an enterprise service bus), and enterprise web services. It also included previously underserved core data management capabilities, such as metadata and end-user tools, release management, and information architecture. So while institutional data previously came in disparate ways from disparate teams within the IT organization, a single team is now in place to provide consistent data in consistent ways to end users and systems.
Distributed reporting groups continue to exist outside of IT, but by focusing on easy access to consistent data, the central IT data group is well-positioned for strong partnerships around common goals.
Lastly, the new group has well-defined leadership roles. And, the leaders share responsibility for the strategic direction of the whole organization.
Building Culture
Cohesive teams don't form overnight. They evolve over time as team members intentionally strive cohesion. As a leader (and member of the team), you can deliberately shape the relationships and culture through team-building events, Liberating Structures like shift-and-share, all-hands meetings, or strengths assessments like Strengths Finder 2.0 or Myers Briggs.
To shape the culture of the BI team at UW several years ago, we conducted a one-day offsite workshop to strengthen the individual relationships within the group, the team as a collective unit, and the interactions of the individual teams within the unit. First the group articulated their definition of an extraordinary team based on their prior experiences. Then they produced a team collage that captured each individual's contribution to the team. Finally, they agreed on and documented team norms. The team collage in particular illustrates how tapping into the participants' creativity and analytical skills provided a strong sense of community and purpose within the group.
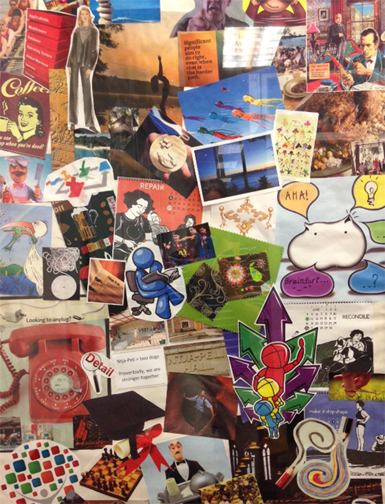
Figure 2. Collage of BI team's individual visual artifacts
Each participant was asked before the workshop to select two to three pictures, images, words, or phrases that they felt best highlighted a particular quality or strength they contributed to the current team. One by one, everyone had a chance to share with the group what they brought and why. The results were stunning! In some cases, we saw echoes of what we knew about our teammates, because we experienced it in our day-to-day interactions. For example, a detail-oriented colleague shared an image of clipping grass with sewing scissors, while a colleague who loves structure brought a picture of a messy pile of rope being neatly rolled up in a coil. In other cases, we got glimpses into personal interests and accompanying characteristics that matter in the workplace: the competitive rower who had won several prizes and thrived on team spirit, and the person who loved to build their own kites and "soar." All artifacts were later combined into a collage (figure 2) as a visual reminder of the skills, strengths, and passions each member contributed to the team. By sharing and becoming vulnerable, the team members had deepened their individual relationships and developed a strong sense of bonding as a group. Hung in a common area, the collage still embodies that bond for the team members who participated in creating it, and it makes new members instantly curious and ready to engage.
What made the activity effective? First, focusing on pictures as visual aids created a "safe zone" that kept individuals from feeling too exposed. Second, clearly communicating the plan for the meeting ahead of time let everyone know what to expect. It got extroverts excited and gave introverts ample time to prepare. Third, thorough planning with lots of brainstorming, storyboarding, and mock sessions meant that everyone on the facilitation team was prepared, too. Lastly, we had a group willing to come along for the ride, move out of their comfort zones, and participate with curiosity and respect for their colleagues.
Lessons Learned at UW
Whether you are building a team from scratch or reorganizing existing groups, you will want to consider the organizational structure in relation to how employees interact in other contexts, such as service management or project roles. Members of the organization must understand how the org chart relates to — and supports — projects, services, and product groups. Pictures are helpful here, such as a diagram of an organizational network that places staff by connections rather than by title and shows how members from across the teams in your org work together on projects. A Sankey diagram (figure 3) can show where (and why) similar roles exist across the organization (EIIA = Enterprise Information, Integration, and Analytics, the official name of the UW organization that includes the BI team). In short, when overlaying the traditional supervisory org structure with the matrixed, organizational, or cross-organizational networks in which we interact, staff will easily find themselves in the different pictures. This can foster a sense of "we're in this together." It gives you as a leader the opportunity to be transparent and to share your thoughts as they went into the organizational design. This ultimately builds trust.
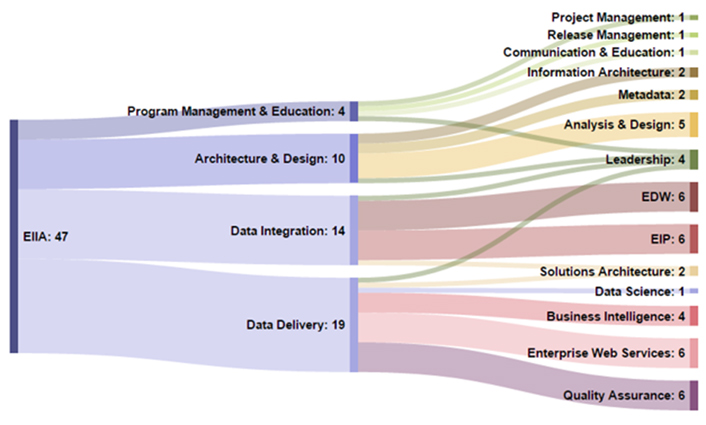
Figure 3. Organizational chart by staff roles
Purdue University
As illustrated by the University of Washington case, designing a BI organization has many different facets, and the areas of focus depend on the organizational context. At Purdue, major steps in the process included defining organizational structure and roles, assessing the skills of the team, and establishing the foundations of our organizational culture.
Determining Organizational Structure
At the time Purdue launched the BI Competency Center (BICC), separate teams supported BI for the two major enterprise resource planning (ERP) systems. One of these teams was embedded in the Business Systems group and the other in the Student Systems group; both were viewed as one of many supports for "their" ERP. While this made sense in terms of the differing technologies, continuing this fragmented approach limited our ability to execute a comprehensive plan for moving BI forward at the institution.
The first major decision in designing the structure of the new BI organization was to combine the two teams into a single organization with a dedicated focus on BI across functional areas. The process involved actively engaging key stakeholders in discussion and carefully considering what we wanted the new BI organization to accomplish. One key consideration was recognizing the strategic importance of BI as a distinct discipline with its own set of customers and stakeholders, its own technical competencies, and its own unique challenges. We also wanted to be able to capitalize on the different strengths of the two teams and take advantage of opportunities to cross-pollinate and share best practices. We also recognized that we needed to engage the highly distributed collection of information producers that were spread across the organization more strategically in order to build an active community that could share and collaborate across functional lines. Finally, we needed to position ourselves to support the goal of building a single data warehouse environment to provide a single source of enterprise data, and to integrate data from across source systems. We were also able to gain some organizational efficiency as we moved from each group having its own manager to having a single manger supervise the combined team.
Another key step in organization design was assessing the roles within the BI team. In many institutions, the small size of the BI teams means there aren't enough people to specialize, and it's quite usual for BI people to perform a variety of different roles. In bigger teams, it's not uncommon to see more specialized roles that might even reside in different parts of the organization with different reporting lines. In some cases, this can actually lead to overspecializing. BI work is often highly iterative, even when we try to apply traditional waterfall methods. Needs emerge and evolve as we talk to customers throughout a project. We learn more about the data as we dig in, uncovering anomalies and gaps. This can create a host of problems when the roles of gathering requirements, modeling the data, and developing the procedures to extract, transform, and load the data are too separate. We were fortunate to have good generalists on the team already, and we chose to continue that model. That flexibility makes it easier to handle the inevitable peaks and valleys of the work and to manage different kinds of projects. It also provides opportunities for members of the team to learn and grow.
Another aspect of our organizational design was defining new roles and realigning people in some key areas. In some cases this meant creating new roles to provide dedicated focus on certain areas, such as community engagement and data governance. In other areas, it was a matter of refining existing job descriptions to better reflect the work people were actually doing, for example with data and BI architecture. In addition, we standardized the job descriptions for our developers, who had a variety of different titles. Wherever possible, we sought the intersection of organizational needs with the individual's skills, talents, and interests. We also needed to add new roles to address particular gaps. This included application administrators to partner with the overall IT infrastructure team to support our BI tools and analysts to provide support and BI tool training.
Like at the University of Washington, another important part of designing our BI organization involved assessing the skills of the BI team. Here we benefited from previous work done within the IT organization to build a "depth chart" measuring the levels of expertise in key areas. We modified and expanded an existing model to reflect the core BI functions, and then asked each member of our team to self-assess their level of expertise on a numeric scale ranging from beginner to expert. Their manager then went over these assessments with them. For each skill, we then added up the total "experience points" across all members of the team. Also, we counted the number of people with at least an intermediate level of skill in each area. This data provides a picture of where the BI team has sufficient depth of expertise and of people and where it doesn't. This has been helpful in identifying professional development opportunities, as well as for succession planning. It also provides perspective on where to focus our limited training resources.
Building Culture
At Purdue, we also took a deliberate approach to building culture within the BI team. For our framework, we chose Patrick Lencioni's model4 from The Advantage of answering key questions to create clarity about why the organization exists, what we do, how we operate, and what's most important. This evolved through a series of discussions with the leadership team, and then was validated with the staff. Figure 4 shows an excerpt from the resulting playbook.
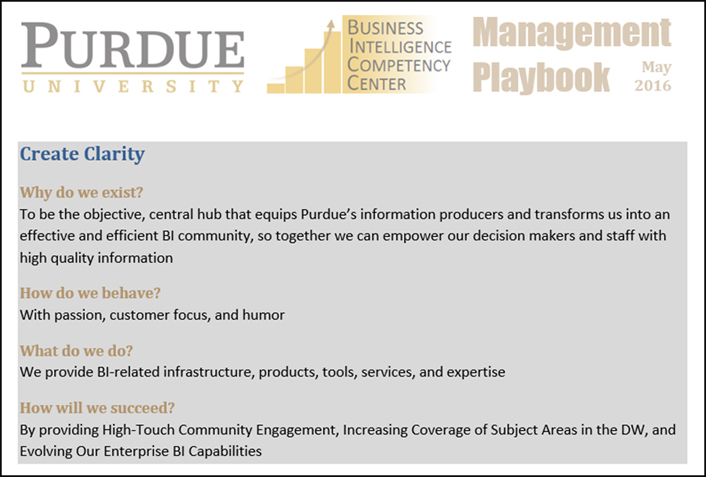
Figure 4. Excerpt on building culture from Purdue's BI management playbook
To create and reinforce clarity within our BI management team around these critical questions, we review this playbook at every one of our weekly management meetings. Rather than just re-reading them, most weeks someone on the team shares a relevant story or anecdote that illustrates how we're applying (or need to apply) the underlying principles.
This process of continually reviewing and applying these answers may seem like overkill, but we have found it fosters a deeply shared sense of who we are as a team and why we're here. The clearer we all are on these points, the more people feel empowered to make decisions that keep us true to our purpose and values. We also frequently use this as a litmus test for places we could engage with the organization and what projects and initiatives we do and don't take on. It also helps us to hold ourselves and each other accountable. In addition, we use the "How do we behave?" answer as a part of our hiring and performance management processes to help ensure we that cultivate our shared values and bring in new people who share them.
Building the BI Organization Summed Up
Let's take a look at the common threads on organizational design between the University of Washington and Purdue University. Three things stood out: both institutions focused on organizational structure and roles, assessed the skills needed, and did not take culture for granted. Both institutions saw value in traditional organizational design while also emphasizing, and taking time for, deliberately forming the culture, values, and norms of the organization. In both cases it was also important to understand the key areas of expertise needed ahead of time. To balance skill sets, recruit, and align resources as effectively as possible required understanding the strengths and weaknesses.
The experience at both institutions also underscored the value of pooling resources and skills to create a single, unified data group within IT. Aside from enabling the team to provide a more consistent end user experience, this also reduced the cost, effort, and time incurred in managing institutional data.
Lastly, we found that organizational design raised awareness of the realities we could not control, such as the labor market or location, both of which will influence the hiring pool.
Although a more detailed discussion lies outside of the scope of this article, please consider two more things:
- One, where BI sits within the institution matters.
- Two, the relationship with Institutional Research is critical.
At both Purdue and UW, the BI team is part of the IT organization, with the CIO reporting into the president’s office. At Purdue, the IR group is also under the umbrella of the IT organization. At UW, IR partners with BI, but reports to the provost. How the BI team aligns with the rest of the organization will determine factors like the scope of influence or visibility within the institution. To maximize both, we think the BI group should be positioned as high as possible within the institution. Where that optimal alignment lies for your campus will depend on the culture, values, and organizational structure of your institution.
Notes
- Charles Duhigg, "What Google Learned from its Quest to Build the Perfect Team," New York Times Magazine, February 25, 2016.
- Patrick M. Lencioni, The Five Dysfunctions of a Team: A Leadership Fable (San Francisco: Jossey-Bass, April 2002).
- Patrick M. Lencioni, The Advantage: Why Organizational Health Trumps Everything Else in Business (San Francisco: Jossey-Bass, March 2012).
- Ibid.
Anja Canfield-Budde is the director of Enterprise Data and Analytics at the University of Washington.
Aaron Walz is the founding director of Purdue University's Business Intelligence Competency Center.
© 2016 Anja Canfield-Budde and Aaron Walz. The text of this article is licensed under Creative Commons BY-NC-SA 4.0.