
Key Takeaways
-
This four-part series on successfully establishing a business intelligence program at your higher education institution provides a how-to guide for strategic planning, building the organization, managing work, and marketing your products.
-
Strategic planning allows us to identify where we should focus our efforts to deliver the most value and help the institution achieve its goals.
-
Comparing BI planning at Purdue University and the University of Washington revealed common themes: the value resulting from framing the discussion, obtaining broad stakeholder input, and producing a simple, easily communicated strategy.
Whether you are new to the field or a seasoned business intelligence (BI) professional, there are some basics (and not so basics) you need to run a successful analytics organization. In this four-part series, we cover key concepts to help you build, manage, and sustain your BI team. Taking the University of Washington and Purdue University as examples, we share practical tips for establishing your program, strategic planning, building the organization, managing the work, and marketing your products. We also reference industry best practices we have found helpful in building BI organizations at four institutions. We begin with strategic planning.
Strategic Planning
A great deal has been written about strategic planning, and many valuable resources are available on this topic, such as the EDUCAUSE ECAR working group paper "New Approaches to Higher Education IT Strategic Planning." Here, we want to look at strategic planning applied to BI and analytics programs in higher education, especially with respect to governance. In this context as in others, one of the major benefits of strategic planning work is the ability and opportunity to shift from a reactive to a proactive approach. Commonly across IT — and BI is no exception — the demand for our services far outstrips our capacity. Information consumers express an increasing demand for more data and more tools. Strategic planning allows us to identify where we should focus our efforts to deliver the most value and help the institution achieve its goals, rather than responding to the most recent request or to the loudest advocate.
For many of our institutions the work of BI is highly distributed, with different stakeholders having differing goals and priorities. Strategic planning can provide formal ways of getting input into strategy and priorities from these different stakeholders. This approach can extend to providing a decision-making and prioritization framework. Strategic planning also serves as the anchor for your work plans, allowing you to connect day-to-day project work with specific strategies. Strategic planning ultimately creates "prepared minds": teams and leaders that adapt well to change because they have practiced the skills necessary to deal with major disruption.1
Strategic Planning at Purdue University
Within the past few years Purdue University launched a new Business Intelligence Competency Center (BICC). Like many institutions, Purdue is highly decentralized, with BI work performed by many different people in both central offices and individual academic colleges or departments. At Purdue, we believe that to be successful, BI must be a collective undertaking. One critical role of this new unit was to work with stakeholders from across the campus to establish a shared vision for the future state of BI at Purdue.
We conducted a variety of activities to engage the campus community in a dialogue about their information needs, challenges, and ideas. This included talking to both information producers and consumers, central offices and academic units, running the spectrum from staff to deans to senior administrators. In addition to many individual and small group discussions, we also held some larger forums. One of these was a BI Advisory Committee we established as a place to bring together the large group of report authors and analysts from across the campus. This group provided an essential opportunity to share information and gather input; just as importantly, it allowed the BI community to share information with each other across units and functional areas. Finally, we held a one-day BI Summit where we brought together the community of analysts and developers along with key academic and administrative stakeholders and leaders.
As we gathered input, a number of key themes emerged that the BICC director and chief data officer synthesized into a vision for the future of BI at Purdue. One key aspect was the need for our distributed information producers to work together as a community; the many report developers and analysts often worked in silos. We also wanted to ensure that our information producers had access to a robust set of enterprise-class BI tools. In addition, with multiple data warehouse environments and data silos, we needed to move toward creating a single, integrated source of enterprise data.
Another key theme was making information delivery more seamless to our decision makers and staff. There were too many different places to go for information, with different central offices producing a wide variety of reports and data sets. Information consumers struggled to identify the resources available and the office to go to for different kinds of information.
We summarized this goal in the following statement and the diagram shown in figure 1:
The BICC is working with our Governance groups and the BI Community to create a future state for BI at Purdue where our distributed information producers work together as a community to make information delivery seamless to our decision makers and staff, empowered by a full set of enterprise BI tools and a single, integrated source of enterprise data.
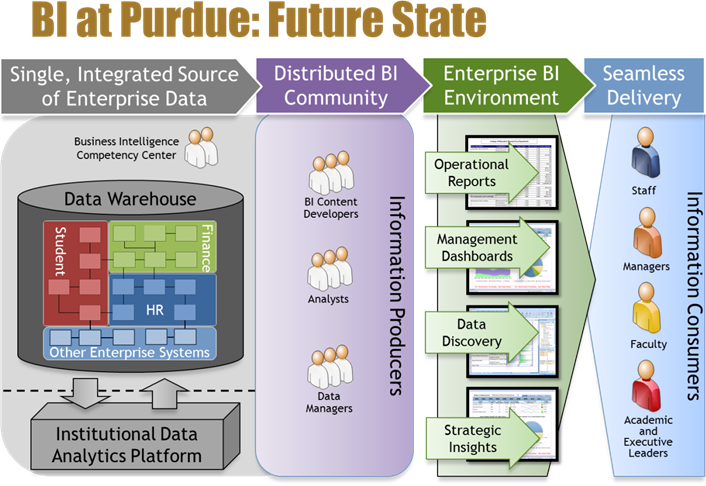
Figure 1. Illustrating the future-state goals of BI at Purdue
Establishing this mission and having a simple way to visually communicate it was essential in building a common understanding of where we wanted to take BI at Purdue. The broad focus and collaborative process used ensured a shared vision reflecting the needs and aspirations of Purdue's distributed BI community. It also reflected an important leadership role for the BICC as the central hub bringing the community together and synthesizing a wide range of input into a single, coherent, high-level vision.
We next worked with the BI Governance group to develop a strategy for the coming year or two. We wanted to develop a shared understanding within the group of where we needed to focus in the near term, which would help guide us in identifying, selecting, and prioritizing BI projects and initiatives, as well as aligning resources across the different offices and functional areas. For this reason and because the committee consists of busy executives who are not BI professionals, we did not try to develop a strategic plan document with a long list of objectives and specific actions. Instead we developed a one-page description of the recommended focus for the near term.
Despite the simplicity of the desired goal, the process required a great deal of deliberate effort. One of the key challenges in developing strategy with a cross-functional governance group is to make the discussion concrete enough that the members can truly engage while still making meaningful choices. A discussion that is too open-ended, too conceptual, or even too detailed makes it difficult for executives with limited BI expertise to participate. On the other end of the spectrum, controlling the discussion to the point where the group only ratifies a predetermined strategy risks missing critical input from the people who best understand the institution's information needs and opportunities.
In striving to find a balance between these extremes, we worked carefully to frame the discussion based on our knowledge of the environment and on the four pillars of our BI vision:
- distributed information producers working together as a community,
- seamless information delivery to our decision makers and staff,
- enterprise BI tools, and
- an integrated source of enterprise data.
We first engaged the BI community in assessing Purdue's current state on each pillar, developing a detailed survey to gather ratings, priorities, and feedback. After compiling this input, we shared it with the BI community via the BI Advisory Committee, where we had large and small group discussions about the results and gathered additional context on what was important to them and why.
Having thus obtained a great deal of information, we compiled, analyzed, and summarized it for the BI Governance committee. We also took some pains to frame the discussion by identifying a set of possible areas of focus for each of the four pillars, as summarized in table 1.
Table 1. BI goals and focus areas
|
Future-State Goal |
Potential Focus Areas |
|---|---|
|
Work together as a BI community |
Data validation and consistency Tool and data training Communication and collaboration Professional development |
|
Seamless information delivery |
Management Dashboards initiative Standard reports development and maintenance |
|
Empowered by BI tools |
Dashboards Data discovery Data extracts and local data integration Statistics, data mining, and predictive modeling |
|
Empowered by enterprise data |
New enterprise data sources Integrated enterprise data sources Simple data sets with applied business rules |
Next we facilitated a robust and wide-ranging discussion within the BI Governance group using the framework. Following the discussion, we wove the key themes into a coherent strategy that describes where we want to focus as we identify and prioritize BI projects and initiatives. This critical step is challenging, but also presents an opportunity for the BI program to provide leadership by synthesizing disparate input from the community and applying specialized BI expertise. The following statements encapsulate this strategy:
Continue to work across all four pillars of our BI Future State vision:
- BI community: training and education are critical and should continue to be a focus, including more advanced training on both the data and tools.
- Seamless delivery: continue to focus on the Management Dashboards initiative and on ensuring high-quality content for both standard reports and dashboards.
- BI tools: continue to focus on supporting dashboard development in Tableau and maturing our dashboard design and validation methodologies.
- Enterprise data: focus on improving consistency and transparency of standard data sets and dashboards by establishing reliable data validation practices and making the underlying data available in the data warehouse environment.
Align our efforts across all these pillars to focus on areas where we are pushing out management information to decision makers via Management Dashboards and the annual percentage rate (APR) data in the Data Digest.
As we pursue this, focus on people and areas most interested in using data to inform decision-making.
Having a clearly defined future vision and a strategic focus has allowed us to prioritize BI initiatives to ensure that we're aligning our distributed BI resources to the same end. It has also enabled us to identify new initiatives that, although needed, weren't on the list of proposed projects.
Strategic Planning at the University of Washington
At UW, the starting point for our strategic planning effort with the BI organization differed from Purdue's in several ways. The top institutional priority for the university, IT, and the BI team was implementation of a new HR and payroll system. This work was expected to consume most of the BI team's staff for several years. Other factors at play included a new enterprise architecture initiative that was gaining momentum with a program, a new director, and a new team. Furthermore, the value and visibility of BI and analytics had increased significantly due to the recent release of new institutional dashboards. Also, the BI team had reorganized into a proper department with a dedicated director. The main purpose of strategic planning, then, was to figure out how the BI team would leverage these changes as opportunities to drive key data initiatives forward. Specifically, how would we turn the new system implementation into a catalyst for raising the bar around data?
Let's look at the process in more detail. To start, we created a sense of urgency by stressing the realities of enterprise resource planning (ERP) implementations and constrained resources and emphasizing the risk, cost, and complexity of BI. As at Purdue, we conducted several kinds of group exercises with the goal of hearing from multiple colleagues at all levels of the organization. At UW we did this not so much to understand priorities and pain points (already pretty well understood) but to gauge the perceived value of BI more broadly in order to assess the possible impact of any strategic plan proposed. These activities included a SWOT analysis with the team and separately with business partners. We conducted a maturity survey that pegged the BI maturity level at UW against the OCU Maturity Model and referenced the TDWI Analytics Maturity framework [https://tdwi.org/pages/maturity-model/analytics-maturity-model-assessment-tool.aspx]. We created capability maps and produced a business model canvas.2 And we conducted many interviews across campus. This multi-pronged approach yielded many different outputs, not all of them tangible, and confirmed that the BI team was in a strong position to drive data maturity at the institution. It also confirmed significant concern across administrative and academic units that the ERP implementations would bring all data progress to a halt.
Armed with this information we conducted an offsite meeting with the core BI leadership team to develop a vision, specific goals, and a roadmap for the next one to two years. The roadmap would have to account for non-negotiable commitments, such as the ERP project, but it would also have to identify those initiatives that advance the data maturity at the institution. For this, quadrant plotting became our method of choice, assessing a set of factors against two variables. For example, we plotted team activities on a spectrum from high to low of the level of enterprise value these activities provided, and on a spectrum from high to low of the degree to which the activities required the unique skill set of the BI team to perform . We then produced a TIME quadrant to plot which activities we thought the team should continue to do and tolerate (T) because of their high value to the enterprise; which areas to do more of and invest in (I); which areas to migrate to other teams or outsource (M); and which areas to eliminate (E) because they yielded little value and were costly. Figure 2 shows a sample quadrant.
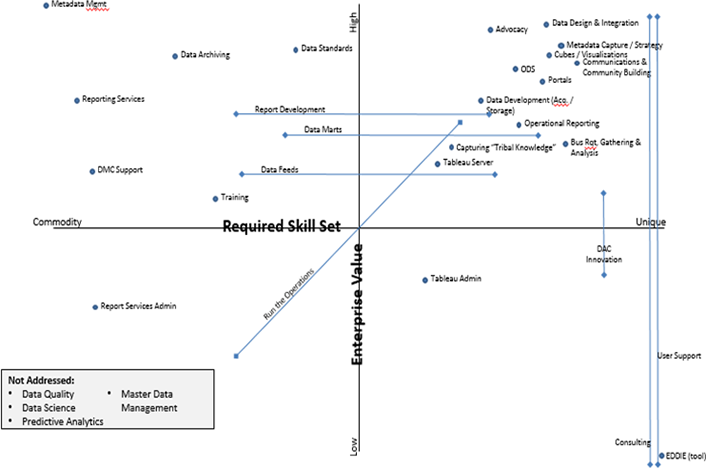
Figure 2. Sample TIME quadrant of activities
Together with the input we had gathered in the previous group exercises and interviews, this allowed us to articulate the future strategy for BI as follows:
We strive to advance the data-driven, decision-making culture through easy integration and fast delivery of well-defined information by prioritizing analytics, promoting innovation, and managing risk.
A clear focus on data integration, data delivery, and metadata allowed the team to develop specific goals for each of these areas. We captured this in figure 3. This picture became the anchor to communicate not only the future-state vision and goals but also the values of the organization, our mission, and core capabilities.
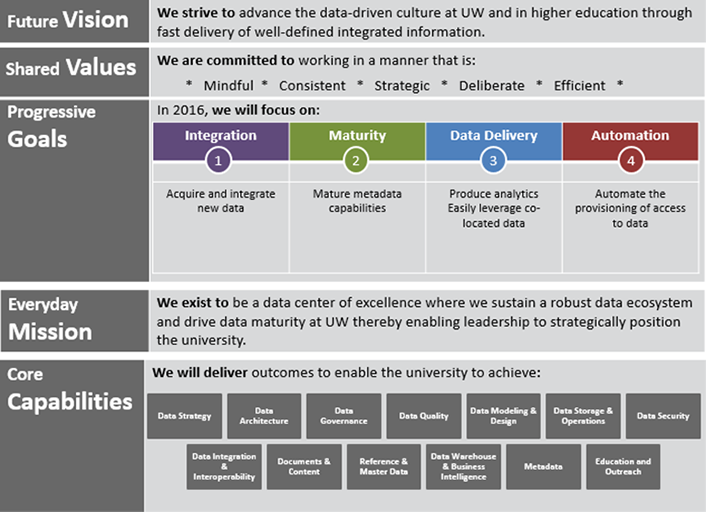
Figure 3. Future-state goals, values, mission, and capabilities of BI at UW
The goals we identified drive data initiatives, of course, but also proved relevant in the ERP implementations. For example, acquiring new data and integrating data and systems efficiently were paramount to the ERP project. By prioritizing work already under way in the context of BI, we demonstrated that the ERP implementation could serve as a catalyst for advancing data initiatives rather than derailing them.
So what was the net effect of the strategic planning process for BI at UW? First, we learned the value of the method behind strategic planning. Laying out a clear process, following that process, and communicating about the process inside and outside of the team increased transparency and trust.
Strategic planning is a process, not an event.
Second, we learned that offsite events offer a useful way of getting a lot done in a relatively short amount of time if they are facilitated, well planned, and include those attendees who truly bring value to the task at hand.
Third, strategic planning significantly improved messaging within the team. By taking existing commitments into account and integrating the vision and roadmap with our quarterly capacity planning process, the BI team gained a solid basis for prioritizing work. The team also had assurance that their work drives UW directly toward our BI goals.
Outside of the team, the new strategic plan gave visibility and focus on our future to senior leadership and stakeholders:
- It emphasized analytics over operations.
- It provided a framework for discussing the cost and tradeoffs of various decisions.
- It gave concise, consistent messaging around the BI team's purpose and vision.
- Finally, it led to much tighter alignment with UW's enterprise architecture.
All in all, the strategic plan provided internal direction to the team and served as a tool for external communication with campus. It provided assurance to the campus that the momentum around data initiatives would continue along with the ERP implementations, and it gave visibility into how.
Strategic Planning Summed Up
As the authors compared notes on what we'd each done and what worked at our respective institutions, we found some common threads. First, we noticed that we had tailored our respective strategic planning approaches specifically to the realities and contexts at play at each of our institutions. For this, we had to understand BI and IT in the context of the institution's culture and priorities. It was also useful to understand trends and issues our executives were tracking relative to their peers at other institutions. We found that altogether this gave credibility to the process of the strategic work as well as to its outcomes.
We also noticed the need to have a strategy to get to your strategy. These are challenging discussions, and a good strategy doesn't just organically emerge from discussion with key stakeholders. It takes careful planning and preparation, and the way the strategy discussion is framed is absolutely critical. Most of our stakeholders aren't interested in engaging in abstract strategy or theoretical discussions. We have to make it concrete while still ensuring they can make meaningful choices about what direction to go and where to focus. At Purdue, the strategy discussion was framed in terms of the four major components of the future-state vision, whereas at UW it was framed using the quadrant plotting approach to assess the value of different kinds of activities in light of the institutional goal of advancing data maturity.
Another key theme was obtaining broad stakeholder input to build a shared vision across the BI community. As Bart Strong wrote, "The objective [of strategic planning] is to get everyone to the same place at the same time with the same information so that group decisions are based on what we all know and all understand. Short cuts aren't allowed."3 Purdue and UW each used a variety of different formats and talked to stakeholders at different levels of the organization. This allowed us to objectively and faithfully represent the many different perspectives and priorities of our BI communities. For leadership, this led to a clearer, shared understanding of priorities. For the BI teams, the strategy helped anchor and align work plans toward common goals.
We also found that we used pictures extensively to communicate the strategy to our campus communities. For both institutions, the goal was to align resources and guide decisions about how to prioritize the work. This was better accomplished with a simple, one-page strategy than with a lengthy strategic plan document. In both cases, we recognized the limited time and attention available from the stakeholders to whom we wanted to communicate the strategy. We needed to be very efficient while still communicating the big picture and how the pieces all fit together. Just as with data, we found that a good visualization can provide viewers with an intuitive grasp of complex issues and relationships.
At Purdue and UW, and we suspect at other institutions as well, setting a BI strategy provides an excellent opportunity for BI program heads to provide collaborative leadership and help drive the process on behalf of the BI community. The specifics of the strategy discussion were very different at our two institutions, yet we both found value in framing the discussion, obtaining broad stakeholder input, and producing a simple, easily communicated strategy.
Notes
- Sarah Kaplan and Eric D. Beinhocker, "The Real Value of Strategic Planning," MIT Sloan Management Review, Vol. 44, No. 2 (Winter 2003).
- Alexander Osterwalder, Business Model Generation (2009).
- Bart Strong, "Strategic Planning: What's So Strategic About It?" EDUCAUSE Review, January 1, 2005.
Anja Canfield-Budde is the director of Enterprise Data and Analytics at the University of Washington.
Aaron Walz is the founding director of Purdue University's Business Intelligence Competency Center.
© 2016 Anja Canfield-Budde and Aaron Walz. The text of this article is licensed under Creative Commons BY-NC-SA 4.0.