A while back, I was asked to teach my department's introductory course. It was called "Weather & Climate" and averaged about 30 students per semester. Over time I changed the curriculum to focus more on extreme weather and climate issues, and I retitled the course "Extreme Weather." Now it averages about 200 students per semester. (Here is a marketing tip: add "extreme" to the title of whatever course you're teaching if you'd like to increase the number of students in your class.) Faced with that many students, I soon realized that I would not know what they didn't know until after the first exam and that my learning management system (LMS) did not provide me any information about what was happening in my classroom.
Knowing enough programming to be dangerous, I created my own system, LectureTools, to supplement what was available in the LMS by providing tools specifically for real-time, in-class use. It is important to point out that this labor of love wound up being far more labor than I had anticipated, something that can lead to consternation from a department chair who understandably expected scholarship in the discipline for which I was hired. But fortunately I had tenure, so oh well.
I found the process of developing this software to be a means for articulating the teaching techniques I use. As others tried the tools, I was able to engage colleagues in a rich discussion of pedagogical methods. Ultimately, I also had to learn about entrepreneurship, since software-development efforts too often become unsustainable if left to research grants. Here the story pivoted to an alien world for an academic—one of finding an amazing set of people who could help develop my naive business ideas into a realistic commercialization plan and land an NSF Small Business Innovative Research (SBIR) grant. In a happy ending, LectureTools was later acquired by Echo360 and has been integrated into its Active Learning Platform, which I can now use in my class without having to worry about the pragmatic issues of payroll and human resources (skills for which a PhD offers inadequate preparation).
My first criterion in creating these tools was that the resulting system must be simple to use. My second criterion was that the system must provide new data that could inform me about what, if anything, the students or I did that affected their learning.
Active Learning . . . with PowerPoint?
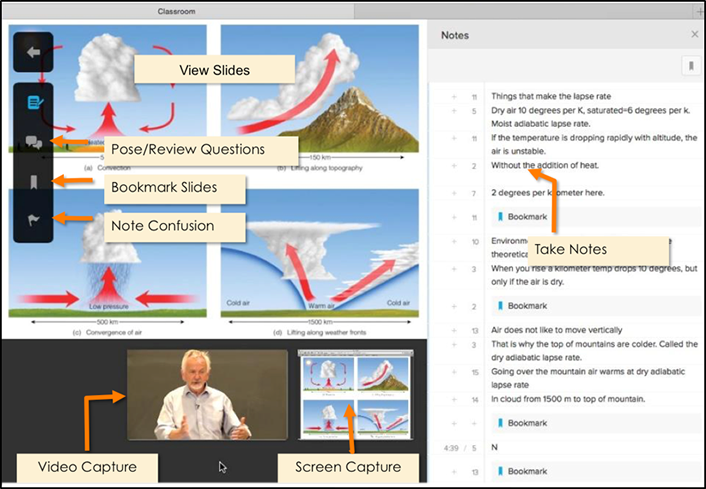
Active learning means different things to different communities and can include a wide range of possible activities. At its most inclusive, it is defined as "anything course-related that all students in a class session are called upon to do other than simply watching, listening and taking notes."1 For example, the Active Learning Platform allows students to answer questions, ask questions, take notes, and indicate confusion (see figure 1), with each action linked to the spot in the lecture video (if available) where the action was taken.

Figure 1. The Active Learning Platform student view allows students to view and bookmark slides and participate by taking notes, asking questions, and indicating confusion.
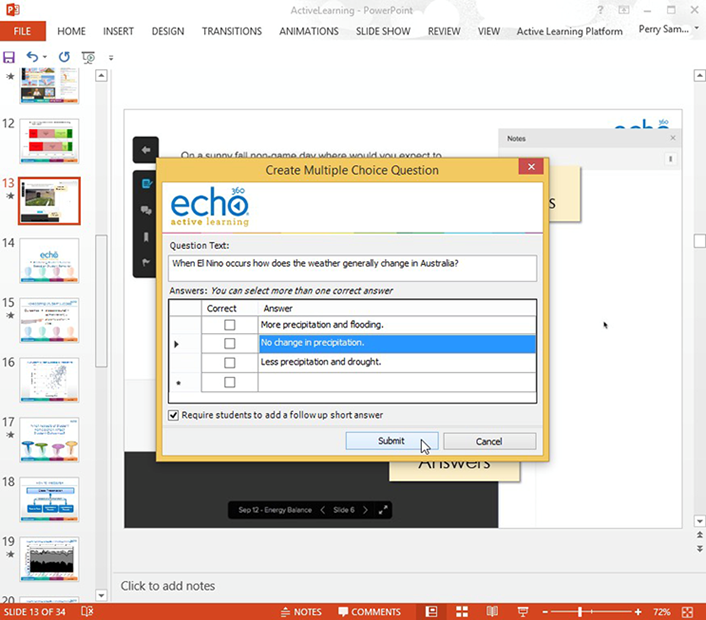
Every instructor who walks into a classroom wants to teach well. But not all instructors have received pedagogical training, and most are juggling multiple tasks in research and service as well as teaching. So to make the leap to active learning as painless as possible, the Active Learning Platform can be run entirely within PowerPoint. The addition of a simple "ribbon" (the strip of buttons across the top of the main PowerPoint window) allows the instructor to pose a range of questions to students and view the results without leaving PowerPoint. Students can also be required to justify their answers (see figure 2). So an instructor can ask a multiple-choice question, show the results of the polling, and click on any of the answers to see the justifications for those who chose that answer—again all within PowerPoint.

Figure 2. Adding a question inside PowerPoint using the Active Learning Platform ribbon. Note how the instructor can indicate that students must enter a justification for their selection.
Online, the instructor can monitor and answer questions from students during or after class and can download data on student participation on a class-by-class basis. It's this data that I find most interesting because, for the first time in my thirty-six years as an instructor, I have a sense of what my students are doing in class. I have merged my data with data from the University of Michigan's Data Warehouse and with independent survey data to explore what behaviors affected my students' exam grades.
How Do Student Behaviors Relate to Exam Scores?
Using the data provided by the Active Learning Platform, I first looked at class attendance. I defined attendance as logging in during class and performing at least one task, such as taking a note or answering a question (or for those who choose not to use technology, submitting a page with their answers from class activities at the end of class). Attendance, defined as such, was not found to be related to students' exam scores, which of course brings into question the value of taking attendance.
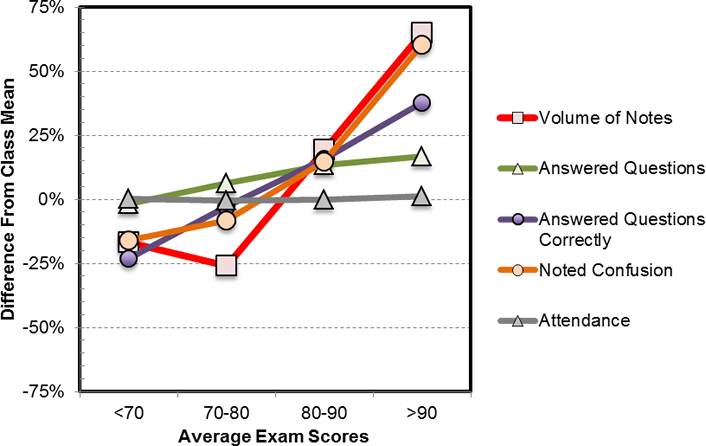
Multiple aspects of active participation, on the other hand, do appear to be related to exam scores (see figure 3). Answering questions posed in class shows some relation, for example, whereas getting the "gradable" questions correct shows an even stronger relation. Other important factors related to students' exam scores were the activities of taking notes, keeping up with slides, and indicating confusion. I hypothesize that these behaviors represent a stronger level of involvement in class since they require the students to actively participate.

Figure 3. The differences in student behavior relative to the class-average behavior in five categories as a function of average exam scores. Students in all the exam groupings exhibited similar levels of attendance, but those who took more notes, indicated confusion, and answered questions tended to get higher exam scores.
How Does Past Success Relate to Student Behaviors?
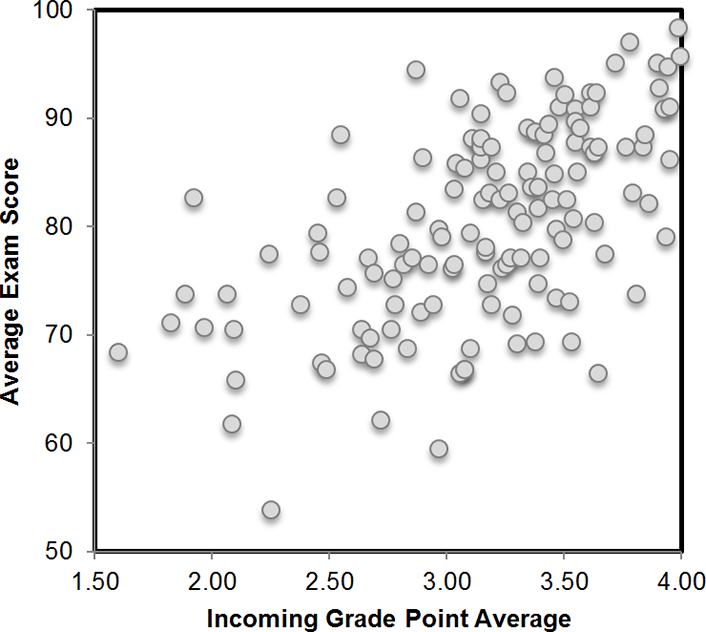
Students' exam scores are often related to students' previous success, most often measured by their incoming grade point average (GPA). For example, in data I collected from the average of three hourly exams in one of my courses (see figure 4), the incoming GPA explained about 24 percent of the variance in grades. This is troubling to me as an instructor because it means that I had little impact on helping those students with poor prior success. On the other hand, this was an opportunity for me to learn how students with different prior-success records behave differently in class. I divided the students into those who entered the class with a GPA greater than 3.5, those with a GPA of 3.0–3.5, and those with a GPA less than 3.0 (see table 1). I discovered that whereas there was little difference in attendance between the three groups, students with the lowest incoming GPA were 18 percent less likely to answer questions in class and were 42 percent more likely to answer incorrectly when they did answer. The largest differences were with taking notes. Students with incoming GPAs less than 3.0 took, on average, four times fewer notes than students with GPAs higher than 3.5.

Figure 4. Scatter plot of students' incoming GPA versus average exam score, illustrating that students with higher incoming GPAs tended to get higher exam scores than those with lower incoming GPAs
| Student Behavior | Incoming GPA | ||
|---|---|---|---|
| >3.5 | 3.0–3.5 | <3.0 | |
|
Attendance |
100% |
99% |
95% |
|
Answered Questions |
100% |
97% |
82% |
|
Answered Questions Correctly |
100% |
88% |
58% |
|
Noted Confusion |
100% |
84% |
33% |
|
Volume of Notes |
100% |
59% |
25% |
Table 1. Differences in student behaviors relative to the behavior of students with an incoming GPA higher than 3.5
General Discussion
Despite having taught for more than three decades, I found this data illuminating and a source of encouragement. In the past when a student came to me for advice on how to do better in class, I was good for the "work harder" speech, but I did not have much more to offer. Today the data gives me insight into what the better students are doing, and I can offer more granular advice to the flailing student. Moreover, I sense that these results are just the tip of the iceberg for what may be found as more data on student behavior becomes available. I have merged the data from the Active Learning Platform with the student information system on my campus, but there are other resources that students use during the semester, including the LMS (Instructure Canvas, in my case), online homework, electronic textbooks, and portfolio systems. I can imagine data from disparate sources being aggregated on-campus for deeper research on student behavior and learning.
The information on how student behavior varies with GPA is also of potential value. An instructor's goal should be to eliminate the linear relationship between GPA and behavior exemplified in figure 4. Data can help instructors and advisors offer more direct feedback to students who find themselves doing poorly. These results do not illuminate why students are taking fewer notes or participating less in class, but they do offer the possibility that these students are not lacking the cognitive ability to do well but instead (and for whatever reason) are lacking the motivation or study skills to be more successful. This data is a step toward identifying which student behaviors should be monitored in class when trying to identify students at risk far earlier in the semester.
The sobering part of this adventure for me is that after all my years as an instructor, I only now have real evidence about what my students are doing (and not doing) in class. As more instructors are able to access behavioral data in their own courses, I hope that consistent patterns will emerge to provide general guidance for academic advisors and instructors and that course-specific patterns will emerge to inform instructors of individual courses.
What's Next?
Seeing that relationships exist between behaviors and outcomes is interesting, but what's the next step? What interventions should instructors use to improve learning for different segments of students? Alas, I fear that the effort required to create this technology and expose these relationships may have been the easy part. The real work comes next.
Choosing to create my own technology to meet a need in the classroom and then negotiating the world of business while maintaining my responsibilities in my discipline bordered on foolhardy. That said, the creation of code was a powerful way to articulate my teaching strategies, and I would encourage college and university administrators to support those who also choose this route. I know I could not have achieved what I have without the progressive entrepreneurial environment of the University of Michigan.
Educational entrepreneurship creates an atmosphere of debate that is healthy for academic institutions. The conversations that erupt from the construction and use of new tools will be both supportive and critical; unfortunately, they are too often lacking on campus. Embedded in these conversations are two questions: What are our beliefs about learning, and which of those beliefs are supported by evidence? That is a debate to be encouraged and rewarded, since it serves the core values of any institution of higher education.
Note
1. Richard M. Felder and Rebecca Brent, "Active Learning: An Introduction," ASQ Higher Education Brief 2, no. 4 (August 2009), 2.
Perry J. Samson is Arthur Thurnau Professor in the Department of Atmospheric, Oceanic, and Space Sciences at the University of Michigan.
© 2015 Perry J. Samson. The text of this article is licensed under the Creative Commons Attribution-NoDerivatives 4.0 International License.
EDUCAUSE Review, vol. 50, no. 5 (September/October 2015)
