
Big Data In Higher Education
I have had several meetings with higher-education institutions over the past few months. All of them seem excited about the potential of applying big data to optimize their operations and improve the student experience. But I've had these conversations before with higher education and after an initial flurry of excitement, the excitement dies down and it's back to business as usual.
Now as my youngest child gets ready for college, I'm starting to get a bit concerned. And the reason for my concern has nothing to do with my child, and everything to do with the university system: colleges seem content to have their undergraduate students graduate in 5 or even 6 years.
To understand the extent of the problem, I did some research at "The Chronicle of Higher Education College Completion" [http://collegecompletion.chronicle.com/table/] website. The site provides data on all U. S. universities and colleges including enrollment, costs, grants, and graduation rates. I performed a quick quartile analysis on only "4-year universities with enrollments greater than 10,000 students" to understand the severity of the college graduation problem. The results can be seen in Table 1.
Table 1: Comparison of University Graduation Rates [http://collegecompletion.chronicle.com/table/]
|
Quartile Analysis |
4-year Graduation Rate |
6-year Graduation Rate |
|---|---|---|
|
Maximum |
87.9 |
97.5 |
|
3rd Quartile (Q3) |
45.5 |
69.6 |
|
2nd Quartile (Q2) |
27.9 |
55.4 |
|
1st Quartile (Q1) |
17.6 |
44.4 |
|
Minimum |
1.0 |
2.9 |
For those that may have forgotten, the quartiles of a ranked set of data values are the three points that divide the data set into four equal groups; each group comprising a quarter of the data. The first quartile (Q1) is defined as the middle number between the smallest number and the median of the data set. The second quartile (Q2) is the median of the data. The third quartile (Q3) is the middle value between the median and the highest value of the data set1.
From the results on Table 1, one can see that the median 4-year graduation rate (Q2) in 2013 was a tepid 27.9% with a 55.4% 6-year graduation rate. That means that after 6 years, only slightly more than half of college undergraduate students are completing the 4-year undergraduate degrees. Even in the top quartile (Q3), performance wasn't very impressive with only 45.5% of students graduating in 4 years and 69.6% needing 6 years to graduate.
There are two big reasons why, as a parent, I am very concerned about these lackluster graduation rates:
- Concern #1: Costs associated with 2 extra years of college
- Concern #2: The growing student debt load
Regarding Concern #1, an article appropriately titled "2 Extra Years in College Could Cost You Nearly $300,000" highlights the financial costs to undergraduate students who do not graduate in 4 years. Taking an extra 2 years to earn one's undergraduate degree can cost students almost an additional $300,000 in tuition and interest on loans, plus the associated opportunity costs of a forgone income and a loss in retirement savings, according to a study from NerdWallet. Table 2 summarizes this total costs associated with one and two extra years of college.
Table 2: Costs of an extra one or two years of College
|
|
One extra year, public college |
One extra year, private college |
Two extra years, public college |
Two extra years, private college |
|---|---|---|---|---|
|
Tuition and loans |
$18,598 |
$26,815 |
$37,456 |
$53,760 |
|
Opportunity costs |
$128.429 |
$128.429 |
$245,253 |
$245,253 |
|
Total cost for NOT graduating in 4 years |
$147,026 |
$155,244 |
$282,691 |
$298,995 |
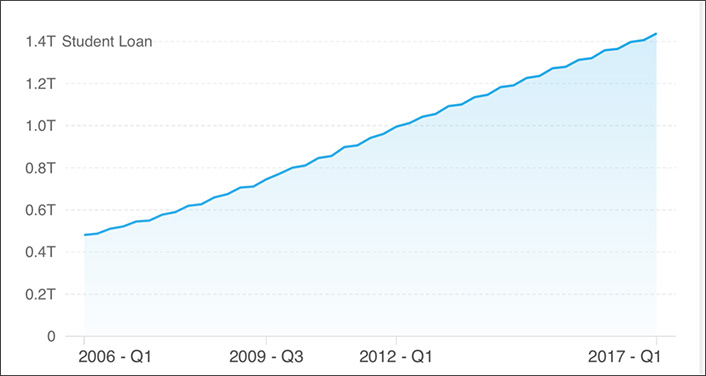
The challenge of taking one or two additional years to gain one's undergraduate degree is accelerating the growth of student debt (see Figure 1).
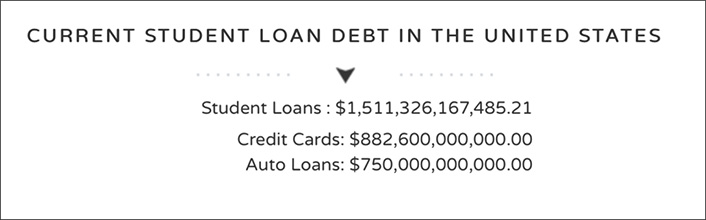
Heck, there is even a real-time student debt clock that shows the cumulative growth of student debt (see Figure 2).
What happened to pushing to graduate in 4 years? Why are universities, students and parents setting the bar so low?
Big Data Impact on Higher Education
Big Data can help universities and colleges address this 4-year graduation rate problem in the following areas:
- Student Acquisition. Are we attracting the "right" types of students given our track record of successful 4-year graduation profiles, the classes and curriculum that we offer, our faculty and social characteristics of our college? We could create detailed student analytic profiles for each graduated student (outcomes against which to run supervised machine learning algorithms being "4 year graduation", "5 year graduation", "6 year graduation", and "did not graduate"). We could then cluster the results and match current and prospective students against known "successful" clusters of 4-year graduates (using something like k-Nearest Neighbor2). We could also create a "4 Year Graduation Likelihood Score" for each student and prospect based upon the cluster profiles and the student's demographic, behavioral and performance data.
- Personalized Curriculums. Can we construct the optimal curriculum for each individual student based upon the student's career aspirations, natural aptitudes, and our mix of classes, courses and faculty? We could leverage detailed student performance and behavioral insights to recommend courses and student-specific curriculums. We could monitor the student's progress against their individual college plan and graduation goals, and leverage prescriptive analytics to make recommendations about what classes to take from which faculty.
- Student Performance. Do we have the programs and resources to effectively monitor, intervene and "course correct" the trajectory of a struggling student? We could identify and score (for level of severity) struggling students based upon performance changes (e.g., homework, quizzes, tests) and behavioral changes (e.g., class attendance, missing meals, change in extra-curricular activities, changes in social activities). We could leverage these scores to recommending extra homework, on-line videos, and personalized tutoring. We could measure the effectiveness of the interventions in improving student performance and ultimately graduation outcomes.
- Student Retention. Do we have the right types of counselors, extra-curricular activities, career advance opportunities and real world work experiences to capture and sustain the interest (and passions) of students throughout their college experience? Do students understand their competencies and interests in order to efficiently identify curriculums and schedule classes in support of their desired degrees? We could flag at-risk students based upon classroom and behavioral changes (via social media and extra-curricular activities), propose different courses and new campus activities, recommend interventions and measure intervention effectiveness. We could create a score for every at-risk student (or every student) that allows the administration to monitor and create prescriptive recommendations for pre-empting developing at-risk situations.
- Faculty Effectiveness. Can we identify faculty, curriculum and/or other on-campus behaviors that predict to graduation problems and dropouts? We could identify and quantify the cost of problem curriculums and courses in order to make "fix, replace or drop" decisions. We could measure the effectiveness of the faculty in increasing on-time graduation and reducing dropouts in order properly compensate those professors.
- Tutoring Effectiveness. Can we predict what types of tutoring, and which tutors, are most effective given a student's classroom, natural aptitudes and social behaviors? We could score the effectiveness of tutoring programs and tutors against a wide range of subject areas. We could then match those tutoring programs and tutors to the unique classroom and behavioral characteristics of each at-risk student.
- Social Impact. Can we leverage social media and other student engagement data (e.g., faculty notes, emails) to predict the 4-year graduation success of each student? We could flag at-risk students more quickly by identifying and quantifying social behavioral changes that might be predictive of classroom performance problems. We could model the social behaviors of freshman that adapt more quickly to college life and use those models to improve recruitment targets.
Summary
Big Data can help universities and colleges improve their 4-year graduation rates, thereby saving students a significant amount of money, reducing college debt and accelerating the student's path to a successful professional career (not to mention that successful college graduates likely donate more to their alma maters and send their children to those colleges as well, but we'll leave that for a later blog).
Achieving a higher 4-year graduation rate may be one of the biggest differentiators that a university could offer prospective students, given the costs associated with spending one or two extra years in college. That might make recruiting the right students (and faculty) easier, which is a win-win for everyone.
Notes
- https://en.wikipedia.org/wiki/Quartile
- k-nearest neighbors (k-NN) classification is used to group the elements in a data set into common or similar collections.

Bill Schmarzo is CTO, Big Data Practice, Dell EMC Services.