
In contrast to top-down strategic approaches to data-driven decision-making, grassroots efforts at the operational level can deliver significant results while using far fewer resources.

As access to data and tools for data analysis become easier, higher education institutions can utilize data to acquire insights and improve various aspects of their organizations, including recruitment and retention of students, optimizing classroom schedule, tracking and measuring student performance, and improving operations and saving cost.1
Regrettably, many institutions have yet to make the best use of data to support decision-making and improvements, even though data-driven decision-making can help improve output, productivity, asset utilization, and market value.2 The benefits hold true for IT service support as well. For example, many higher education institutions collect data on IT support—such as incidents received and resolved each week, month, and year—but few have effectively used that data to make informed decisions.
Data-driven decision-making can occur at either the strategic level3 or the operational level. While data-driven decision-making at the strategic level often requires a carefully considered plan, significant investment, and a top-down approach, data-driven decision-making at the operational level can be a grassroots effort that does not require significant financial or personnel investment. Given this, many organizations can begin to benefit from analyzing existing data even without institutional-level planning and support. Here, we demonstrate how the IT support center in Virginia Tech's Division of Information Technology used data to improve its operation and decision-making.
Background: The IT Context
4Help, part of the Division of IT at Virginia Tech, offers call-based, online, and walk-in IT support to the university's stakeholders, including faculty, staff, students, and alumni. In 2014, the Division of IT adopted ServiceNow as its IT service management system. ServiceNow offers a reporting function that allows users to generate reports on the current state of instance data and communicate the results visually.
4Help was an early adopter of ServiceNow and used it to manage its IT support incidents. 4Help employees were able to easily use the tool to create reports of the operational data, including weekly, monthly, or yearly reports of total incidents, and incidents in various categories. Staff often generated reports for management, without specific goals of aiding the planning process or improving operational or strategic decision-making.
Data and Operational Planning
Data analysis can give organizations insights into their operations; these insights can then be used to take actions to improve business performance. Figure 1 shows the six-step data analysis process that we use for operational planning projects.
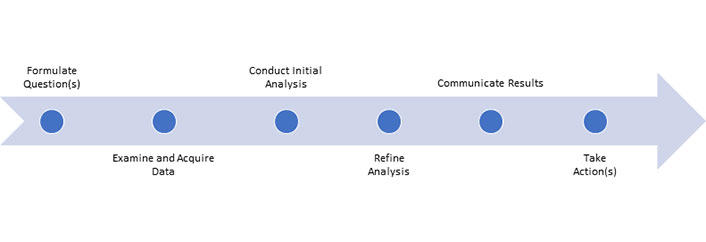
Step 1: Formulate Question(s)
Questions are important in data utilization. As Betsy Reinitz, the Director of Enterprise IT Program at EDUCAUSE, emphasizes: "All the data in the world won't tell you anything unless you know which questions you're trying to answer."4 We further argue that you should ask good questions to get more benefits out of data, and that data is only as good as the question we ask.
Good questions focus on business results. Instead of simply reporting the operational data and stopping there, we should seek to use the data to improve business outcomes. Further, good questions are specific. To answer a particular question, we do not need all the data available to us; a well-formulated question is like a compass that charts our route through the sea of data to help us find only what we need. Finally, good questions often emerge from real business needs.
As an example, 4Help is staffed and operational 24/7. This presents a training challenge: it has been increasingly difficult to get a group of employees to attend training while still keeping the operation running. Although we knew that 4Help received increased support requests at certain times and days, we did not know the exact patterns—that is, which day in a week and which times in a day were busy. Therefore, the question emerged: If we were going to continue offering face-to-face training to employees, is there a good time and day to do so? This question seeks to aid the planning and execution of employee training and points us to the opened time of incidents—a piece of data that ServiceNow collects.
Step 2: Examine and Acquire Data
Once you have a good question, it is essential to examine the data that you already have and find out if it is sufficient to answer your question. ServiceNow tracks important incident data in one location, including user information, incident category and subcategory, configuration item, opened time, and resolved time. The incident opened time gives us the data we need to determine the support-request hourly trend in a day and the daily trend in a week.
Because ServiceNow provided the necessary data for our analysis, we did not need to seek further data. Sometimes, however, you may need additional data for your analysis. In such cases, you need to gather and clean data from different resources to support your selected analysis approach. Because all of our IT support data resides in ServiceNow, which provides basic reporting functions, no data cleaning was required for our analysis.
Step 3: Conduct Initial Analysis
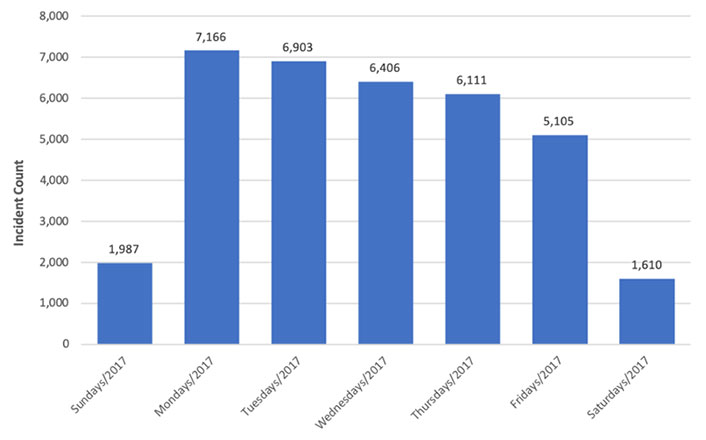
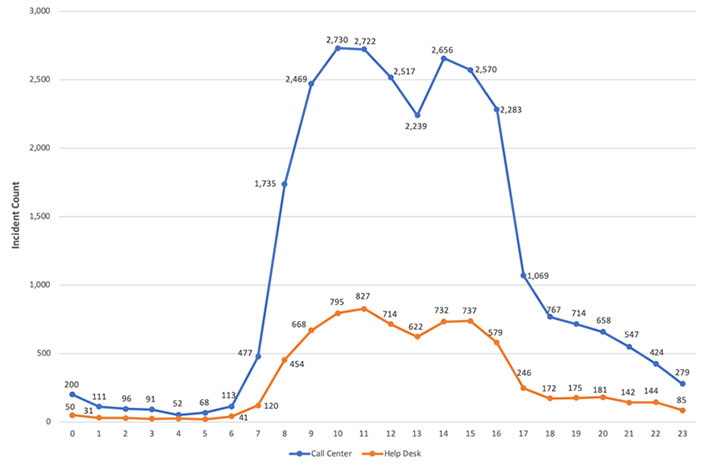
To answer our question, we first conducted an initial data analysis. At 4Help, requests through phone calls were assigned to the Call Center and requests through the online service portal were assigned to the Help Desk. Figure 2 shows 4Help's IT support request trend by day of the week for 2017. Figure 3 displays the IT support request trends at different hours for both the Call Center and the Help Desk for that same year; this let us see whether trends were similar between the two groups.
These figures provided some compelling results. From figure 2, we can see that Monday was the busiest weekday; as the week goes on, the number of support requests gradually decline until Friday, when the workload was only about 70 percent of that on Monday. Figure 3 shows that IT support requests started to pick up at 8 a.m., and then from 9 a.m. to 4 p.m. the request volume stayed steadily high, with a small dip during the lunch hour. This trend was true for both the Call Center and Help Desk, though the Call Center had a much higher volume.
Step 4: Refine Analysis
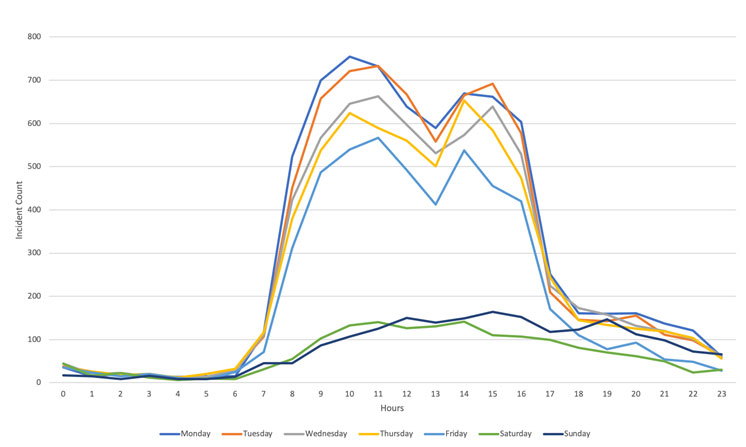
With the above results, however, we still could not confidently claim which hour during the week was least busy and thus an ideal time for training. This is because, even though ServiceNow collected the data we needed, it could not generate the hourly trends for different days in the week. This situation is common in data analysis, as analysis tools may not offer the exact results desired. But, with so many other analysis tools available, it is easy to find a workaround. In our case, we got the hourly incident report for each day in a week from ServiceNow, and then copied each day's data to a Microsoft Excel file. We could then plot the hourly trends for different days in a week, as figure 4 shows.
Step 5: Communicate Results
Oftentimes, data analysts are not the decision makers. To help the actual decision makers better understand the data, data analysts need to determine how best to communication the analysis results so that decision makers are inspired to take actions. Visuals are often used to communicate complex ideas. Good visuals are powerful in that they help people easily digest huge amounts of data. In our case, the visuals helped the 4Help management quickly see the patterns of operational activities.
Step 6: Take Action(s)
The results in figure 4 suggest that Fridays are our least busy day and between 11 a.m. to noon and 2–3 p.m. are roughly equivalent to the slower hours, such as the lunch break, for other weekdays. In the past, our training sessions were scheduled on Monday mornings—the busiest time during the week—which might have contributed to the difficulty of pulling employees off the floor for training. Now, with the analysis results, we can make informed decisions about scheduling our training times.
Beyond the Steps: Getting More Out of the Data
Sometimes we can get additional benefits out of a single analysis. For instance, our time-based trend analysis not only helped us determine ideal training time, but also provided insights into staff scheduling. In the past, 4Help management arranged similar full-time employee coverage for each weekday, while the number of student consultants varied at different times and on different days. Contrary to our analysis results—which suggest the need for more employees on Monday mornings—4Help actually had fewer student consultants on Monday mornings when we experienced the greatest number of support requests. This analysis allowed us to see such gaps and arrange for more students to work during the busy hours.
Strategic Decision-Making
In addition to aiding operational planning, data can also inform strategic decision-making. For example, customer satisfaction is important to IT support centers. Although we can measure customer satisfaction by customer perceptions about the support they receive, we can also measure objective data, such as incident resolution time and our one-call resolution rate.
- Incident resolution time measures the duration of time from when an incident is opened to when it is resolved.
- One-call resolution, also known as first-call resolution, means that a customer's problem is resolved in one call without additional follow-ups. Or, in the case of online support, it means that an incident is solved without being reassigned to another group, without being reopened, or without exceeding the service-level agreement time.
These two indicators are correlated in that increasing the one-call resolution rate can reduce the transfer of an incident within, between, or among different assignment groups, which has the potential to reduce the incident resolution time.
Improving both indicators at the same time often means implementing two different strategic initiatives, which organizations may not be able to afford. In such cases, data analysis can help determine the priority of strategic moves. As table 1 shows, a preliminary examination of the incident resolution time at 4Help showed that, in 2017, more than 96 percent of incidents were resolved during the same day and more than 99 percent of incidents were resolved within two days. While there was still space to improve the incident resolution time, the space was rather limited. Therefore, between the two measures for improving customer satisfaction, we focused on improving the first-call resolution rate.
Table 1. 4Help incident resolution time in 2017
|
Incident Resolution Time |
Incident Count |
Percentage of Count |
|---|---|---|
|
Same day |
34,025 |
96.63 |
|
2 days |
844 |
2.4 |
|
2–5 days |
267 |
0.76 |
|
5–7 days |
28 |
0.08 |
|
1–2 weeks |
23 |
0.07 |
|
2–4 weeks |
8 |
0.02 |
|
1–2 months |
9 |
0.03 |
|
> 2 months |
7 |
0.02 |
|
Total |
35,211 |
100 |
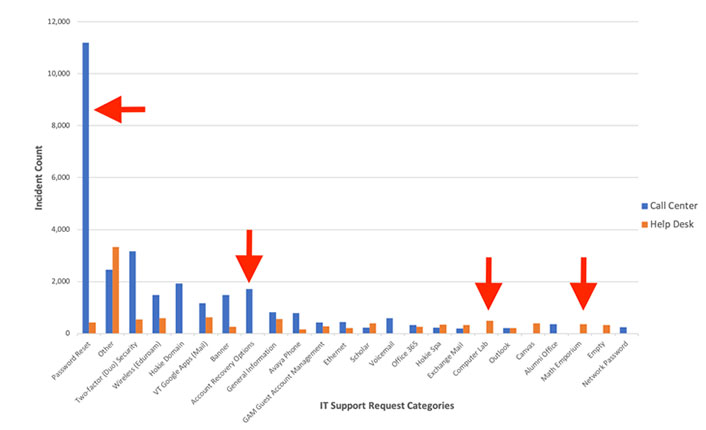
At that time, we were unable to generate a report on the first-call resolution rate, but we knew that there was space for improvement. 4Help was composed of both a Call Center with full-time employees and a Help Desk with undergraduate student consultants. The Call Center employees handled first-tier requests through phone calls, while the Help Desk students processed second-tier support requests that came in through the online support portal. While the two groups had some functional overlap, each group was primarily responsible for specific types of support requests, as figure 5 shows. The Call Center handled most of the password reset and all of the account-recovery requests, for example, while the Help Desk handled all requests related to the computer lab and math emporium.
This setup alone contributed to incident transfer within 4Help, because the Call Center and Help Desk were categorized as two separate assignment groups in ServiceNow. To improve the first-call resolution rate and reduce incident transfer within 4Help, the 4Help managers decided to cross train employees in the Call Center and Help Desk after the two teams—which had previously worked in different buildings that were miles apart—moved to a single location in July 2017. This cross training was intended to enable all employees to cover almost all types of incidents.
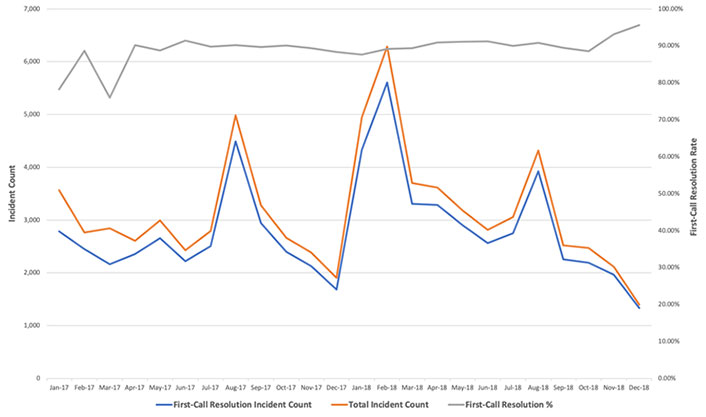
After about a year's effort in cross training, the Call Center and Help Desk merged into one assignment group in November 2018. Figure 6 shows 4Help's first-call resolution rate by month from 2017 to 2018. Even though the results are preliminary (since we have only two months' data since the merging of assignment groups), they show that, for both months post merge, the first-call resolution rate exceeded the highest previous record. While this was a direct result of using one assignment group within 4Help, it was buttressed by the strategic move of providing cross training to all employees. Moreover, our analysis allowed us to verify the effectiveness of our strategic move by comparing before and after data. In our case, cross training and assignment group merging led to a higher first-call resolution rate at 4Help.
Recommendations
A report by IBM Institute for Business Value and the MIT Sloan Management Review showed that one of the biggest challenges that many organizations face in data utilization is a lack of understanding about how to use data analysis to improve business.5 One way to address this challenge is to go head-on—that is, to conduct business result-oriented data analysis and learn from your experience.
Both of our projects were based on real business needs and an interest in solving problems using existing data. Our experiences show that using data to inform operational and strategic decision-making can be a grassroots effort that does not require extensive personnel or financial investment. Based on these experiences, we recommend the following strategies.
Start Small
Data analysis projects do not have to start with grand goals. They can be small-scale efforts that target business needs and do not require comprehensive data. In fact, you can acquire business insights by simply examining existing data and running several reports. This requires neither extensive time investment nor superior skills. In our case, for example, we learned how to report on the first-call resolution rate because the project needed it.
Take Actions
The ultimate goal of data analysis is to address business needs. We should not conduct data analysis just for its own sake. Instead, we should focus on using it to aid various business processes, such as data-informed planning or decision-making.
Provide Training and Support
Although data utilization can start without institutional-level planning, you should ensure that training and support are provided to achieve effectiveness and efficiency, especially when the intention is to scale grassroots efforts to departmental- or institutional-level success.
Summary
While data is not the only source for business decision-making, decisions made without data can be biased or based on false assumptions.6 Based on our experiences, we recommend data analysis efforts that start at the grassroots level. Organizations can begin by improving one area of operation, such as staffing, customer satisfaction, or cost savings. After improving that one area of performance, they can then move on to another area. Also, by starting with existing data, departments can contribute to the broader institutional-level effort of using data to achieve better business results. Over time, using this "start small" approach can create a culture of data-driven decision-making that can drive meaningful, widespread performance improvements across the institution.
Notes
- Phillip Long and George Siemens, "Penetrating the Fog: Analytics in Learning and Education," EDUCAUSE Review (September 12, 2011); and Jennifer Nastu, "Advanced Analytics: Helping Educators Approach the Ideal," eCampusNews (August 31, 2010). ↩
- Erik Brynjolfsson, Lorin M. Hitt, and Heekyung Hellen Kim, "Strength in Numbers: How Does Data-driven Decision Making Affect Firm Performance?" Social Science Research Network, working paper series (April 22, 2011). ↩
- Jerrold Grochow, "Data-driven IT Strategic Planning: A Framework for Analysis," EDUCAUSE Review (June 4, 2018). ↩
- Betsy Reinitz, "Using Information to Drive Meaningful Change: Report from the EDUCAUSE/NACUBO/AIR 2018 Enterprise IT Summit," EDUCAUSE Review (May 21, 2018). ↩
- "Top-Performing Companies Choose Analytics over Intuition for Decision Making," press release, IBM, November 11, 2010. ↩
- Duncan J. Watts, "Scientific Thinking in Business: More than Technology, Businesses Need the Scientific Method," MIT Technology Review (January 22, 2014). ↩
Deyu Hu is Associate Director of Training, Research, and Special Initiatives in the IT Experience and Engagement unit of the Division of Information Technology at Virginia Tech.
Lucas Sullivan is Associate Director of IT Support in the IT Experience and Engagement unit of the Division of Information Technology at Virginia Tech.
© 2019 Deyu Hu and Lucas Sullivan. The text of this article is licensed under the Creative Commons BY-NC 4.0 International License.