
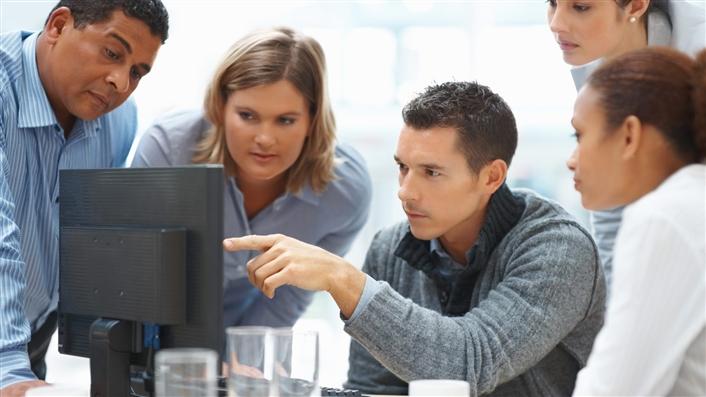
A nonconference brought together diverse people from across an institution to share their experiences with new technologies.
Educational technology is an evolving field, and effectively distributing new tools entails numerous considerations. For higher education, key issues include how institutions can better support their faculty and researchers in
- regularly integrating new applications for research and teaching;1
- making informed decisions about when and how to integrate this technology into their practice, including developing structures to support resource sharing and tool distribution;2 and
- sharing information about technology use with other faculty members and researchers across disciplines.
To address these issues, three faculty-support programs at University of California San Diego (UC San Diego) created and convened a "nonconference"—that is, an opportunity for educators to demonstrate education technology tools and share resources without the formalities and preparation time of a traditional conference. The inaugural event, which was held in the Engaged Teaching offices of the Teaching + Learning Commons at UC San Diego, highlighted tools for teaching and research communication.3
We had two primary goals for the event. First, we wanted to create an environment in which educators could thoughtfully discuss how to integrate low-threshold, functional technology into their teaching and research communication. Second, we wanted to examine how this fertile learning environment could be extended into an ongoing learning community. Here, we describe the nonconference and how we collected data to assess its results, along with our key findings.
Birth of a Nonconference
UC San Diego is a large interdisciplinary research-intensive public university with an international reputation for excellence and for its dedication to promoting discoveries that advance society. The campus spans 2,163 acres; houses more than 36,000 students; and has approximately 4,500 faculty members, postdoctoral researchers, and graduate teaching assistants. Historically, this vast institution has been decentralized, and, despite the institution's commitment to creating a cooperative and entrepreneurial environment, it can be challenging to navigate for educators and students alike.
The idea for a nonconference sparked when one of us (Seethaler) realized that some of her colleagues, who work with faculty to communicate their research to the media, were unaware of the local teaching and research resources related to technology. As a result, her colleagues could not appropriately direct faculty members to those relevant resources or expertise. Realizing a need to address this, Seethaler reached out to the rest of us to collaborate in creating a technology-driven nonconference that would forego the structure of a traditional conference. In place of pre-submitted formal descriptions of their sessions, for example, nonconference presenters simply offered a brief description of the tool they planned to discuss. Also, participants were encouraged to actively engage with presenters during the sessions.
Our organic collaboration resulted in the Apps and Appetizers: Tools for Teaching and Research Communications [https://commons.ucsd.edu/educators/events/appsandappetizers/index.html] event, which was modeled on the 2009 Celebrate Teaching and Learning [https://web.a.ebscohost.com/abstract?direct=true&profile=ehost&scope=site&authtype=crawler&jrnl=15557200&AN=88839049&h=ErkNdB9jC6Zpg0N7Gpi682z92jJKHxmC0bsSLyiiS71SA3TfdobCSemtK2eWU1o1%2bXEpS31QmCge8PUFuywDgw%3d%3d&crl=c&resultNs=AdminWebAuth&resultLocal=ErrCrlNotAuth&crlhashurl=login.aspx%3fdirect%3dtrue%26profile%3dehost%26scope%3dsite%26authtype%3dcrawler%26jrnl%3d15557200%26AN%3d88839049] symposium, which was recreated in 2013.4 More than 100 participants from across UC San Diego attended the Apps and Appetizers event, which featured 41 presentations by educators demonstrating technologies that they found meaningful to their practice. Here, we present key findings from the event and address two questions:
- How can we create an opportunity for educators to engage in meaningful, specific, low-threshold ways to integrate functional technology?
- What are the challenges and benefits of creating collaborative events that have the potential for establishing learning communities?
Creating Community: Theoretical Frameworks
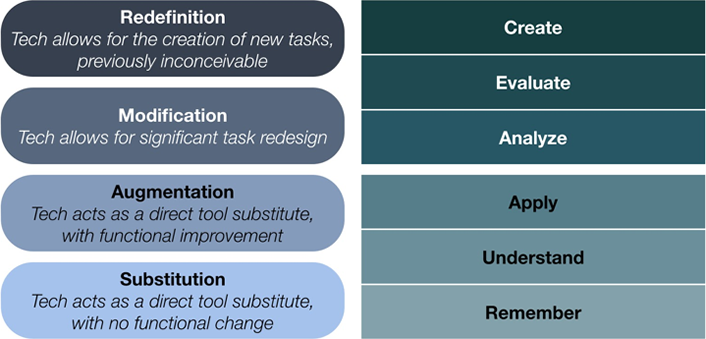
To guide our understanding of how technology is integrated into the classroom and how it impacts student learning, we used Ruben Puentedura's SAMR Model coupled with Bloom's taxonomy.
As the "Classifying Technology Adoption" sidebar describes, the SAMR Model categorizes classroom integration of technology into four stages—substitution, augmentation, modification, and redefinition. According to Puentedura, activities in the substitution and augmentation categories enhance learning, while those in the modification and redefinition categories transform it.5
Bloom's taxonomy is a hierarchy that educators often use to define different levels of cognition. As figure 1 shows, educators can use Bloom's taxonomy and the SAMR Model to scaffold learning, as well as to create an environment that supports deep learning. As students work through the lower levels of both models, they achieve the greater clarity and certainty needed to reach the higher levels. Professional learning communities can align with this coupling approach by offering educators a supportive, collaborative environment focused on student learning and success that also values hard work and commitment.6
Classifying Technology Adoption
The SAMR Model classifies technology integration into substitution, augmentation, modification, and redefinition stages. During the substitution stage, the technology simply replaces the original analogue instrument.* An example here is when a student who uses a pen to write notes on paper replaces both tools with a laptop and uses word processing software instead. Substitution is the nadir of technological integration.
During the augmentation stage, technology facilitates student access to richer learning experiences. Examples here include students finding information online rather than having to visit a library and blind students using screen readers to access content online. Once instructors move into the augmentation stage in their classrooms, students typically experience ease of access to information and greater gains in knowledge.†
In the modification stage, technology is used to redesign the course or lesson. During this process, the instructor can redesign the learning activities that facilitate students' progress through different levels of Bloom's taxonomy. An example here would be students using Google Documents to coauthor an assignment and edit and amend each other's work.‡
Finally, in the redefinition stage, technology is built into course design, giving students access to new activities and tasks that were previously inconceivable. An example from current literature uses virtual reality to give students a 360-degree tour of world cities.
As the literature indicates, integration level is not necessarily tied to the choice of applications. For example, some instructors might use a Keynote presentation on a mobile tablet as a simple chalkboard substitution, while more experienced teachers might use Keynote in combination with iMovie and task their students with creating artifacts for class.** Research shows that, as instructors gain experience with technology, they tend to move their use of it from substitution to modification and redefinition levels.††
Notes
* Simon Hayhoe, The Need for Inclusive Accessible Technologies for Students with Disabilities and Learning Difficulties, John Catt Educational Publishing, 2014. ↩
† Danae Romrell, Lisa C. Kidder, and Emma Wood, "The SAMR Model as a Framework for Evaluating mLearning," Journal of Asynchronous Learning Networks 18, no. 2, 2014. ↩
‡ Ruben Puentedura, "SAMR and Bloom's Taxonomy: Assembling the Puzzle," Common Sense Education, September 24, 2014. ↩
** Geraldine Chell and Sean Dowling, Substitution to Redefinition: The Challenges of Using Technology, HCT Press, 2013. ↩
†† Jace Hargis, Cathy Cavanaugh, Tayeb Kamali, and Melissa Soto, "A Federal Higher Education iPad Mobile Learning Initiative: Triangulation of Data to Determine Early Effectiveness," Innovative Higher Education 39, no. 1, 2014. ↩
Defining a Professional Learning Community
Although the term professional learning community can cover a spectrum of educational experiences, the literature suggests that such communities share four goals:
- Ensure that students learn
- Create a culture of collaboration
- Focus on results
- Emphasize hard work and commitment7
These communities also focus on a shared vision and values, collective responsibility, and reflective and professional inquiry.8 Further, many communities emphasize situated learning, which illuminates how the social context of knowledge delivery and learner engagement can be woven into the learning environment.9
Literature on how professional communities are created presents a mixed history of success. A recent study suggests that many of these communities lack an organizational structure—and thus often lack purpose as well. The research also notes that this lack of purpose and direction often leads institutions to hire outside consultants, who typically offer aesthetically pleasing products that are more concerned with monetary drivers than professional development or student learning.10
Vague best-practices guidelines on how to create an enduring professional learning community contribute to the inconsistent outcomes in this field. To be sustainable, learning communities must be built in a way that both assembles diverse expertise to solve challenging problems of practice and lets each member contribute to the professional growth of other members and the learning community as a whole.
Research universities and other educational institutions are rich sources of individuals with diverse expertise, but bringing together far-flung individuals with common goals requires carefully designed opportunities.11 Finally, despite the challenges of sustaining effective learning communities, researchers repeatedly emphasize the importance of building a learning community rather than on measuring the actual results.12 To address this, we decided to do both, using our nonconference as a launching pad for a professional community at UC San Diego focused on technology uptake and faculty development.
The Nonconference: Measuring Results
We intentionally designed our Apps and Appetizers nonconference using various methods for extracting participant experiences. We then collected data during and after the event to address our two research questions.
We gathered post-event data by analyzing each presenter's session and conducting a follow-up survey. To analyze the sessions, we had six researchers independently code each session's submitted abstract to identify which stage of the SAMR Model the presentation represented. We used four qualitative codes—substitution, augmentation, modification, and redefinition—to capture the presenter's essential research story elements and reflect its broader theoretical lens.
To complement the coded abstracts, we conducted a follow-up survey of attendees, disseminated immediately following the event. The questions were aimed at compiling information about participants' disciplines, knowledge, skills, and dispositions with respect to the Apps and Appetizers event. Specifically, we asked survey participants to list
- an application that they learned about at the event, and
- an application that they learned about and now feel comfortable using in their teaching or research.
To gather affective data, we also included a survey question asking participants how they think and feel about applications now.
We then coded the survey data accordingly to participant comments on four thematic categories:
- the event's low-threshold nature,
- exposure to and learning about integrating technology,
- collaboration or building a learning community, and
- requests for the event to be held again.
We supported this information with supplementary data collection, including video interviews conducted during the event with six participants and four presenters, to provide additional context and feedback. In keeping with the intentionally low-threshold atmosphere, we also asked attendees to write feedback on sticky notes that we disseminated at the onset of the event.
Apps and Appetizers Presenters
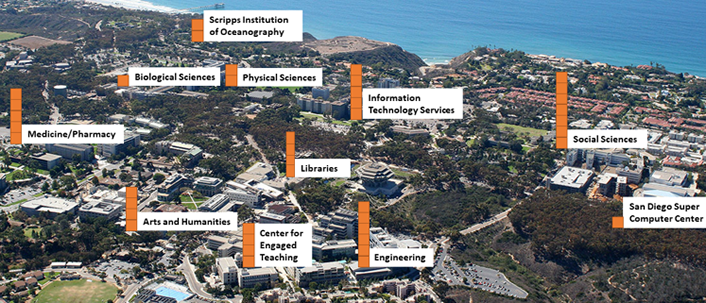
As figure 2 shows, we invited nonconference presenters from all major academic divisions (the arts and humanities, biological sciences, engineering, physical sciences, medicine and pharmaceutical sciences, and social sciences) and from four shared UCSD resources (the Supercomputer Center, the Center for Engaged Teaching at the Teaching + Learning Commons, Information Technology Services, and our libraries). Figure 2's orange blocks represent individual presenters from the associated divisions (one presenter came from another campus and is not shown on the map).
Data Analysis
We used our two research questions to frame our data analysis as follows.
Engagement with Technology
Research Question 1: How can we create an opportunity for educators to engage in meaningful, specific, low-threshold ways to integrate functional technology?
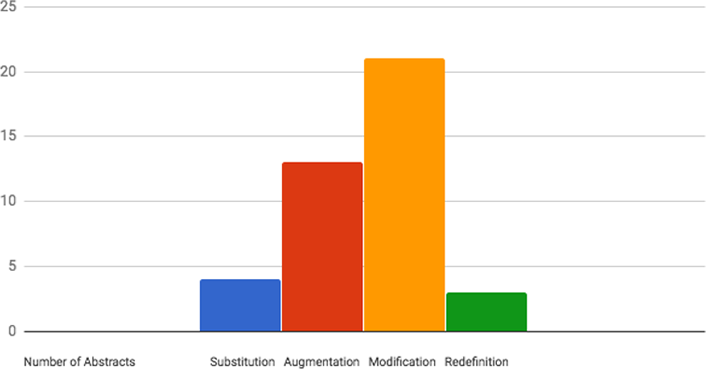
To address this question, we triangulated data from three distinct sources. First, we analyzed the presenter abstracts, which provided insights into the technology shared at the event. Using the SAMR Model as our framework, we coded the abstracts from the 41 presentations to determine the technology distribution across the four integration levels. Figure 3 shows the results.
In addition to our SAMR abstract analysis, we surveyed the event's attendees about the applications discussed—specifically, we asked them to list one application they learned about, and one application that they feel ready and comfortable to use after the nonconference. We received 26 responses for each prompt, mentioning a total of 15 and 17 different applications, respectively.
The vast majority of the responses (96%) listed tools from abstracts coded in the SAMR Model's augmentation or modification categories. This suggests that participants best connected with tools that were beyond a substitution but not quite at the redefinition level.
As figure 3 illustrates, 83% of presenters provided abstracts on their topics that reflect augmentation or modification stages; we therefore analyzed the survey responses normalized to the total number of applications in each category and still found a clear preference for applications in the augmentation and modification categories. We found a 5.5-fold difference when comparing augmentation and modification abstracts to those in the substitution and redefinition categories.
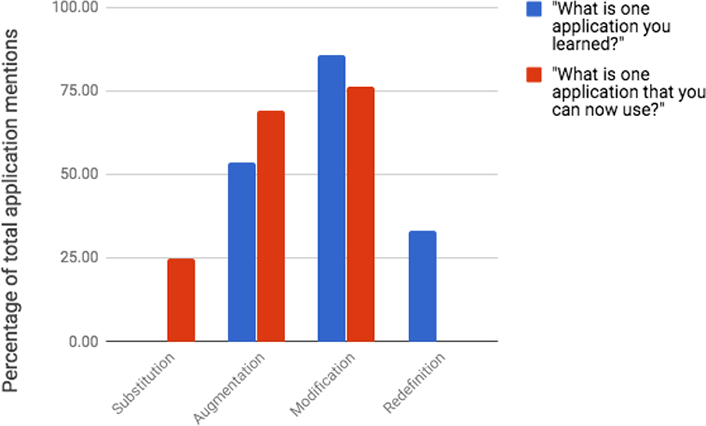
Next, we examined survey responses to see which applications participants felt they had learned and found a 1.9-fold preference for learning applications in the modification and redefinition categories. When asked about an application they can now use, we found a slight preference (1.1 fold) toward the substitution and augmentation categories. Table 1 shows the survey findings, and figure 4 shows total percentages by SAMR Model category.
Table 1. SAMR application categories for presentation abstracts and survey responses
|
|
Substitution |
Augmentation |
Modification |
Redefinition |
|---|---|---|---|---|
|
Total applications in abstracts |
4 |
13 |
21 |
3 |
|
What is one application you learned? |
0 |
7 |
18 |
1 |
|
What is one application that you can now use? |
1 |
9 |
16 |
0 |
|
Applications mentioned by name (learned applications) |
0 |
6 |
8 |
1 |
|
Applications mentioned by name (usable applications) |
1 |
5 |
11 |
0 |
Survey participants also responded about the range of tools and their interest in them. One participant noted, "It was great to see the variety of tools and how people are using them," while another said, "I liked the format of the event and the variety of applications." Two participants alluded to the event's low-threshold nature:
"Great opportunity to learn from one another and share best practices without too much prep since we are all very busy. Little risk, big reward!"
"I really liked the gathering and how it was hands on, low stress, and easy to meet people from many disciplines and levels across campus!"
This feedback affirms the importance of creating an informal environment that required minimal preparation for presenters. We also received five distinct survey responses expressing a desire for more-frequent nonconferences, including one that said, "I hope you repeat it a few times a year." The onsite video interviews and sticky-note feedback during the event echoed this sentiment as well.
Engagement with Colleagues
Research Question 2: What are the challenges and benefits of creating collaborative events that have the potential for establishing learning communities?
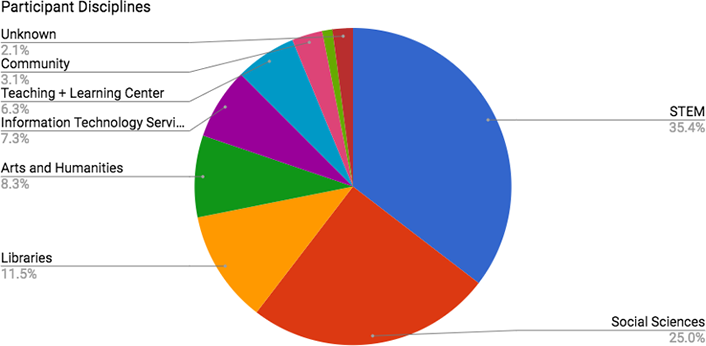
To address this question, we examined our presenter and participant data along with feedback from event attendees and organizers. In terms of presenters, 40% came from science, technology, engineering, and mathematics (STEM) disciplines, almost 10% came from arts and humanities, and approximately 20% (including one presenter from another campus) were in the social sciences. The remaining 30% of presenters were primarily affiliated with three centralized resources:
- The Center for Teaching, which focuses on the pedagogical benefits and challenges of using technology
- The Educational Technology division, which provides technical expertise, equipment, and services, especially in the area of video production
- Our libraries, which provide a variety of services, especially in the area of scholarly communication, including the creation and mining of digital archives
Our focus on tools for teaching and research communications was an effective topic for bringing together people from multiple disciplines with diverse expertise to share experiences and learn from one another. Of the participants, 44% were faculty, 37% were staff, and 19% were graduate students. Figure 5 shows a breakdown of event participants, including the presenters, which broadly reflects UC San Diego's discipline breakdown.
Attendees' survey comments indicate that they valued the opportunity to make connections with far-flung colleagues they would not otherwise have met on such a large research campus. The following participant comments reflect this sentiment:
"It was great to meet some new people and make connections that I wouldn't have made otherwise."
"This was a nice way of learning from colleagues and an opportunity to network without feeling the usual pressure associated with networking events."
These comments on the benefits of the event's interdisciplinary nature were underlined by the fact that the tools that survey respondents said they learned were presented by people from all across the campus. Thus, the event succeeded in bringing together experts from across divisions and centers, and participants not only appreciated this diversity, but they also learned from it.
Creating such a successful collaborative event with a varied array of participants did not result from a simple passive call for participation; indeed, it required a considerable time investment on the part of each of our units. Each of the organizing units sought to recruit faculty presenters with diverse backgrounds and interests. To achieve such a broad mix, we took an individualized approach to engaging with faculty members across our diverse and sprawling campus.
Creating Engagement
The results from our two research questions—one focused on engagement with content (in this case, technology), and the other on engagement with colleagues—point to a tight link between these two aspects of engagement. That is, creating an environment in which individuals will learn from one another depends both on the existence of something meaningful to learn, as well as knowledgeable others from whom we can learn it. Given this, it is clear that this kind of event offers a "sweet spot" for engagement by focusing on several key factors.
Interdisciplinary Interaction
The vast majority of presented tools were not tied to a specific discipline; as a result, regardless of the presenters' discipline, their experiences were potentially relevant to an array of teaching or research communications. This helped us avoid the situation in which colleagues were merely listening to each other to be polite but with no practical end goal. Such situations, while common, are unsustainable given the many competing demands on faculty members' time.
High Presenter/Audience Ratios
Approximately 40% of our attendees were also presenters, so the presenters in one session were often audience members in other sessions. This high presenter-to-audience ratio creates a dynamic in which knowledge is distributed among members of the event community rather than residing in the heads of a few experts.
Showcase Format
A technology showcase is a safe space in which to admit a lack of knowledge. Further, with the technology landscape growing daily, there is no shame in admitting to ignorance about a tool. These factors made it easy for our attendees to engage in learning without feeling the need to save face in front of their colleagues.
A Focus on Breadth and Depth
Our event's format was aimed at offering a balance between reach and depth of interaction. At one end of the format continuum are lecture-style events. Such events let you reach large numbers of people but do not offer much depth of interaction. At the other end are small learning communities that work together over extended time periods. This allows substantial depth of interaction but little opportunity to reach out to new colleagues. Our event offered a happy medium. Feedback and survey responses from presenters and participants showed that it brought together colleagues from across the campus, while observations at the event showed sustained one-on-one and small-group discussions. Finally, our survey data indicate that participants learned from others about technology.
Bringing Teaching and Research Together
Professional support for teaching and research communications tends to be separate, particularly at large research institutions such as UCSD. However, there are considerable advantages for both in sharing expertise and resources. For example, communications directors are often completely unfamiliar with pedagogical tools such as student response systems, so they tend to underutilize these tools in their research communications. They could use smart phones, for example, to solicit ideas in real time from public audiences to personalize their experience, much as an instructor might do in an undergraduate classroom.
Also, because we had diverse presenters and perspectives, event participants were able to see the versatility of tools in ways they might not otherwise encounter. As one participant put it, "Some of the tools were even inspiring with regard to new ways of conducting research in addition to their potential use in the classroom."
Growth Opportunities
Our analysis suggests that participants came away with tangible, applicable knowledge (such as tools they could immediately use) as well as aspirational ideas (such as initial insights into tools for future use). We learned from the SAMR Model analysis that immediately usable tools typically ranged from those in the substitution to modification categories, with the bulk falling evenly into augmentation and modification. Further, as far as tools learned, those also fell into a range of categories (from augmentation to redefinition) with most falling under modification. This suggests that our participants had a desire to use tools in a transformational way, even if they were not yet ready to do so. Given that the literature shows that people may progress from substitution to modification and redefinition, our event offered participants an important professional growth opportunity.
Hosting a Nonconference: Recommendations
The challenges we face at UC San Diego are not unique to our institution, and our approach to hosting a nonconference can be easily replicated. Indeed, we found three elements to be key to our event's success, and all are achievable regardless of an institution's size or focus:
- Engage organizers from distinct campus entities.
- Establish a topic with a broad interest base.
- Structure the event so that presenters have minimal preparation requirements and participants can circulate and participate throughout the presentations.
Our ultimate goal for this first nonconference was to spark a learning community. To fully realize this community, we plan to offer future opportunities to foster and sustain supportive environments that encourage faculty to share effective practices and applications that support teaching and research.
Notes
- Veronica Diaz, P.B. Garrett, R. Kinley, John F. Moore, Celeste M. Schwartz, and Pat Kohrman, "Faculty Development for the 21st Century," EDUCAUSE Review 44, no. 3, 2009. ↩
- A.W. Bates and Gary Poole, Effective Teaching with Technology in Higher Education: Foundations for Success, Jossey-Bass, 2003. ↩
- This program was supported in part by a grant from the Gordon and Betty Moore Foundation. ↩
- Cathy Cavanaugh, Jace Hargis, Stephen Munns, and Tayeb Kamali, "iCelebrate Teaching and Learning: Sharing the iPad Experience," Journal of Teaching and Learning with Technology 1, no. 2, 2013: 1–12. ↩
- Bates and Poole, Effective Teaching with Technology, 2003. ↩
- Richard DuFour and Rebecca DuFour, Learning by Doing: A Handbook for Professional Learning Communities at Work, Solutions Tree Press, 2016. ↩
- Ibid. ↩
- Louise Stoll, Ray Bolam, Agnes McMahon, Mike Wallage, and Sally Thomas, "Professional Learning Communities: A Review of the Literature," Journal of Educational Change 7, no. 4, 2006. ↩
- DuFour and DuFour, Learning by Doing, 2016. ↩
- Thomas Guskey, "Planning Professional Learning," Professional Learning: Reimagined 71, no. 8, 2014: 10–16. ↩
- Ibid. ↩
- DuFour and DuFour, Learning by Doing, 2016. ↩
Sheena Ghanbari is the Associate Director of the Engaged Teaching Hub at the Teaching + Learning Commons at UC San Diego.
Sherry Seethaler is the Director of Education Initiatives in the Division of Physical Sciences at UC San Diego.
Paul Hadjipieris is an Instructional Designer at the Engaged Teaching Hub at the Teaching + Learning Commons at UC San Diego.
Erilynn T. Heinrichsen is an Instructional Designer at the Engaged Teaching Hub at the Teaching + Learning Commons at UC San Diego.
Jace Hargis is a Clinical Professor and Inaugural Director of the Center for Teaching at New York University, Shanghai China.
© 2018 Sheena Ghanbari, Sherry Seethaler, Paul Hadjipieris, Erilynn T. Heinrichsen, and Jace Hargis. The text of this work is licensed under a Creative Commons BY 4.0 International License.