
Student surveys on mobile technology usage highlight a need for better mobile integration in coursework and institutional strategy.

Since the first iPhone was invented in 2007, mobile devices have progressed from a convenience in our daily lives to a necessity. In higher education, the use of mobile technologies in learning has also increased rapidly over that 10-year period.1 Given mobile's changing nature and affordances, however, it is still unclear how to best integrate the technology into both coursework and institutional strategy.
At the University of Central Florida (UCF), we conducted online surveys in 2012, 2014, and 2016 to gather student perspectives on mobile learning at the university. Our goal was to get an overview of students' mobile device ownership and learning activities over time and understand related trends. This article compares the results of the 2016 survey to the previous two surveys and addresses three research questions:
- What types of mobile devices do students use, and how has device ownership changed over time?
- How do students use mobile devices and apps, and how has that usage changed over time?
- What are students' beliefs about mobile usage, and how have those beliefs changed over time?
Mobile Technology and Education
According to the ECAR Study of Undergraduate Students and Information Technology, 2017, 95 percent of undergraduate students own a laptop or a smartphone and 30 percent own a laptop, a smartphone, and a tablet.2 Mobile technology's high ownership has translated into increased usage to support student learning; this is particularly true with smartphones, which are conducive to agile tasks such as communication, easy information access, and photography.3
According to a recent survey, for example, 70–79 percent of University of Washington students reported using smartphones for academic purposes in at least one class.4 Other study results show that 78 percent of students consider their phones to be at least moderately important to their academic success,5 while 83 percent used a smartphone for course-related activities for one or more of their courses and 25 percent used a smartphone for all of their courses.6
Although usage for academic purposes has clearly increased, several challenges remain in implementing mobile technology in higher education. These challenges include a disconnect between student and instructor views of mobile technologies, a lack of pedagogical support or training for instructors, and a lack of effective technical support for mobile learning.
The Distraction Factor
Recent research indicates that some higher education instructors are hesitant to adopt mobile technology as a formal part of their curricula because they view the devices as potentially distracting. In one study, a majority of students reported that instructors did not want them to use their smartphones (58 percent) or tablets (65 percent) as learning tools in the classroom.7 Although close to half of the instructors in one survey admitted that mobile devices benefit learning, more than half (63.0 percent) expressed concerns about the devices being a distraction for students.8 Further, the 2017 ECAR study reported that 52 percent of faculty discouraged or banned smartphone use in the classroom.9
Training and Support
A second obstacle for mobile technology use in coursework is a lack of knowledge about or comfort with integrating the technology into teaching. A recent study of instructors found that one of the strongest disincentives to classroom innovation is that instructors fear embarrassing themselves in front of students.10 The 2017 NMC Horizon Report field surveys found that instructors need both technical and pedagogical support from their institutions to integrate mobile technology into curricula.11
Among many recent studies on technical support issues, ECAR research provides detailed insights into the considerable challenges institutions face when trying to properly support mobile learners.12 Helpdesk services are typically implemented at every institution, but they are not being used as one might presume.13 Students reported that their technical support needs are most likely satisfied through a DIY approach; they are more than twice as likely to resolve technical dilemmas by asking a friend or searching online than by contacting their campus helpdesk.14 The reasons students tend to prefer solving their own issues over using a helpdesk continue to be explored, so it's important for institutions to evaluate underutilized resources and use ticketing systems that support analytics to better track student needs to improve services.
Survey Methods and Results
In 2012, we designed the original mobile survey and distributed it online; our goal was to get a general overview of mobile technology ownership and use among UCF students. The 2016 survey includes closed and open-ended questions, which were modified slightly based on the 2012 and 2014 survey results. We distributed the survey to students, with their instructors' permission, through online course announcements and emails. All three surveys reached a representative sample of UCF students enrolled in face-to-face, blended, and fully online courses from 12 different colleges. Table 1 offers detailed demographics of the survey samples. Our results in relation to the three research questions follow.
Table 1. Demographics of the survey samples
|
|
2012 |
2014 |
2016 |
|---|---|---|---|
|
Sample size |
933 |
1,181 |
1,474 |
|
Courses |
84 |
83 |
118 |
|
Colleges |
12 |
12 |
12 |
|
Undergraduates |
75% |
91% |
80% |
|
Gender |
69% female |
68% female |
63% female |
|
Ethnicity |
60% Caucasian |
63% Caucasian |
51% Caucasian |
|
Age |
M = 26, SD = 8.17 |
M = 24, SD = 7.04 |
M = 24, SD = 7.10 |
Device Ownership
Question 1: What types of mobile devices do students use, and how has device ownership changed over time?
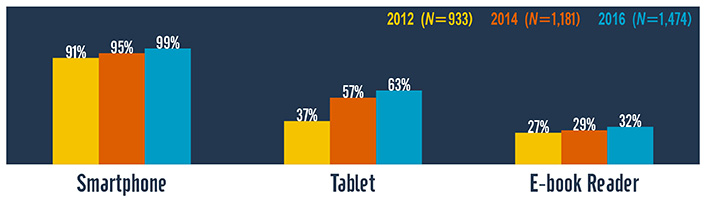
The 2016 results indicated that 99 percent of respondents (N = 1,474) owned a smartphone, 63 percent owned a tablet, 32 percent owned an e-book reader, and 28 percent owned a wearable device. Comparison data over the survey years show an increase in ownership in all mobile devices from 2012 to 2016 (see figure 1). Smartphone ownership has been consistently high, while tablet ownership increased by 20 percentage points in 2014 and showed a small increase (6 percentage points) in 2016. Ownership of e-book readers increased slightly across years, and one-third of responding students in 2016 owned at least one. In 2016, we added wearable devices to the 2016 survey, so we have no comparison data. The 2016 data show that wearable ownership is relatively low (28 percent), with the majority of those students owning a Fitbit (12 percent) or Apple (4 percent) device.
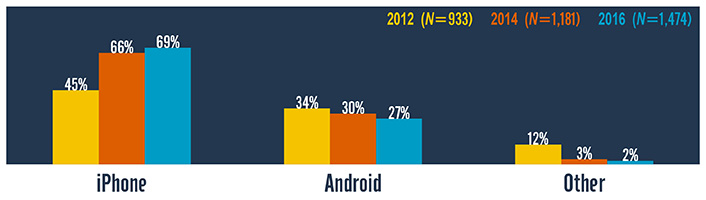
As figure 2 shows, in 2016, 96 percent of students owned at least one of the two prominent smartphone devices: iPhone (69 percent) or Android (27 percent). These two devices were prominent across the survey years, though iPhone ownership has gradually increased (24 percentage points), while Android ownership has declined (7 percentage points).
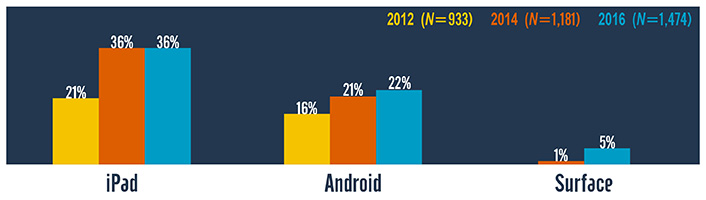
As figure 3 shows, tablet ownership in 2016 was at 63 percent, with most students owning at least one iPad (36 percent) or Android tablet (23 percent). Tablet ownership across the survey remained stable or increased slightly.
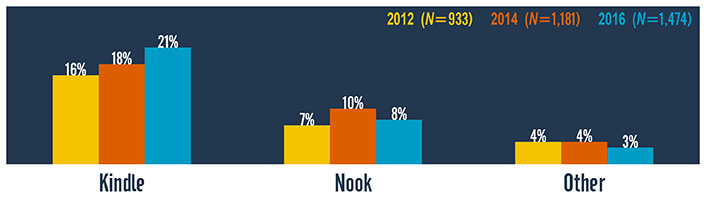
As with other devices, overall e-book ownership increased over time, with 32 percent of students owning one in 2016 (an increase of 8 percentage points since 2012). As figure 4 shows, the most common e-book readers were Kindle (21 percent) and Nook (8 percent); Kindle ownership increased over time (5 percentage points), while Nook and other devices dropped slightly in 2016.
Device Usage
Question 2: How do students use mobile devices and apps, and how has that usage changed over time?
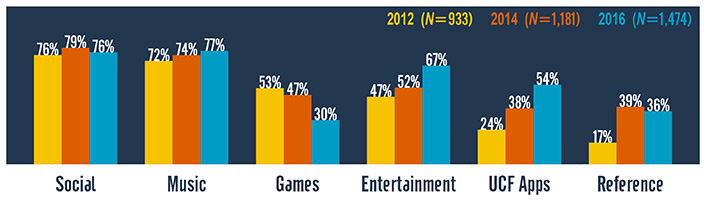
In 2016, students reported extensive use of various mobile apps in their personal lives; the most frequently used were music apps, such as Pandora and Spotify; social networking apps, such as Facebook and Twitter; social media apps, such as Instagram and Snapchat; and entertainment apps, such as Netflix and Hulu. Across surveys, students reported consistently high social and music app use. More than 70 percent of respondents reported using social and music apps in their personal lives. However, the use of game apps, such as Minecraft and Angry Birds, has steadily decreased from 53 percent in 2012 to 30 percent in 2016.
As figure 5 shows, over the survey years, the fastest growing app use included entertainment (from 47 to 67 percent); institutional apps, such as UCF Mobile and Canvas Mobile (from 24 to 54 percent); and reference apps, such as Google Search and Dictionary (from 17 to 36 percent). Student use of mobile devices for watching entertainment videos and searching for school/course related information also increased over the survey years.
The survey results indicate that students are increasingly using their mobile devices and apps for learning purposes. In 2012, 32 percent of students said they used mobile apps to complete an assignment at least once a week. In 2014, 66 percent said they used mobile apps for learning at least once a week, and that number increased slightly to 69 percent in 2016. The learning apps that students reported using regularly included institutional apps, such as Webcourses@UCF Canvas and UCF Mobile; reference apps, such as Google and Dictionary; apps for education, such as Quizlet and Duolingo; books, such as Kindle and iBooks; and productivity apps, such as Google Docs and Microsoft products. These categories have been consistent across the survey years.
Although students have rapidly increased their use of mobile devices and apps for learning, they reported only modest support from instructors in their coursework over time. In 2016, 39 percent of students said their instructors offered information on how to use the mobile apps/devices in coursework; 29 percent said instructors modeled mobile apps/devices in class; and 36 percent said their instructors stated in the course syllabus that a mobile app/device was required for coursework. These numbers actually increased significantly over the 2014 data, when only 19 percent of students said instructors modeled mobile practices in class and 16 percent said that the mobile app/device requirement was clearly stated in the course syllabus.
Beliefs about Mobile Usage
Question 3: What are students' beliefs about mobile usage, and how have those beliefs changed over time?
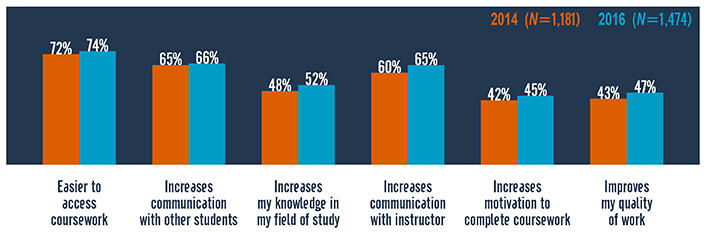
The 2016 survey showed little change in student beliefs about mobile technologies' value for academic work (figure 6). Although each subcategory increased, the increases were minor. Student beliefs increased from 2014 to 2016 in all subcategories as follows: mobile technology gave them better access to coursework (2 percentage-point increase); provided opportunities for increased communication with other students (1 percentage point); helped increase their knowledge of course's target field of study (4 percentage points); helped increase their communications with the instructor (5 percentage points); helped increase their motivation to complete coursework (3 percentage points); and helped them improve their quality of work (4 percentage points).
Student beliefs about instructors' support of mobile technology showed greater subcategory increases. In 2016, more students reported that instructors had described how to use the mobile apps/devices in coursework (up 14 percentage points from the 2014 survey). Students also reported a 10 percentage-point increase in instructors who modeled the use of mobile apps/devices in class and a 20 percentage-point increase in instructors clearly stating a mobile apps/devices requirement in the course or in the course syllabus.
As figure 7 shows, reasons for students not wanting instructors to use mobile technology in a course also increased in most subcategories from 2014 to 2016. The "limited funds" reasons increased by 5 percentage points over 2014 and 13 percentage points over the 2012 survey; funding clearly remains a major issue. Limited or no access to mobile technology in the 2016 survey showed a 13 percentage-point increase over the 2014 survey.
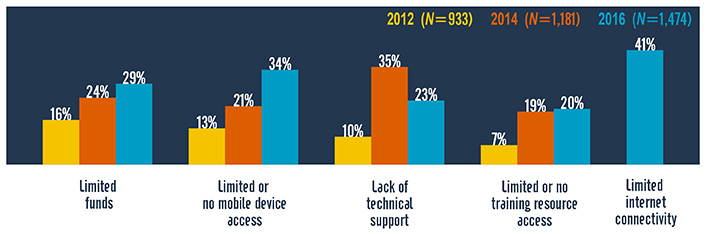
Lack of technical support decreased since 2014 (12 percentage points); this may be because students are becoming more comfortable with the technology or more knowledgeable of support. Also, in 2016, a significant percentage of students (41 percent) felt that they had limited internet connectivity. This question was not asked on previous surveys, but the percentage shows that many students feel that they cannot effectively connect to the internet on their mobile device, thus limiting their access to information. Finally, because the students reportedly had limited or no access to training and faced various related obstacles, more than a quarter (27 percent) said they would prefer that instructors not use mobile technology in courses.
Discussion
As in other research, our mobile survey series shows a trend toward full ownership of smartphones and widespread tablet ownership among students. Any technology that nearly every student uses and that has significant implications for education should be identified as a critical tool and receive deliberate attention from educators. However, several issues can complicate this integration of mobile technologies into learning.
Ownership vs. Usage
Technology ownership and usage are not necessarily equal. Our surveys show that they are significantly correlated among students. Among instructors, however, simply owning a mobile device does not often correlate with high usage in teaching. Still, most students spend more time accessing academic materials on a laptop than on a mobile device. Indeed, at UCF, students spent nearly three times more time engaging with online course material through laptops: approximately 14 minutes on average, compared to 5 minutes when accessing the same content on a smartphone.
Given this, it is perhaps natural to assume that the higher usage means the laptop is more important to a student than a smartphone. However, measuring usage as the principal metric for importance can be misleading because each platform serves a different function and both are valuable to the entire learning experience. Students in our survey indicated that, when using a smartphone for course activities, they typically focus on smaller tasks and communication, which keeps them engaged. These tasks might include checking course messages, engaging in discussions, checking for upcoming assignments and due dates, accessing grades, taking notes, and Googling for information to clarify concepts. Institutions need to understand the impact mobile technology has on the entire student experience and integrate that technology into the curriculum. Neglecting to do so can diminish student access to the technology and to information, which can decrease engagement and, ultimately, retention.
The Importance of Training
To ensure broader mobile technology adoption among teachers, institutions should focus on better educating them about mobile technologies. At UCF, we created a self-paced online course, "Mobile Essentials" [https://cdl.ucf.edu/teach/professional-development/mobile/], that covers available resources and considerations for implementing mobile technology into teaching. We include further information in IDL6543: Interactive Distributed Learning, a required blended course for all instructors who will be teaching online or in a blended course. The focus in this course is on educating instructors about ownership and beliefs about mobile technologies, as well as on best practices aimed at improving the mobile user experience through mobile design.
Developing a Mobile Strategy
Because mobile technology changes frequently, developing a university-wide mobile strategy can be a difficult task. Although hardware has traditionally defined the technology, mobile software is now outpacing hardware in innovation. Further, mobile technologies such as smartwatches and virtual reality headsets have begun entering the mainstream, while mobile-connected internet of things (IoT) devices — such as activity trackers, smart speakers, and Bluetooth beacons — are now a part of the mobile ecosystem at many institutions.
As our survey results show, the definition of mobile devices is forever evolving. Given this, an institution's mobile strategy should center on the user experience, which starts with recognizing those mobile resources that have the most impact and value. To identify those resources, it is important to talk to campus stakeholders, including students, faculty, staff, alumni, and prospective students. Large- and small-scale surveys, focus groups, and beta testing can produce helpful feedback when evaluating current needs and setting software, hardware, and personnel budgets.
Many schools have experimented with mobile over the past 10 years, producing various and fractured mobile services and applications. However, mobile strategy should be set forth with the entire campus in mind. Partnering with campus entities is vital to growing valuable services and sharing essential data to produce a centralized mobile strategy and consolidate resources.
Further, even with one central body overseeing mobile strategy, it is essential to also establish shared governance to ensure that decisions have input from various stakeholders rather than a single department, unit, or person. This shared governance includes decisions about how to integrate new resources, as well as their possible consequences in terms of security, support, and demand. Creating and following a governance process in this way helps produce community ownership and ensure broader administration and leadership buy in, with a focus on the institution's overall vision and goals.
Next Steps
Our mobile survey results offer a systematic view of mobile learning implementation and its implications for practice at UCF. Our hope is that it might also help other institutions promote and more systematically establish mobile learning practices of their own.
Among our short-term plans are to eliminate the disconnect between instructors and students through faculty training and pedagogical support. In addition to our stand-alone mobile training course, we intend to integrate learning concepts, such as universal design, into all training programs to help instructors design mobile-compatible online courses and assignments.
To support these mobile initiatives, UCF has created a new position, program director of mobile strategy, to focus on growth and awareness of mobile technologies. This director will develop a university mobile strategy; manage UCF's mobile presence with a focus on student success, engagement, and retention; provide academic support for all course modalities; and partner with stakeholders across the university to uphold university governance and deliver an integrated mobile experience focused on mobile design, applications, and communication. The result will be dedicated oversight of mobile technologies at UCF, which will validate and expand their greater adoption on campus, online, and inside the classroom.
Further, we intend to continue our mobile research. UCF's instructional designers have paired with interested instructors to conduct action research on mobile uses in classroom settings. Finally, we are preparing to distribute our 2018 survey at UCF and at two collaborating institutions. We welcome responses and recommendations on our survey results, and we hope to extend the survey to more institutions in the future.
Notes
- Greig Krull and Josep M. Duart, "Research Trends in Mobile Learning in Higher Education: A Systematic Review of Articles (2011—2015)," International Review of Research in Open and Distributed Learning, Vol. 18, No. 7, 2017; and Wen-Husiung Wu, Yen-Chun Jim Wu, Chun-Yu Chen, Hao-Yun Kao, Che-Hung Lin, and Sih-Han Huang, "Review of Trends from Mobile Learning Studies: A Meta-Analysis," Proceedings mLearn 2014: Mobile as Mainstream—Towards Future Challenges in Mobile Learning, Springer, 2014: 304–314. ↩
- Jeffrey Pomerantz and D. Christopher Brooks, 2017 ECAR Study of Undergraduate Students and Information Technology, EDUCAUSE Center for Analysis and Research, 2017. ↩
- Ibid., p. 12. ↩
- Samantha Adams Becker, Michele Cummins, Annie Davis, Alex Freeman, Courtney Hall Giesinger, and Vidya Ananthanarayanan, NMC Horizon Report: 2017 Higher Education Edition, The New Media Consortium, 2017. ↩
- Pomerantz and Brooks, 2017 ECAR Study, p. 13. ↩
- Ibid., p. 13. ↩
- Ibid., p. 15. ↩
- D. Christopher Brooks, 2015 Study of Faculty and Information Technology Report, EDUCAUSE Center for Analysis and Research, 2016. ↩
- Pomerantz and Brooks, 2017 ECAR Study, p. 14 ↩
- David Matthews, "Fear of Looking Stupid," Inside Higher Ed, July 6, 2017. ↩
- Becker et al., NMC Horizon Report, p. 40 ↩
- Betsy Reinitz, 2017 Trends and Technologies: Mobile, EDUCAUSE Center for Analysis and Research, 2017, p. 3. ↩
- Pomerantz and Brooks, 2017 ECAR Study, p. 8 ↩
- Ibid., p. 9 ↩
Ryan Seilhamer is the Program Director of Mobile Strategy & Innovation at the University of Central Florida.
Baiyun Chen is a Senior Instructional Designer at the Center for Distributed Learning at the University of Central Florida.
Sue Bauer is an Instructional Designer with the Center for Distributed Learning at the University of Central Florida.
Ashley Salter is an Instructional Designer at the Center for Distributed Learning at the University of Central Florida.
Luke Bennett is an Instructional Designer at the University of Central Florida.
© 2018 Ryan Seilhamer, Baiyun Chen, Sue Bauer, Ashley Salter, and Luke Bennett. The text of this work is licensed under a Creative Commons BY-NC-SA 4.0 International License.