
This low-cost, low-tech tool brings people together to improve discrete processes and cumulatively create broader change.
Nearly four years ago, 11 public research universities united around a mission to increase the number and diversity of US college graduates. This group of institutions, known as the University Innovation Alliance (UIA), agreed to share with each other successes and failures, and hold each other accountable to an audacious public goal: to accelerate innovation across our campuses in an effort to dramatically increase the number of high-quality degrees awarded, especially to those from first-generation and low-income backgrounds.
As is common when big institutions group together to make big claims and big promises, our announcement was met with more than a few eye rolls. In just over three years, however, our institutions have increased the number of low-income graduates by 25 percent — and we are well on track to surpass our initial goal to graduate an additional 68,000 students. As it turns out, we are making progress faster than expected. One critical strategy linked to our success has been a low-cost, low-tech, high-interaction approach called process mapping.
Processing mapping is a concept that was first introduced in the 1920s. Over time it has become common practice in business, yet the concept has had limited use within higher education institutions. In this article, we describe the approach and how our member institutions are applying it to better understand and improve existing processes that often get in the way of student success.
The University Innovation Alliance
The UIA focuses on three key activities: innovating with processes and technologies that help us reach our goals, scaling those innovations across UIA institutions, and diffusing successful innovations to other colleges and universities.
For example, the UIA is currently in the midst of a 10,000-student random control trial to measure the impact of proactive, analytics-informed advising. Although proactive advising is a widely discussed approach today, few studies on advising actually meet the What Works Clearinghouse standard. Our goal is to determine which types of interventions actually improve outcomes for first-generation low-income students across our 11 campuses.
The bulk of UIA's work is focused on scaling — taking ideas that have been tested and vetted on one campus and scaling them up on other campuses. We quickly realized that you can't effectively scale an innovation from elsewhere if you don't understand how your current systems and processes work and the points at which they involve interactions with students. This is where and why process mapping has become a key tool in our work.
A Process Mapping Epiphany
Georgia State University is widely viewed as a national model for student success.1 The university has eliminated race and income as a predictor of outcome and doubled its graduation rate in just seven years.2 Among the projects contributing to Georgia State's success were predictive analytics, proactive advising, and the complete redesign of its campus around students.
At UIA's first convening in 2015, we spent our time observing the work at Georgia State, learning about their successes and failures in order to understand exactly what they were doing. Georgia State had done so much, and that success was frankly a bit overwhelming to a group of institutions trying to transform their own student outcomes.
One thing that really stood out, particularly to the team from Michigan State University (MSU), was that Georgia State's team members started their efforts to improve advising by mapping out the experience from a student's perspective: They mapped out exactly how staff and faculty members were interacting with their students and, from that map, determined the path forward.
The MSU Experience
MSU decided to try out the tool in its own student success effort. MSU's UIA fellow took a $200 training course in process mapping, then went back to her office and called everyone who worked in student success on campus to get together for a day. The goal was to map out how the institution was currently onboarding new students — especially students from vulnerable backgrounds — from the day of matriculation to the day they showed up on campus and through their first year.
Participants included various stakeholders from more than 20 offices and units, including student affairs, admissions, financial aid, advising, and the registrar's office. They were each given a specific color of sticky note corresponding to their department. They then wrote down, on individual sticky notes, each mass-communication email message that they routinely send to students during the yearlong onboarding process. Next, participants worked together to arrange the notes into a timeline.
Figure 1 shows the resulting process map of the emails sent to each student. To everyone's surprise, they saw that students received more than 400 mass-communication emails from various university departments. The map also revealed that, unbeknownst to administrators, these students could have a total of 90 different types of enrollment holds on their accounts.
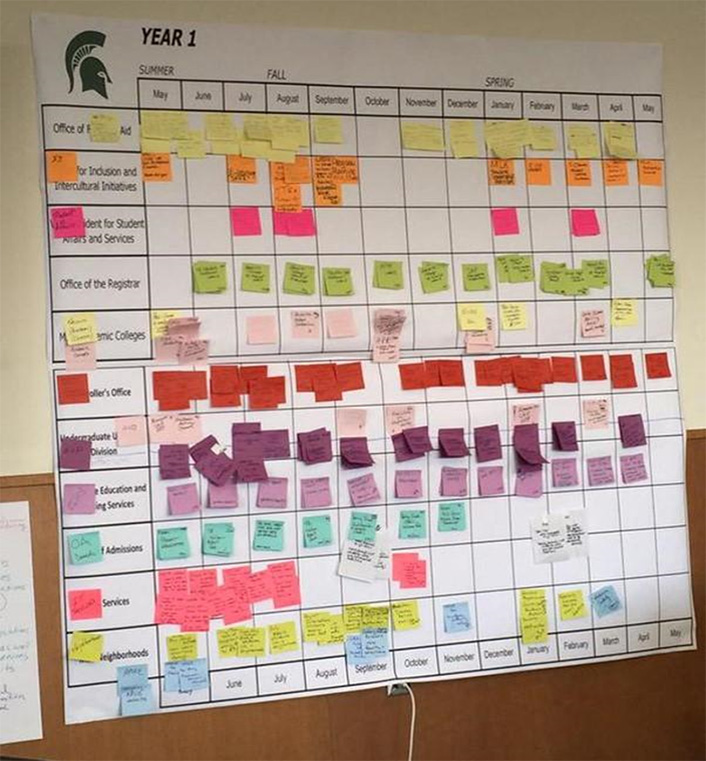
Further, following this workshop, team members went back and conducted a more detailed mapping of all types of emails sent from the four main offices (registrar, admissions, student accounts, and financial aid) and found that, combined, these offices sent more than 1,200 total emails to each student over the one-year onboarding period.
So, while everyone's intentions were simply to communicate needed information from their specific vantage points, the overall message students were receiving was: Don't check your email. As a result, students were missing key steps in the onboarding process.
Because the process had never been laid out in this way, most stakeholders had no idea where their own communications fit in the overall process, let alone about the barrage of email students were receiving. The student success team is now completely redesigning its communication with students, using this first process map as a guide.
The Roots of Process Complexity
What Georgia State understood clearly and MSU quickly learned was that before you undertake a project — whether it be a strategic financial intervention or proactive advising — you must first understand the status quo and how your current system interacts with students.
Faculty, staff members, and administrators all have different priorities and different views on what constitutes success and failure. As a result, when systems are set in motion, they often view the process from a single viewpoint without realizing that students are interacting with many varied viewpoints at the same time, which can create noise, complexity, and roadblocks to success.
Recognizing this and seeing the success at MSU, all of our UIA fellows have now been trained in process mapping and are using it in projects such as improving the enrollment hold process, financial communication, proactive advising, and transfer credits.
How to Map a Process
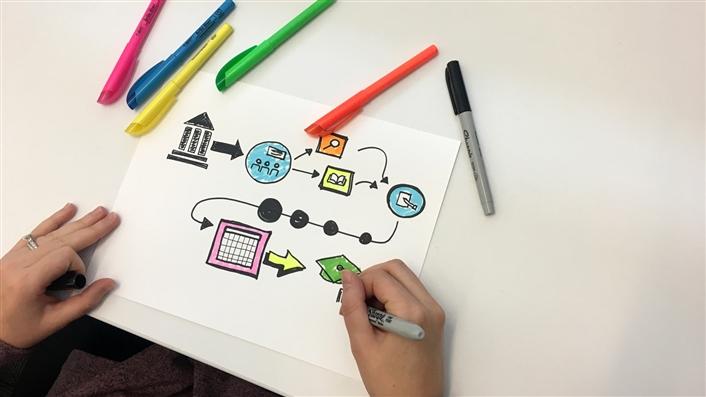
Colleges and universities are complex systems, and their myriad procedures and routine tasks can easily disorient and exhaust students, educators, and administrators alike. Process mapping is a simple, inexpensive tool to address this complexity. It can also galvanize stakeholders and create a clear sense of urgency around solving a specific problem.
Key Components
Process mapping tools are low tech and readily available: sticky notes, pens, and a wall or a whiteboard. The essential component is people. Anyone participating in the target process at any point should be involved in creating the map. These stakeholders might work in the same or different areas, but they are often struggling with the same problem or are looking to improve the process. Creating a process map gives them a tangible way to visually document the process and its problems and to discuss ways to fix them.
Choosing a Map
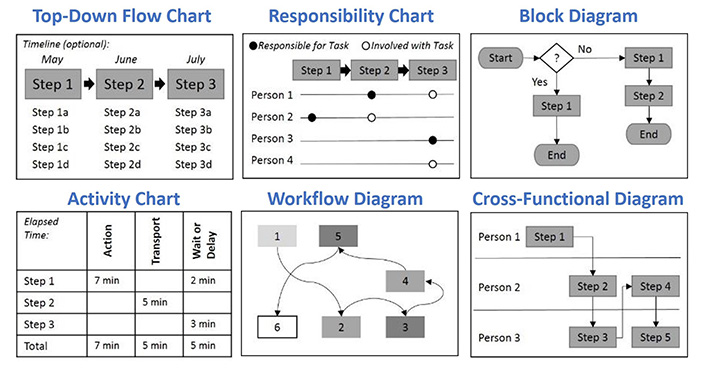
You can choose from among various types of process maps, combine two or more maps, or create your own from scratch (see figure 2). The goal is to achieve a clear view of the existing process.
Each of the following map types visually illustrates process complexity and details in a slightly different way:
- A top-down flowchart shows both the macro steps and their individual micro steps. In the college application process, for example, macro steps might include filling out the federal student aid form and submitting the university application, while the micro steps include finding your parents' tax information and writing the admissions essay. As this example shows, the top-down flowchart map is suited to processes with nested steps.
- A responsibility chart indicates the person or office responsible for or involved with each step of a process. MSU's student communication map is a good example here, as it clearly showed which office sent which email at which point in the communications process during a student's first year. MSU used this map to understand its onboarding process.
- A block diagram, also known as a decision tree, shows different paths through a process (arrows) based on one or more decision points (diamonds). One of our UIA institutions (Purdue) used a block diagram to map its complex transfer articulation process, with each diamond representing a decision point.
- An activity chart is a great choice when time is the most important factor. This chart can help you troubleshoot delays and identify steps that could happen simultaneously to save time. An activity chart could be used, for example, to map the time it takes to move through each review step for a competitive admissions or scholarship program.
- A workflow diagram illustrates processes that involve physical or virtual space. For example, this type of map is suitable for mapping different office locations that students must visit to solve a particular problem.
- A cross-functional diagram shows handoffs between people, which are often overlooked in complex, inefficient processes such as submitting forms for approval or back-and-forth email communications. This map can help you simplify these processes (and gain the appreciation of all involved).
A good starting point for choosing a map is to simply think about and characterize the problem you are trying to solve. Also, the map you choose doesn't have to be perfect. You can modify and adapt it as needed as you go along.
The Six Steps
The best way to start process mapping is to simply jump in, organizing your efforts according to six basic steps as follows.
In step 1, identify a specific, concrete process and gather a small group of stakeholders to help you map it. An example process might be a financial aid hold or filling out a change-of-major form. The point is to keep it simple and define the process scope — its starting and stopping points.
In step 2, choose and populate your map. You can choose from the map examples in figure 2 or look for map templates online. Depending on the process, you can use different colors of sticky notes for different types of steps or stakeholders, or use just one color. Either way, you simply label each step on a note and map the process on the wall or board using one of the map types as a guide.
In step 3, assess the status quo. The goal here is to get a clear sense of the current process. What is happening? How are you currently interacting with students? Answering those questions is your only job at this point; don't leap forward and try to create your dream process. In this step, you simply map what is and study the results.
In step 4, identify the issues, including steps you can remove, steps that don't make sense, duplicate steps, or obvious gaps. This is also a good time to identify bottlenecks and staff members who are overloaded and might need help. A useful approach in this step is to look at the process from the student's perspective: At what point might a new student who is unfamiliar with college experience challenges?
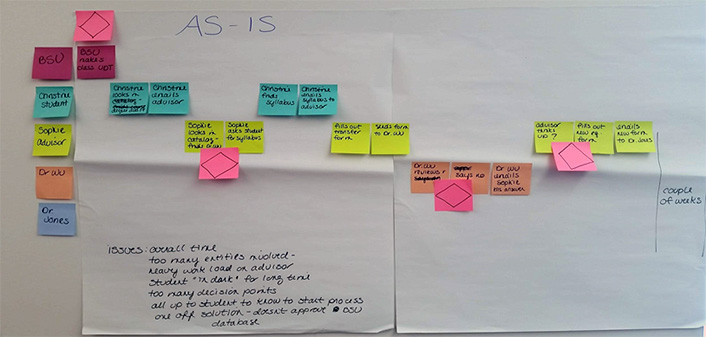
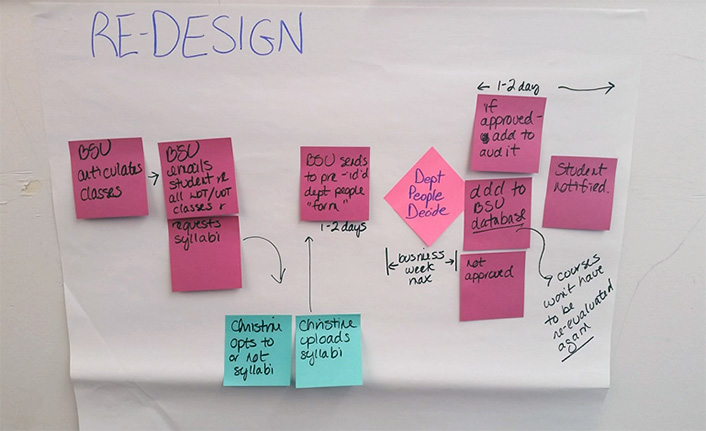
In step 5, redesign the process. It's important not to aim for perfection or make this a high-pressure task. The best thing to do is simply begin: Refer to step 4 and brainstorm how you might rework the process to avoid or address the identified issues. Once you have an idea of the new process, you can redesign and refine the map accordingly. As an example, figure 3 shows a simple process map and its initial redesign from a workshop at Oregon State University.
Finally, in step 6, iterate on steps 3–5 until you have a process that best serves your students.
Discussion
One of the challenges of change is that it often rests on identifying problems, which are inevitably connected to people and how they operate. Our experiences have shown that how you frame problems and involve people in the change process are critical factors in the success of process mapping.
Design Issue vs. Institutional Failure
If an institution is not getting the results it wants for low-income students, first-generation students, and students of color, it must first focus on the broader system. Every system is perfectly designed to get the results it gets. Our institutions more or less have to be everything to everyone — they're about teaching and research and discovery and security and safety and efficiency and accountability and all these things, as well as about economic development.
If you look at a system from that perspective and realize that it is not always designed around student needs, it can be much more liberating than the typical narrative, which too often simply attacks administrators rather than examines system design. After all, if it's a design problem, there's a design solution; there are no bad guys — that is, there aren't people behind the scenes twisting their mustaches and intentionally trying to thwart student success.
The People Factor
For an intervention or innovation to succeed, it is essential to both build consensus around the need for it and cultivate a community to support it. Process mapping can be a key component in community building. As people get together, study the status quo, and get a clear sense of how it could and should be better for students, the emphasis shifts from the problem to what is possible.
A Practical Model for Change
Redesigning colleges and universities around students sounds like an enormous undertaking, but it is really the sum of many small interactions and changes in many small processes that, taken together, can have a huge impact on student success. At UIA, our institutions are working together to support each other as they make these changes, but any institution can achieve the same supportive, collaborative environment among its own internal communities.
Using process mapping offers a model that simultaneously targets small, essential process changes and builds collaborative community. It's a tool that not only is low cost but also lets you identify places you could actually save money, time, and energy on your campus. And, perhaps more importantly, it's a way for people in your campus community to come together and feel like they're making a difference. This has certainly been our experience at UIA.
Finally, one of the crucial things we have discovered via process mapping is the importance of failure and the courage it takes to admit it. Too often in higher education, we like to show only our polished, perfect stories and make it seem like we knew everything all along. To succeed in better serving our students, we must reverse that trend. When someone identifies or admits to a problem in a process, we need to treat that person as a hero and hold the problem up as an opportunity rather than a source of shame. We need to create a space where it's safe to admit that we were doing things wrong, where learning and iterating and improving is not only okay but is itself the goal.
Notes
- Eric Sturgis, "Bill Gates Gives Kudos to Georgia State for Work to Improve Graduation Rates," The Atlanta Journal-Constitution, October 4, 2017. ↩
- Tim Renick, "At Georgia State, We Transformed Our Grad Rates. Here's How," KIPP:Blog, April 19, 2017. ↩
Bridget Burns is Executive Director at the University Innovation Alliance.
Alex Aljets is the UIA Fellow at Oregon State University.
© 2018 Bridget Burns and Alex Aljets. The text of this work is licensed under a Creative Commons BY-ND 4.0 International License.