
In light of the significant investments that some colleges and universities are making in their analytics infrastructures, how can an institution architect itself to tackle substantial, strategically important teaching and learning challenges? How can an institution innovate learning analytics for sustainable impact?

Learning analytics is an academic field that has been taking shape under that banner since around 2010, and it has featured regularly in reports on learning technology futures over the years. It sits at the convergence of learning (learning technology, educational research, learning/assessment sciences), analytics (statistics, visualization, computer/data sciences, artificial intelligence), and human-computer interaction (participatory design, behavioral science, sociotechnical systems design, usability evaluation). In light of the significant investments that some colleges and universities are making in their analytics infrastructures, how can an institution architect itself to innovate at this disciplinary intersection—to innovate pedagogically and analytically in order to tackle substantial, strategically important teaching and learning challenges? In short, how can an institution innovate for sustainable impact?
The focus of learning analytics is the application of analytics approaches to gain insight into educational data to improve teaching and learning. Learning analytics will undoubtedly be an advance if this provides new "power tools" for academic researchers—who have of course studied teaching and learning data in nondigital ways for decades. Such research is a necessary first step to validate the approaches. However, the true potential of learning analytics will be realized when we move from research to development and create human-computer systems that automate this analysis process—from data capture to visualization and recommendation—offering better (i.e., more timely, precise, and actionable) feedback to educators, students, instructional designers, and the other stakeholders who constitute the whole learning system.1
The word automation conjures up many meanings. It is important to emphasize that automation does not necessarily mean that diagnoses, decisions, and actions are fully automated, taking human educators "out of the loop." Automation may "simply" (it is still complex) make the process of data capture, cleaning, analysis, and visualization into a commodity service—a cycle that previously required skilled but scarce researchers or analysts. The responsibility for making sense of that feedback and acting on it can remain fully with the human student, educator, or analyst, or it can be shared (e.g., the analytics system may suggest areas of concern to help users prioritize their scarce attention or may recommend courses of action). It may also be that feedback and advice are fully scripted by expert instructors but are personalized at scale through tailored communication.2
To summarize, the potential of the "data revolution" in teaching and learning, just as in other sectors, is to create much more timely feedback loops for tracking the effectiveness of a complex system. In a field where feedback is already well established as a vital process for both students and educators, the question is how this potential can be realized through effective human-computer systems.
The Innovation/Impact Tension
Despite hosting some of the brightest academics in data science, statistics, user interface design, and organizational innovation, a college or university may be far from innovating on these fronts when it comes to tracking, analyzing, and feeding back information to improve teaching and learning. Although paradoxical to an outsider, this apparent dysfunction is all too familiar to insiders: the incentives are not there for academics to work on their own institution's strategic teaching and learning problems. As a result, research-active analytics groups are generally not responsive to their institution's analytics needs. Academics do not want to be branded with the dreaded badge of service center, which has connotations of not being research-worthy. Various tensions are in play here.
First, academics are under pressure to conduct novel research. They must engage in analytics innovation that is worthy of peer-reviewed publications and grants because they are making evidence-based claims, about data grounded in rigorous methodology, often using cutting-edge technology well beyond that in current products. They value their academic freedom, so they choose to engage in a specific strain of learning analytics research that interests them. Academics reserve the right not to try to solve "boring" (albeit serious) data challenges in the institution, generally because they feel the challenges are mundane and/or don't fit their research narrative and because they don't want to be dictated to. Funds are spent on researchers, dissemination, and equipment. Time is spent on grant writing, training PhDs, and writing and reviewing papers.
Second, academics receive little recognition for developing scalable applications. Any competent academic research group can invent novel, well-grounded, and effective analytics at a small scale, but it reserves the right to move on to the next interesting challenge. Researchers receive little reward for validating more widely or for pushing an innovation through to mainstream deployment. They certainly don't consider it their job to fix the institution's broken data systems; that's an IT or business intelligence (BI) job. In addition, crossing the chasm between innovation and infrastructure requires a suite of skills not often present in research groups—skills that include professional software development, user experience and interface design, innovation advocacy, and behavioral science. It also requires a steady focus on the needs of the user community—what the Design-Based Implementation Research (DBIR) community calls the "persistent problems of practice." Mainstream deployment of analytics tools also entails extensive cross-campus liaison to build commitment from other academics and units. This is a long-standing challenge for learning technology research and development (R&D).3
Finally, colleges and universities want to see an impact on students. This impact comes in many forms: increasing student learning, providing more efficient instructional delivery processes, addressing inequities in student outcomes, maintaining finances, and improving retention and graduation rates. These practical outcomes are sometimes perceived by academics as counterincentives.
Academics may be cautious about claiming causal connections or about being pushed to justify their work in financial terms. When the mainstream application of analytics requires scalable infrastructure that academics can't deliver, what gets rolled out is commercial products. These may provide rudimentary dashboards that give analytics a bad name and that academics in turn don't want to associate themselves with, either as end-users or researchers. Products typically target the larger mainstream, conventional markets rather than the future-focused bleeding edge of teaching and learning.
Organizational Architectures
Our focus here is on organizational architectures that a college or university's leadership can consider in order to advance innovative analytics for its own mission and context. We are seeking to open a dialogue on organizational architectures and processes as a way to address educational challenges that often require systemic thinking and change. Such challenges may be faced by many colleges and universities, opening up collaboration opportunities. Moreover, if the innovation-diffusion challenges facing one institution can be taken as a microcosm for the challenges facing the learning analytics field as a whole, organization-level insights may scale to consortia or more open networks.
Surveying the current landscape, we see three broad organizational models that are being used to deliver learning analytics. These three models are largely role-aligned: (1) the IT Service Center model (primarily professional services staff); (2) the Faculty Academics model (primarily faculty researchers); and (3) the hybrid Innovation Center model (a mix of professional services staff and faculty researchers).
To what extent can these three different organizational models deliver both production-grade services and innovation with sustainable impact? We will start by discussing the two "standard" models before moving on to the much less common third model.
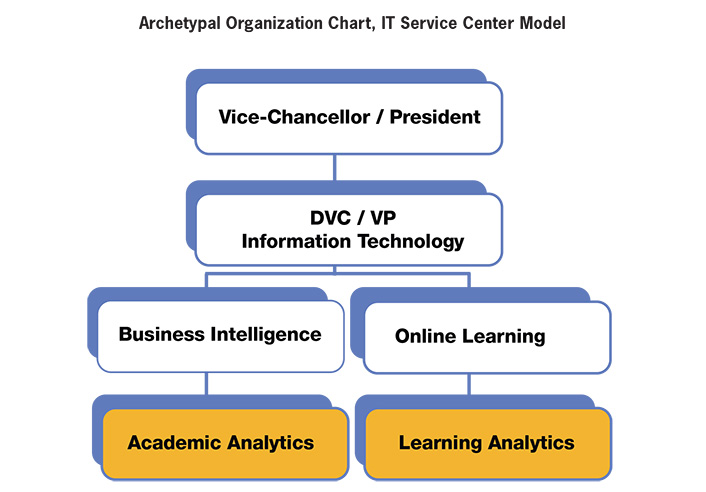
The IT Service Center Model
In this model, an IT service center delivers analytics from an enterprise platform. Examples include the following:
- The team delivering the learning management system (LMS) drives analytics provision, using/configuring the product's dashboards for academics (and possibly students).
- The enterprise data warehouse, BI, or institutional research (IR) team provides analytics by integrating data from the LMS and other data sources.
- A team in the teaching and learning support center works with the above units to help academics make use of analytics.
Pros
- The center is equipped to deliver production-grade analytics services, with close to 24/7 uptime and system support, available to all or a majority of students and staff as a core platform integrated with other institutional systems. The analytics typically cover "academic analytics" (conventional student demographics, enrollment, and grades) and various forms of learning analytics (finer-grained, midcourse student progress and activity data).
- Staff will innovate within the scope of what products can do and how they integrate with existing infrastructure.
- End-users will typically be academics, because to date, most LMS and other products deliver reporting dashboards to help educators track student progress.
- However, generic LMS products are beginning to provide student-facing dashboards (although poorly grounded in the learning sciences4 ), and if niche products are deployed (e.g., an adaptive tutor for a specific topic), this may deliver feedback to students as well, since there is such a rich model of the curriculum and students' mastery levels.
- If products permit report/dashboard customization, or facilitate data export, and if there is coding/analytical capacity in the center for subsequent analysis and visualization, there is scope to provide bespoke user experiences.
Cons
- Staff typically work only with data that products can provide, delivered via predefined user interfaces. It is very unlikely that a participatory design model has helped end-users to shape a product, with the risk that analytics services are procured with limited consultation and are then poorly received.
- Staff rarely have expertise in educational research, user experience, learning design or advanced analytics techniques, so the scope for analytics innovation within the center is limited accordingly. Such expertise must come from other groups, and most IT service centers have little heritage of collaborating broadly in their work.
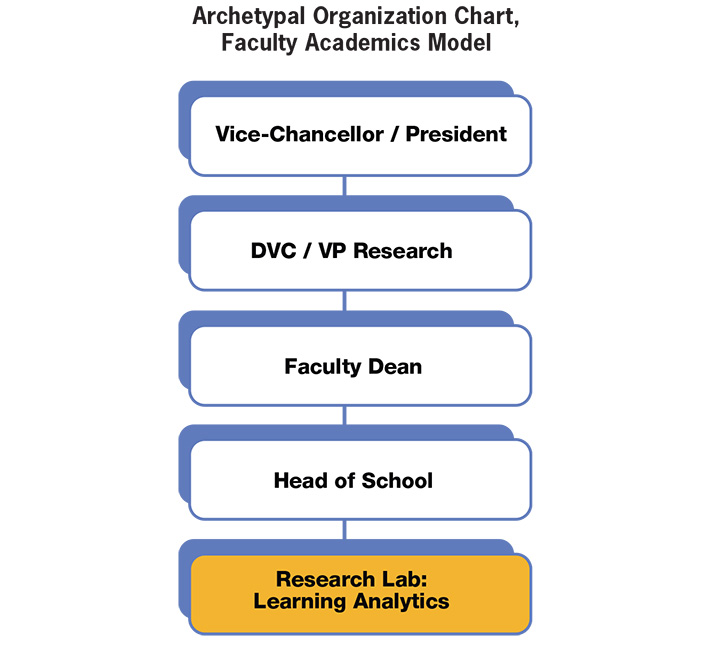
The Faculty Academics Model
In the second model, faculty academics (possibly partnering with an IT service center) conduct applied research. Examples include the following:
- Faculty academics develop innovative learning technologies (often externally funded) to support specific forms of learning not well supported by the LMS. This generates much richer data than typically comes from generic (i.e., discipline-agnostic) LMS products. This may serve as learning sciences research data, as well as data for feedback to educators and students.
- Faculty academics study the acceptance of analytics delivered by their institutional LMS and/or BI teams. They recruit early-adopter academics interested in piloting such analytics, study student responses, and perhaps engage other groups, such as student support teams.
Pros
- This model provides ample scope for radical innovation by academics, who can experiment with exotic sensors and advanced analytics techniques beyond current products.
- Empirical evidence is gathered about the adoption of vendor products, typically identifying obstacles often relating to staff readiness, pedagogical practices that are incongruent with the analytics, or other organizational factors.
- Evidence-based claims are likely to be made with a high degree of rigor, meeting the standards of the human-research ethics board and, when published, of peer-reviewed research.
Cons
- The analytics are advanced but require corresponding researcher expertise to design, deploy, and maintain. This is often a scarce expertise, available on only a temporary basis.
- Since the analytics are advanced, they attract early-adopter academics in pilot studies, but if those academics move on from teaching a subject, the trials end.
- Typically, studies are relatively small scale, and/or use specific student cohorts, and/or are brief in duration (e.g., possible only until external funding expires).
- Researchers are less likely to consider users' needs in design ("customer discovery"), so although prototyping analytics are conceptually interesting, they either are unusable or fail to address widely recognized needs.
- Once the lead researcher or key project staff leave, there is nobody driving the vision for the analytics service. Vision is needed so that resources code maintenance, further grants, strategic visibility, and the all-important partnerships can sustain the innovation.
- Developing a combined software/pedagogical innovation into an enterprise-wide infrastructure is a development task, which is not often rewarded in research metrics and which requires skills that research groups lack.
The Innovation Center Model
In our third model, a hybrid, autonomous innovation center is created to service the entire institution. These innovation centers operate outside—but in close partnerships with—faculty academics, college/university IT/BI/LMS teams, and other stakeholders. Fewer institutions appear to be experimenting with this model, which we now introduce in the context of our own two examples:
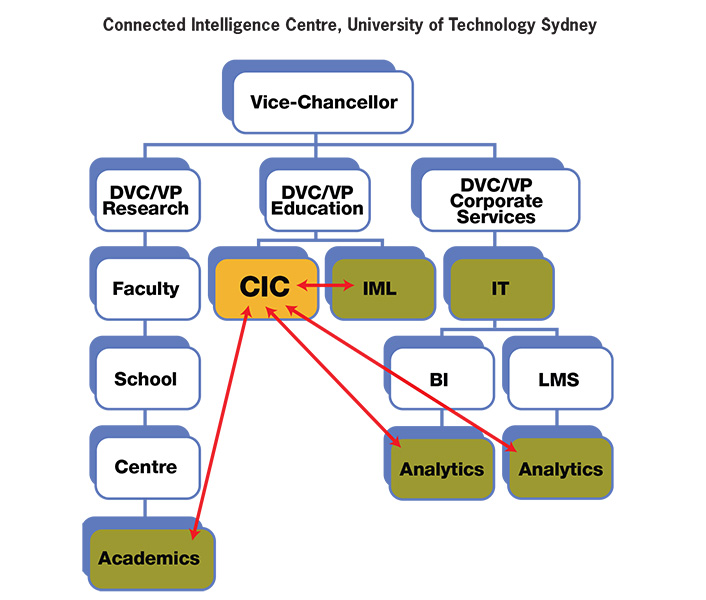
- An innovation center located outside the faculties, and autonomous from institutional IT/analytics, is staffed by research-active academics and data scientists, supported by professional staff. (Connected Intelligence Centre, University of Technology Sydney)
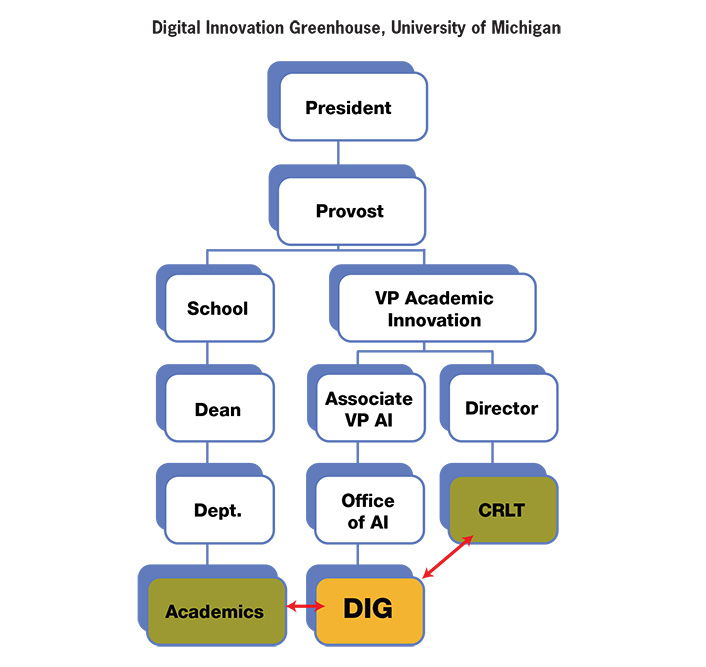
- An innovation center located outside the faculties, and autonomous from institutional IT/analytics, is dedicated to maturing and mainstreaming successful analytics innovations invented by academics, as well as innovating its own analytics services. (Digital Innovation Greenhouse, University of Michigan)
Connected Intelligence Centre, University of Technology Sydney
The Connected Intelligence Centre (CIC) at the University of Technology Sydney (UTS) is an innovation center charged with building the university's capacity to gain insights from analytics tools and techniques —spanning teaching and learning, research, and operational units.5
Staffing
CIC is a small center of about twenty staff (not all full-time). In many ways it looks like an academic group, with researchers at all levels, from PhDs to professors, plus professional support staff.
|
Academic Team |
Professional Services Team |
|---|---|
| Director & Professor | Senior Manager |
| Professor | Course Manager |
| Associate Professor | Marketing/Communications Officer |
| Senior Lecturer x2 | Administrative Assistant |
| Lecturer | Cloud Integration Specialist |
| Research Fellows x2 | Web Developer |
| Data Scientist | Software Developer |
| PhD students x4 | Undergraduate Interns x2 |
| 2-3 Visiting Researchers/Students |
However, while CIC may look like an academic research group—since its mission is to create research-inspired, sustainable innovation within UTS—the academics are recruited not only for their research capability but also for their team-working ability, transdisciplinary outlook, and communication skills. The academics are also talented educators: CIC designed and launched the Master of Data Science & Innovation (MDSI) degree program in 2015, which is coordinated and largely taught by CIC's academics. This was the only degree program at UTS running outside a faculty until 2017, when UTS launched its Faculty of Transdisciplinary Innovation. This faculty will take over the administration of the MDSI program in 2018, but the current staff will continue to teach it.
CIC has thus operated like a mini-faculty, running the MDSI and an elective subject in quantitative literacy and critical thinking ("Arguments, Evidence & Intuition") and launching its own Learning Analytics Doctoral Program in 2016. CIC's Academic Board of Studies is drawn from across UTS to reflect its transdisciplinary nature. These teaching programs generated revenue that gave CIC the capability to grow beyond the baseline funding from the university.
CIC reports to the Deputy Vice-Chancellor for Education. The CIC director thus has the privilege of being able to talk to the Directors of IT, Teaching & Learning Innovation, Student Support, and Library to overcome obstacles to accessing data, get servers running, convene meetings, and more. This opens opportunities at a strategic level that a faculty-based team would typically not access.
Navigating from prototype to (1) small-scale pilots, to (2) pilots with several hundred students, and on to (3) a mainstream rollout to thousands of students will be critical transitions for CIC. The center has managed the first two transitions and this year will move to the third. Moreover, students are starting to expect certain services to be always on, and they complain if there is downtime. CIC is typically pushing the envelope of new technologies (e.g., Amazon Web Services), with encouragement from and in partnership with the IT Division (ITD). But this type of exploration must maintain security and also requires a constructive, friendly relationship with ITD staff, who are finding that servicing CIC's requirements is preparing them for what faculty members will likely be requesting in the future. For example, CIC and ITD co-funded a cloud specialist to assist in supporting MDSI students, in the expectation that before long, other degree programs will be calling on this specialist for cloud services.
Cultivating Research-Grade Innovation in a Non-Faculty Center
Attracting and retaining high-caliber researchers for this work requires the creation of an academically stimulating culture that provides the opportunities and trajectory needed by researchers at different career stages. This includes generating national and international visibility through research conferences, the chance to bid for competitive grants, and time to think and write.
However, running a hybrid academic/service operation requires controlling the innovation/impact tensions mentioned at the beginning of this article. For instance, when is there "enough" evidence, by academic research standards, to scale a prototype that is exciting interest? CIC researchers understand that their work must be designed to add value into UTS, as the primary client, while working in close partnership with faculties and other client groups. Thus, all PhDs are in partnership with one or more faculty academics, providing authentic testbeds but introducing risk factors to a doctoral plan. Software is breaking new ground but is designed as early as possible in consultation with ITD staff, who are not used to any other unit running 24/7 student-facing systems. Analogous to the R&D centers in companies, the CIC mission is to enhance the efficiency of current services, as well as prototype future services, but it cannot chase "blue sky" ideas simply out of curiosity. CIC was created to build sustainable capacity in UTS staff and students to use data science and data analytics tools.
Digital Innovation Greenhouse, University of Michigan
Learning analytics activity at the University of Michigan (UM) began to emerge as a coherent theme of work in 2011, with SLAM: Student Learning and Analytics at Michigan [http://www.crlt.umich.edu/SLAM]. This seminar series combined a forum for exchange of ideas and information among on-campus faculty and staff with an opportunity to connect with external speakers. In 2012, interest in SLAM prompted the UM provost to launch a three-year, faculty-led Learning Analytics Task Force (LATF), charged with promoting expanded use of data on campus and funding a series of learning analytics projects. These projects took two forms: analysis of data to inform policy and practice; and invention of tools designed to put data to work in support of teaching and learning. Several of these tools entered the classroom as pilot projects and attracted external research support.6
The Digital Innovation Greenhouse (DIG) was proposed in 2014 to solve a recurring problem that LATF projects had encountered. Faculty innovators and their research teams had designed, developed, and tested analytics-driven tools designed to improve teaching and learning on campus. These innovations were typically tested in the researchers' home environments, often in courses they had been assigned to teach. When news of their existence and impact became known on campus, interest in expansion to other areas emerged. The founding research groups, while often interested in this expansion, lacked the resources, skills, and/or reward systems needed to mature a seedling innovation into an element of the campus infrastructure.
Several of these projects attempted to grow to scale by handing off their tools to the campus-wide Information Technologies Service (ITS) unit. ITS as an organization is very good at staging and supporting mature software systems. Unfortunately, the unit's skills and organizational approaches are ill-matched to adopting the loose, rapid, "duct tape and chewing gum" development methods of researchers. Finally, to take advantage of the vibrant innovation community emerging on campus, DIG was created as a pilot in 2015. Its mission was to adopt a series of existing digital-engagement innovations from the research labs they had outgrown, carry them across the innovation "valley of death," and deliver them to ITS as infrastructural tools that could be used campus-wide. In doing this, DIG achieved both the immediate goal of making existing research tools much more widely available and the longer-term goal of demonstrating the importance of this greenhouse approach to the development of 21st-century digital-engagement tools.
To create a home for DIG, the university turned to the recently formed Office of Digital Education and Innovation. This unit, which reports to the Vice Provost for Academic Innovation, was created in 2013, initially to provide a home for UM's newly emerging involvement in MOOCs. It has since become the focal point for campus-wide educational R&D efforts, and in 2016 the unit was renamed the Office of Academic Innovation (OAI). Today, OAI is home to teams working on three major themes: designing, developing, delivering, and experimenting with online and hybrid education; growing analytics-driven educational innovations to scale; and promoting gameful design of educational experiences. These teams often work in collaboration with the campus's long-standing Center for Research on Learning and Teaching (CRLT), especially on projects that focus on residential learners.
Staffing
DIG projects advance in a highly collaborative environment including at least four elements:
- Faculty champions and their research teams. Each project enters DIG with a principal advocate drawn from the faculty, usually accompanied by members of the research team. DIG is now also exploring how to support innovations backed by students and staff. Innovators help to drive the vision for each project. In addition, they regularly lead efforts to research innovation design and impact, often with external support.
- The DIG team of software developers, user experience and interface designers, behavioral scientists, and innovation advocates. This group provides the professional skills and reward system needed to mature innovations technically, in close interaction with the expanding user community. Full-time DIG staff are supported by an array of graduate and undergraduate student fellows who provide additional effort, a fresh design view, and close contact with DIG tools.
- An expanding campus community of users, from early adopters to those hoping to use DIG tools as infrastructure. Continuous, intensive interaction with this community of faculty, staff, and students is essential to the success of DIG tools. The DIG team forms the liaison between faculty innovators and this community, putting in the time and effort required to establish and maintain deep and mutually beneficial relationships.
- The UM ITS organization. The DIG team interacts with ITS both to obtain the required infrastructure support (e.g., servers, single-sign-in authentication, access to data) and to ensure that the development cycle for DIG tools stays within campus ITS structures.
From these four groups, only the core DIG team is officially employed within the OAI. Originally established as a team of three senior software developers, the DIG team now includes a continuously growing, full-time staff of fifteen.
|
Academic Team |
DIG Staff |
|---|---|
| Faculty Director | Lead Software Developers x4 |
| AI Operations Director | Software Developers x4 |
| Faculty Champions x7 | Lead Behavioral Scientist |
| Behavioral Scientist | |
| Lead Innovation Advocate | |
| Data Scientist | |
| UX/UI Designers x3 | |
| Student Fellows x10-15 |
Funds for this staff come from three sources: a UM Third Century Initiative grant that provided for the launch of DIG; additional investments made from the university through the OAI budget; and project funds obtained from various sources (NSF and other grants). Excellent administrative support comes from OAI and has proven essential to creating and maintaining a nimble, responsive organization within an occasionally leisurely and conservative campus community.
Engaging Faculty in Academic Innovation
DIG was established within the OAI as a staff unit, without official appointments for any members of the faculty. The model is predicated on close collaboration between faculty champions, their research groups, DIG staff, and the broader community of educational practitioners across campus. Although this model has worked well, it has created significant tensions for some faculty members, particularly those for whom education is not a research focus. They find themselves doing this work in addition to their existing responsibilities for research, teaching, and service. Championing an analytics-driven innovation as it expands across campus is not a small task, even when receiving the extensive professional support the DIG team provides. Indeed, the rapid pace of development and expansion that the DIG team can deliver makes the job of the faculty champion more challenging. For this reason, DIG has come to think of the activities taking place in the OAI as educational R&D—applied research aimed at reinventing higher education for an information age. With this lens, DIG and OAI can be seen as a research institute, akin to UM's long-standing Institute for Social Research or its Life Sciences Institute. These units provide associated faculty members with appointments of varying kinds, ranging from 100 percent salaried positions to 0 percent affiliated faculty status. In 2018, OAI will explore offering appointments of this kind to ensure that faculty champions have the support they need to accelerate innovations to scale.
Reflections on the Innovation Center Model
CIC and DIG started at different points and in response to different drivers. CIC has been home to research-active academics from its launch, running its own master's and PhD programs, but it now needs to build developer capacity as demand grows for its analytics tools. In contrast, DIG launched with technical staff to scale innovations from existing faculty academics, but it is now considering new models for engaging academics. Today, DIG and CIC seem to be moving toward common ground: they are both autonomous centers reporting to a VP/DVC, tasked with innovating data and analytics infrastructure to tackle strategic teaching and learning challenges, while working in partnership with faculties, teacher professional development, and IT services.
At this point, it is too early to declare these centers to be the blueprint for success; however, we can summarize the CIC and DIG hallmarks:
- Having the center report directly to a senior leader at the VP/DVC level provides the strategic positioning needed to effect change around, for instance, access to data and the provisioning of campus-wide analytics services or innovations.
- The center either incorporates academics and research students (CIC) or works very closely with them in their faculties (DIG). This enables the center to conduct research-inspired innovation, in analytics that are grounded in educators' and students' needs, leading to evidence-based claims and satisfying ethical standards.
- The center has the core mission and the capability to translate those innovative ideas into robust analytics services, to specifications approved by the IT division (e.g., security, architecture), integrating with the institution's enterprise infrastructure. As CIC's prototypes begin the transition to more widely scaled internal "products," it is recognizing the importance of having a DIG-scale software design, development, evaluation, and communications team.
- The center can supplement its institutional funding with other income including externally funded joint projects with faculty, internal strategic grants with faculty, student fees from formal teaching programs, and faculty buyouts of teaching time from the center's academics.
- By creating a campus-wide focal point for the development of analytics-driven tools, the center can create significant efficiencies of design and synergies of operation. For example, for access to campus data, the DIG team has developed a shared, extensible framework that can be used by all tools, preventing the need to re-create this framework for each tool. It has also worked to coordinate a toolkit of elements generally useful for education at scale in large foundational courses, increasing the adoption of the full suite of tools. Similarly CIC, having better understood the diverse needs of academics, has re-architected the writing-feedback tool to expand the range of services it can offer.
- If (like CIC) the center is hosting its own academics and doctoral students, it looks very much like faculty research groups. Therefore, the center must be very clear that it is not simply doing research "business as usual" but is working on data challenges faced by the institution and is adding value through generic/customized analytics services for academics, students, and professional business units from across the campus. All of the center's innovations must be conducted in collaboration with institutional "clients."
- If (like DIG) the center houses only staff and collaborates with faculty who are offered no official role in the organization, it may be placing a significant burden on both faculty innovators and early adopters from its community of practice. The reward systems for faculty members at research universities are finely tuned, leaving little allowance for the recognition of new forms of activity. Unless these innovative types of activities are accepted as either research or service by faculty members' home departments, the faculty must contribute effort without recompense.
- The center complements but does not duplicate the work of the campus division that is leading academic professional development in teaching and learning. These well-established teaching and learning centers bring expertise in pedagogy and academic development but do not have the capacity to develop the college or university's learning analytics capability. For example, CIC has worked very fruitfully with the UTS Institute for Interactive Media in Learning, whose Academic Learning and Literacy specialists have advised on the CIC automated writing-feedback tool and have coauthored research papers. DIG and its leaders are collaborating closely with UM's Center for Research on Learning and Teaching on the launch of a Foundational Course Initiative and with the Sweetland Center for Writing on the M-Write project.
- The center complements but does not duplicate the work of the IT division. Colleges and universities already have an established LMS and BI unit, but the center's focus is on modes of learning, forms of data, and analytics user groups not covered by such units. The center must liaise closely with other units and divisions that are concerned with data governance and may be developing novel services to test frameworks. Similarly, the center may well be the first non-IT group provisioning 24/7 student- or staff-facing software applications, requiring solid IT partnership to ensure security, network services, responsive maintenance, and so forth. The IT collaboration should be mutually beneficial. For instance, CIC and DIG have provided IT staff with secondment opportunities to work in an environment more akin to a startup, on different projects developing new skills.
- The center starts to develop platforms that advance the work of faculty researchers, in domains other than teaching and learning. For example, DIG's ECoach tool has been used as a platform for conducting experiments in social psychology, online engagement, and the visual display of quantitative information. Similarly, CIC's text analytics platform, social media activity aggregator, and multimodal collaboration analytics can be generalized to non-educational contexts, to benefit other UTS academics.
Finally, it is perhaps not a coincidence that both CIC and DIG have converged independently on common strategically important teaching and learning challenges. We are excited about the potential for collaboration around the role that analytics can play:
- Personalized messaging enabling feedback at scale. Although all the educational evidence points to the importance of timely, actionable, and personalized feedback for effective learning, providing this feedback is particularly challenging in large classes. Both universities have developed platforms that permit academics to craft coaching messages to students contingent on their progress (e.g., over a week): UM developed the earlier noted ECoach platform, whereas UTS has been running its own personalized messaging platform for a decade and is a partner in the Australian national OnTask project developing an open-source tool. The role of the analytics is to analyze students' activity profiles from multiple data sources and compile the feedback into a personalized e-mail, with a growing evidence base that this feedback is well received by students and improves their outcomes.7
- Text analytics for student writing feedback. Critical, persuasive, reflective, academic writing is hard to learn, hard to teach, and hard to give rapid feedback on. Both universities are developing applications of Natural Language Processing to give instant formative feedback (not summative grades) on students' drafts as a way to encourage revision and reflection. These applications require scaleable text analytics platforms, tuned to the specific writing features that will enable actionable feedback. Common to both efforts (the UTS Academic Writing Analytics tool and research program and the UM M-Write initiative) is the recognition that such tools are most effective when aligned with good "'learning design"—that is, congruent with the curriculum, assignment activities, and grading rubrics.
- Human-centered analytics. Software design has gradually shifted from being technology-driven to human-centered, and it is no coincidence that both universities have academic professionals from human-computer interaction on their teams, as well as designers who care about the user experience. The human dimensions of learning analytics are diverse, from deciding what the overall user needs are, to designing the user interface and evaluating how users engage, to considering the ethics of data, algorithms, and visualizations. Finding ways to involve stakeholders early on, through participatory design methods, is critical to achieving these aspirations.8
Conclusion and Invitation
We have introduced the dilemma that higher education institutions face: how can they architect themselves organizationally to both innovate learning analytics (the traditional province of faculty researchers) and see the learning analytics deliver sustainable impact through mainstreamed services (the traditional province of LMS/IT units)—which, furthermore, are rigorously evaluated (a conventional faculty role)? We have documented two examples of a new model: the hybrid learning analytics innovation center, reporting to senior leadership and working in close partnership with faculties and service centers.
The hallmarks of our centers are from just two exemplars, and we recognize that these do not reflect the diversity of institutional contexts. Please treat this as an invitation to respond. We offer these reflections as a conversation opener, and we welcome feedback, including examples of other organizational models tackling this challenge.
Notes
- Simon Knight and Simon Buckingham Shum, "Theory and Learning Analytics," chapter 1, and Ruth Crick, "Learning Analytics: Layers, Loops and Processes in a Virtual Learning Infrastructure," chapter 25, both in Charles Lang, George Siemens, Alyssa Wise, and Dragan Gašević, eds., Handbook of Learning Analytics (Beaumont, Alberta: Society for Learning Analytics Research, 2017).↩
- Madeline Huberth, Patricia Chen, Jared Tritz, and Timothy A. McKay, "Computer-Tailored Student Support in Introductory Physics," PloS ONE 10, no. 9 (September 9, 2015). ↩
- Barry J. Fishman, William R. Penuel, Anna-Ruth Allen, and Britte Haugan Cheng, eds., Design-Based Implementation Research: Theories, Methods, and Exemplars, National Society for the Study of Education Yearbook (New York: Teachers College, Columbia University, 2013); Eileen Scanlon et al., Beyond Prototypes: Enabling Innovation in Technology-Enhanced Learning (London: Technology Enhanced Learning Research Programme, [2013]). ↩
- oana Jivet, Maren Scheffel, Marcus Specht, and Hendrik Drachsler, "License to Evaluate: Preparing Learning Analytics Dashboards for Educational Practice" (preprint), in Proceedings LAK18: International Conference on Learning Analytics and Knowledge (Sydney, March 5–9, 2018). ↩
- For more details on the organizational history leading to the creation of CIC and the focus of its analytics R&D, see: Rebecca Ferguson et al., "Setting Learning Analytics in Context: Overcoming the Barriers to Large-Scale Adoption," Journal of Learning Analytics 1, no. 3 (2014); Riina Vuorikari and Jonatan Castaño Muñoz, eds., Research Evidence on the Use of Learning Analytics: Implications for Education Policy, European Commission Joint Research Centre (JRC) Science for Policy Report (2016).↩
- For more details on the organizational history leading to the creation of DIG and its focus on growing analytics-driven innovations to scale, see Steven Lonn, Timothy A. McKay, Stephanie D. Teasley, "Cultivating Institutional Capacities for Learning Analytics," New Directions for Higher Education, no. 179 (Fall 2017). ↩
- Mary C. Wright et al., "Better Than Expected: Using Learning Analytics to Promote Student Success in Gateway Science," Change: The Magazine of Higher Learning 46, no. 1 (2014); Huberth et al., "Computer-Tailored Student Support in Introductory Physics."↩
- UTS and UM work relating to human-centered analytics includes the following: Michael Geoffrey Brown, R. Matthew DeMonbrun, and Stephanie D. Teasley, "Don't Call It a Comeback: Academic Recovery and the Timing of Educational Technology Adoption," Proceedings of the Seventh International Learning Analytics & Knowledge Conference (New York: ACM, 2017); Simon Knight et al., "Designing Academic Writing Analytics for Civil Law Student Self-Assessment," International Journal of Artificial Intelligence in Education 28, no. 1 (March 2018); Steven Lonn, Stephen J. Aguilar, and Stephanie D. Teasley, "Investigating Student Motivation in the Context of a Learning Analytics Intervention during a Summer Bridge Program," Computers in Human Behavior 47 (June 2015); Carlos G. Prieto-Alvarez et al., "From Co-Design to Learning Analytics Deployments: Bringing together Educators, Students, Researchers and Developers," in Jason M. Lodge, Jared Cooney Horvath, and Linda Corrin, eds., From Data and Analytics to the Classroom: Translating Learning Analytics for Teachers (London: Routledge, in press, 2018).↩
Simon J. Buckingham Shum is Director of the Connected Intelligence Centre, University of Technology Sydney.
Timothy A. McKay is Founder of the Digital Innovation Greenhouse, University of Michigan.
© 2018 Simon J. Buckingham Shum and Timothy A. McKay. The text of this work is licensed under Creative Commons Attribution-ShareAlike 4.0.
EDUCAUSE Review 53, no. 2 (March/April 2018)