
Service catalogs present the IT services available to campus stakeholders in an easy-to-understand format that communicates the value of those services and supports a service-oriented organizational approach to central IT.

Imagine starting your own restaurant. What kind of food would you serve? Expensive entrees? Would you get your desserts from local bakeries or make them yourself? We can think of the types of food offered and how it is provided (in house or outsourced) as analogous to an IT service portfolio—it contains all IT services offered by an institution. Now imagine a customer sitting at your restaurant. Would the menu contain a step-by-step recipe for a complex dish rather than the name of the dish? A list of ingredients doesn't tell you what the final product is, nor does it describe the value the customer will receive from this culinary delight. For a menu, you'll want a succinct description of the entree and a description of how the meal enhances your customer's gustatory journey, not the ingredients. We can view IT service catalogs as a "menu." A service catalog provides an easy-to-use online portal for campus customers—faculty, staff, students, and other stakeholders—to learn about and request the services the institution's IT department provides.1
This article presents results from the 2017 EDUCAUSE Core Data Service (CDS) survey, which asked institutions to report the services for which their central IT department had primary responsibility.2 We hope that this information can offer institutions a guide for benchmarking central IT service portfolios—identifying which IT services they should be providing while also identifying a service catalog "starter pack" that can guide IT departments in the development and implementation of service catalogs.3
A service catalog can increase efficiencies in service, identify duplicate services, or identify users' potential needs based on their login credentials.4 Similar to a restaurant's seasonal menu, service catalogs can also be used as an ongoing tool to communicate the annual changes in IT services to student populations, faculty, researchers, and staff. A service catalog can also aid in improving IT responsiveness to the varied needs of institutional users (e.g., students, faculty) and customers (e.g., administrative departments) and improve planning so IT investments and activities better align with institutional needs.
Implementing a service catalog can also be transformative, helping move institutional IT from a technology components organization to a service-oriented organization that facilitates institutional outcomes. This means that the service catalog reflects the outcomes that the service enables the user to achieve, rather than being simply a list of services provided. For example, a service outcome might be "increased space for research data storage" not "cloud storage," or "phone conferencing" rather than "telephony."
One challenge of creating and implementing a service catalog is how to effectively represent IT services in an understandable format for stakeholders while also serving as a useful structure for service operations and improvement. Similar to delineating sections of a menu such as "salad," "pasta," "fish," or "dessert," identifying service categories and the services within each category is a first step in leveraging a service catalog for ease of use and achieving institutional aims. The ECAR working group paper The Higher Education IT Service Catalog: A Working Model for Comparison and Collaboration defines eight service categories that span most institutions' strategic areas and are analogous to menu sections such as "entrees" or "desserts." Within these eight service categories there is also a list of common IT services that deliver outcomes to institutional stakeholders—the menu items.
For institutions contemplating the sections of their central IT service menu, figure 1 presents the average number of services for which central IT has primary responsibility compared to the number of possible offerings in each category.5 For example, respondents reported that, on average, central IT provides seven out of a possible seven core infrastructure services. Central IT also has primary responsibility for most of the services within the categories of end-point computing, IT professional services, communication and collaboration, and security.6
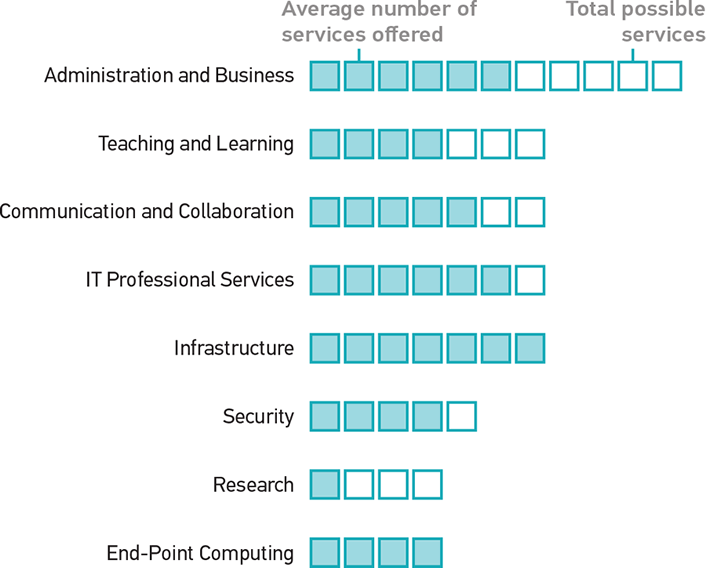
By contrast, central IT typically provides fewer of the services within the categories of research, teaching and learning, and administration and business. One explanation for this finding is that some of these services are provided by the university but not by central IT. For example, IT in a specific academic department may have responsibility for research computing. To draw on our analogy, these items are often available to customers in the neighborhood but won't be found at the central IT restaurant.
To further illustrate the general proportion of possible services that central IT offers, we identify in figure 2 the frequencies of services for which central IT had primary responsibility at more than 80% of institutions (no services in the research category reached this threshold). Institutions can use the most frequently reported services within each category to benchmark their own offerings against those of other institutions; to highlight to institutional stakeholders which services most institutions run centrally; or as an initial roadmap for institutions seeking to create a service catalog.
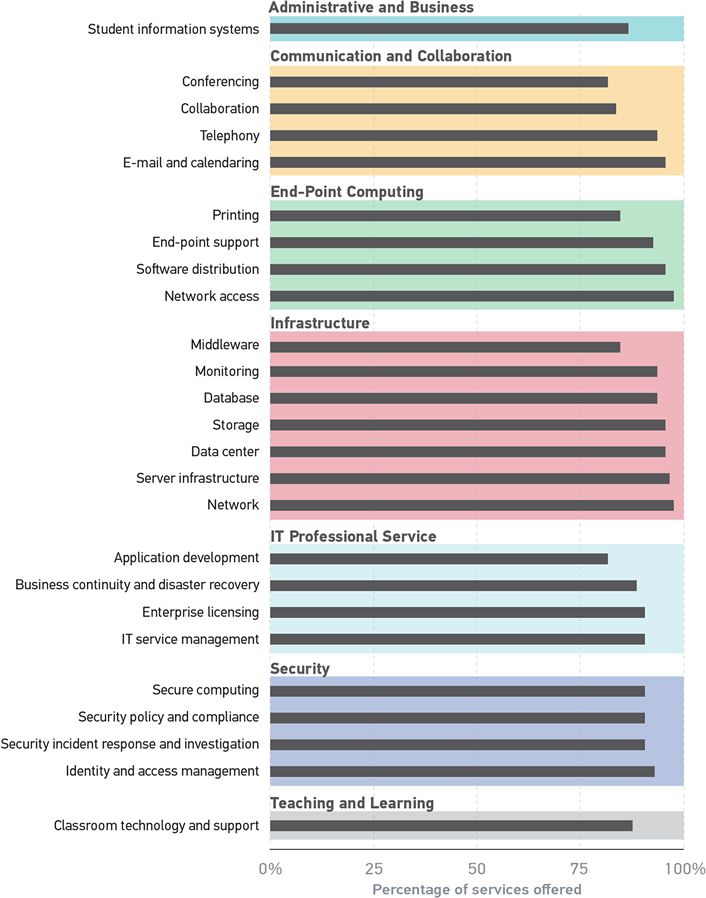
Administrative and Business: Student information systems are the most commonly reported service (87%), followed by finance, human resources, and procurement systems. Very few institutions reported that central IT has primary responsibility for medical and health systems (20%).
Communication and Collaboration: Over 90% of institutions reported that central IT has primary responsibility for email and telephony. Fewer institutions reported central IT having primary responsibility for websites (64%).
End-Point Computing: All services were 85% or higher: network access, software distribution, endpoint support (desktops, mobile devices, etc.), and printing. Network access was highest at 98%.
Infrastructure: All services were 85% or higher: network, service infrastructure, data center, storage, database (i.e., hosting and administration of databases), monitoring, and middleware.
IT Professional Services: All of the following services were 80% or higher: IT service management, enterprise licensing, business continuity and disaster recovery, application development, and consulting and advising. However, training was slightly less than 70%.
Research: This service category had the lowest percentage of institutions reporting that central IT has primary responsibility for the services within. Across all institutional types, 32% reported that central IT has primary responsibility for research computing.7 This finding reflects faculty's reports that they need more IT support for their research activities.8 Although IT departments might frequently turn to vendors for implementing cloud storage for research data or have department-specific research computing departments, this low percentage of research services offered reflects a continuing need across higher education institutions.9
Security: Identity and access management had the highest percentage of institutions reporting that central IT had primary responsibility (93%). Security consulting was lowest at 73%.
Teaching and Learning: Only one of the seven services had more than 80% of institutions reporting central IT responsibility: classroom technology and support. Slightly fewer than 80% of institutions reported that central IT had primary responsibility for technology-enhanced spaces (79%) and learning management systems (73%).
Based on these findings, we offer the following suggestions for central IT to engage in effective service management:
- Institutions seeking to understand how to strategically manage their IT services should consider centralization of core IT services within categories such as infrastructure, IT professional services, and security while sharing responsibility for the services within categories such as teaching and learning and research.
- Institutions seeking to implement a service catalog may find the most success starting with well defined, commonly centralized service categories like infrastructure, end-point computing, security, IT professional services, and communication and collaboration. Within these categories institutions can then identify relevant services for their campus stakeholders and prioritize these based on institutional objectives.
- IT departments should identify a way to represent shared or distributed IT services in a service catalog, which would offer a more complete picture of the full range of services offered across a campus. This approach could provide, for example, more detail on which shared or distributed services are offered for research or for teaching and learning.
Right-sizing an IT service portfolio and representing that portfolio in a succinct service catalog can be a daunting task. It entails effective governance and communication across the institution, but the tangible rewards for institutional stakeholders ensure the efforts are warranted. Sitting down with an IT department's service catalog should be similar to reading a menu at your favorite restaurant. The menu might not be something that you may remark on, and it might not contribute to the enjoyment of your meal, but it could be the most important aspect of your experience. If the menu does not include the options you need, is hard to understand, or is not organized effectively, you might be left wondering whether you'll leave the dining experience feeling sated. Consider your customers and offer them meals you know they'll love and make their dining experience user friendly and enjoyable. Bon appétit!
Acknowledgments
Thanks to Kate Roesch for her critical contributions in data visualization for this article and Gregory Dobbin for his editorial expertise. These staff ensure that our work is accessible, clear, and visually engaging to our readers.
Notes
- For a more detailed description and guidance in creating a service catalog, see Tamara Adižes et al., The Higher Education IT Service Catalog: A Working Model for Comparison and Collaboration, ECAR Working Group Paper, April 10, 2015. ↩
- Data represent services that most likely live in an institution's central IT service portfolio. ↩
- Want access to data like this? Participate in the 2018 CDS survey and gain access to data used for this article and more. The survey is due November 16, 2018. Visit www.educause.edu/coredata for information on how to get started. The question for this article is from the IT Organization, Staffing, and Financing Module, Question 6 ↩
- Tamara Adižes, Mark Katsouros, Reginald Lo, Simon Pride and Karalee Woody, August 11, 2014. "The Unified IT Service Catalog: Your One-Stop Shop," EDUCAUSE Review, August 11, 2014. ↩
- A total of 768 institutions responded to the following survey item: "To contextualize your institution's central IT financial and staffing data, please indicate the services for which central IT had primary responsibility for providing during the fiscal year." Respondents either checked whether their central IT had responsibility or left the subcategory blank. Percentages represent total number of institutions that selected each item. ↩
- Adižes et al., The Higher Education IT Service Catalog. ↩
- For DR institutions (both private and public), which have higher numbers of research faculty, these percentages were similar (33%). Sixty-three percent of DR institutions reported research computing as a service central IT had primary responsibility for, which was the highest among the research category services. Advanced applications was 24%, lab management was 20%, and visualization was 23%. ↩
- Joseph D. Galanek and D. Christopher Brooks, Supporting Faculty Research with Information Technology, research report (Louisville, CO: ECAR, June 2018). ↩
- Susan Grajek and Joanna Lyn Grama, Higher Education's 2018 Trend Watch and Top 10 Strategic Technologies, research report (Louisville, CO: ECAR, February 2018). ↩
Joseph D. Galanek is Senior Researcher at EDUCAUSE.
Leah Lang is Director of Analytics Services at EDUCAUSE.
© 2018 Joseph D. Galanek and Leah Lang. The text of this work is licensed under a Creative Commons BY-NC-ND 4.0 International License.