
[This article is the fourth in a 2017 series that presents case studies related to the theme of integration and partnerships as reflected in enterprise IT:
- Communicating the Business Value of Enterprise IT
- Integrating Data and Systems to Support Next-Generation Enterprise IT
- Aligning Institutional Processes Through Business Process Redesign
- Supporting Analytics through Data Integration and Governance
In this article, IT leaders describe how their institutions have used governance best practices to support institutional analytics initiatives.]
The changing landscape of enterprise IT is characterized by an expanding set of services, systems, and sourcing strategies as institutions move away from monolithic ERP solutions in an effort to increase agility and scalability and meet stakeholder demands for new functionality, services, and information. This time of change offers an opportunity for institutions to examine their data and analytics resources and needs. As the Enterprise IT Program completes its 2017 focus on integration and partnerships, the following case studies address ways that IT can support an institution's continuing and growing need for reliable information in the face of these changes.
Drake University
Chris Gill, Chief Information Technology Officer
Kevin Saunders, Director of Institutional Research and Assessment
Institutional Profile
Drake University is a masters-level, comprehensive university located in Des Moines, Iowa. Founded in 1881, and named for one of its founders — Civil War General Francis Marion Drake — the university has been coeducational and international from the beginning. Drake was founded to combine traditional study in the liberal arts with programs in science, law, and other professional fields.
Today, Drake remains focused on combining the liberal arts with professional preparation. It offers more than 70 undergraduate and 20 graduate degrees in Arts and Sciences, Business and Public Administration, Education, Journalism and Mass Communication, Law, and Pharmacy and Health Sciences. It is ranked as the third best Midwest regional institution by U.S. News & World Report, and as one of the top 10 midsized universities in the country by the Chronicle of Higher Education.
Overview
In February 2011, Drake University purchased a commercial data warehouse system designed for higher education. Initial implementation began with high expectations, but stalled over time before the value of the product was realized. Chris Gill serves as the Chief Information Technology Officer and Kevin Saunders is Director of Institutional Research and Assessment at Drake University. Both have participated in unsuccessful data warehouse implementations. In this case study we describe the partnership we developed to revitalize the warehouse at Drake and the lessons learned from our experiences.
Changing the culture of decision support at a university is complex and difficult. Much like other complex organizations working to develop decision support maturity, our university must address a common constellation of challenges: a culture of siloed data consumption and analysis, limited data governance and process, many reports but no single version of the truth, and unclear expectations and objectives for data-based decision making. The question facing every organization with immature decision support processes is "Where do we start?" Seemingly everything needs to be addressed at once, creating a classic chicken-or-egg dilemma.
At Drake, we have learned from our early setbacks and worked together to build a sustainable and scalable foundation while providing actionable information to help address specific administrative and academic challenges. The approach used at Drake has been to start small, solve specific problems to create value, build capability and process, and work with executives to ensure adoption and use.
The Drake team has taken a continuous improvement approach to resolving the decision support chicken-or-egg dilemma. Continuous improvement relies on small, iterative initiatives and performance measures to drive and assess progress toward large goals. Our strategy is based on the following framework:
- IT and IR operate as true partners, working together to achieve shared goals that would be impossible in isolation.
- We have started small and addressed real business problems such as converting static reports to dynamic electronic resources, improving analytical capabilities for admissions, and creating a self-service reporting portal to host electronic information.
- We have worked within existing resources. Our goal has been to demonstrate immediate, practical value while simultaneously planning for the future. Once the value proposition is clear, we will work with institutional leadership to resource decision support at the level they determine is appropriate for Drake.
- We have worked closely with university leaders to identify specific decision support needs and championed business practices that embed validated analytic information into decision processes.
- In parallel with delivering immediate value, we have begun to articulate and implement a comprehensive data governance model for the entire institution, again by starting small and working outward.
- We have begun to craft a long-term vision/strategy for improving decision support maturity using a continuous improvement model. We have based our strategy on maturity models provided by EDUCAUSE and the Education Advisory Board (EAB).
- We have intentionally engaged key stakeholders through regular updates to existing governance and coordination groups on campus and through individual outreach.
Stakeholders
In order for our institutions to change their decision support maturity effectively, we must recognize that interactions with stakeholders need to function in a different manner and carefully consider how to shape them. Drake experienced two specific pitfalls when it failed to consider the changing dynamic of stakeholder engagement needed to promote organizational change. First, the institution did not fully consider how the failure to achieve the stated objective of universal access to the warehouse and delivery of new, easy-to-use, dynamic reporting tools would result in a loss of trust across a broad set of stakeholders. Second, Drake did not anticipate how the lack of data governance and integrated reporting mechanisms (e.g., data definitions, shadow databases, siloed reporting structures) would create a set of structural challenges that interfered with the university's ability to make sustainable progress in the adoption and use of decision support information.
In our second attempt at Drake, we employed multiple strategies to address these challenges. We intentionally articulated to stakeholders the reasons for the initial failure in business intelligence efforts, the specific changes that we would make to address the known challenges, a newly defined scope of work with clearly defined objectives, and the process we would use to communicate results. We framed this "pilot study" as a proof of concept to senior institutional leaders in order to demonstrate the potential return on the initial investment to build the decision support infrastructure and ultimately as a method to begin building trust in the infrastructure and its ability to empower decision makers.
During the design and implementation of this pilot study, the significant limitations of data governance, data integrity, and decentralized data sources created consistent barriers. For example, we found that a relatively simple concept of generating a "student credit hour" report was more difficult than anticipated without a clear definition of the measure "student credit hour" (registered, billed, completed), a shared understanding of the unit of analysis (department, subject code), or a universal data source (ERP versus unit-level data marts). Combined, these limitations produced an environment where multiple independent reporting efforts resulted in different results rather than a single source of truth.
In an effort to address the barriers mentioned above, we engaged various stakeholders in specific ways:
We brought decision support analysts and consumers together to share ideas and build skills.
- We engaged subject-matter experts early in the design and development of reports.
- We addressed data discrepancies early, with clear communication regarding the implications for future reporting practices.
- We provided individualized training for consumers on decision support tools to align reports with unit-level needs and promote unit-level adoption.
- We created a fast-track data definitions working group (based on a model developed at Notre Dame).
- We collaborated across functions to identify reporting needs (and possible implementation strategies) that span organizational structures.
Impacts
Based on our experience, institutions that successfully support new decision support processes and attend to effective change management are likely to realize multiple benefits. As we methodically increased both outreach and output, we noticed a significant change in the recognition by multiple stakeholders of the need to address long-standing data quality and governance gaps. As institutions become more aware of the need for validated and standardized data, the obstacles to data quality gain important visibility. Efforts to enhance the foundational quality of data and to address business practices that affect data input will result in greater efficiency and accuracy. Simply put, the discovery of these gaps promotes institutional action due to increased awareness and sensitivity.
In addition to the data infrastructure, we learned about the need to consider changes to organizational structures. We restructured our business intelligence development work by creating a multi-unit collaborative team of IT, Institutional Research, and Registrar staff that meets weekly as a project management team. Similar to the data integrity discoveries, we continue to identify places where our current reporting structures create redundancies and inefficiencies. While previous reporting structures resulted in a unit-centered focus on operational needs, the shift to organization-wide decision support priorities highlighted necessary organizational changes that are needed to better support a new decision support model.
Perhaps one of the most significant changes we noted involves specific efforts by the institution to embed business intelligence within the decision-making process. Institutional leaders now articulate the importance of aligning valid, standardized data with various business practices and decision-making processes. For example, we worked with university leaders to change the process for requesting new faculty positions by requiring the integration of multiple standard metrics, which are then used to evaluate the merit of multiple requests across the institution. As we articulate the importance of data-informed decision making, we increasingly invite colleagues across the institution to reimagine previous reporting strategies in ways that align those strategies with robust and reliable analytical information from our data warehouse. For example, we are developing self-service reports that will enhance and standardize budget management and forecasting capabilities for budget managers at both the unit and institutional levels.
Lessons Learned
As a result of our efforts, we learned how IT and Institutional Research can form a natural partnership when the right environment exists. Some essential components include:
- A desire to work together, without owning or trying to control ownership, with the primary goal of partnering to promote achievement of shared organizational goals
- A lack of ego that invites multiple ideas and proposals in a cross-functional, shared manner
- A jointly developed, shared vision designed to enhance the organization's decision support strategy
- A sense of urgency that pushes to make things happen, uses creativity to address challenges, and builds on imagination to look past the old ways of doing things
- A recognition of how to best use limited resources in a cooperative manner to get things done
- A cross-functional team with multiple perspectives, sets of expertise, and a willingness to consider different strategies
We also learned a great deal both about how to and how not to implement a decision support initiative:
- The importance of delivering value early and often. In fact, our entire approach has shifted from deploying a broad analytical self-service toolkit to the delivery of specific pieces of usable, actionable business intelligence.
- An intentional commitment to engagement. It's not enough to give stakeholders a report; rather analysts need to sit with decision makers to understand their questions and help them find answers.
- A willingness to learn. We need to learn from previous failures, design new approaches, and initiate change by starting small.
- A drive and curiosity to grow. Over time our ability to mature the sophistication of our decision support system has grown and the questions have become more complex. This is just what we want.
- A well-thought-out plan. It's great to have a vision, but that has to be translated into a plan that can be executed effectively. In truth, we would agree that we still have work to do here.
- Strong executive support. Independently, IT and IR will share a similar vision regarding the challenges, but to achieve success, a clear need and vision must be articulated to institutional leaders. Without this executive leadership support, the initiative will likely not succeed.
We also acknowledge the sheer hard work that accompanies a movement to change institutional culture. Implementing an effective, mature culture of decision support requires vision, planning, commitment, and patience. We remind ourselves regularly of the need to be comfortable with a long-term mind-set and remain in a state of dynamic tension for long periods of time.
Although we recognize that we are in the early stages of pursuing a strategy to continuously improve our decision support maturity and capability, we believe that the plan we are pursuing promises greater, more sustainable success than our earlier efforts. We are optimistic that the steps we are taking today will help Drake University to continue to thrive by integrating data-informed decision making into the fabric of the university's culture.
Where to Learn More
- Drake University Continuous Improvement Plan
The University of Tennessee
Jay Eckles, Director of Business Intelligence
Institutional Profile
The University of Tennessee (UT) is the state's oldest and largest public institution of higher education. This flagship land-grant university comprises four campuses and three institutes and has a presence in each of Tennessee's 95 counties. Each year more than 11,000 students graduate from UT campuses across the state and earn bachelor's, master's, doctoral, and professional degrees. The UT system enrolls nearly 50,000 undergraduate and graduate students statewide each year.
Overview
Developing a business intelligence (BI) strategy and implementing it is 10% technical change and 90% organizational change. While organizational change is hard, it is not impossible, even following multiple failed attempts to develop an organization-wide shift. Most organizational leaders understand organizational principles — many of them held professional roles as project managers earlier in their career — and most have had training on topics such as effective meetings and team dynamics. Yet we often neglect to apply those principles.
Past attempts at developing a business intelligence initiative at the UT system were typically driven solely by the IT department, with poor results whose inevitability are now obvious in hindsight. At various times stakeholders were either uninterested in working through differences or actively resistant to changes that IT was pushing. In some cases failures took the form of initiatives quietly losing steam and eventually being forgotten — and in some cases failures resulted in executive firings.
But in 2015, a renewed BI initiative at UT was led for the first time by an equal partnership between IT and Institutional Research (IR). Together they developed a group — the Business Intelligence Community of Practice — that included partners from every campus and institute in the UT system. With the group assembled, the co-chairs (one from IT, one from IR) made it a point to use a project management–based approach to formally develop the group as a team and to organize the group of 22 members into small working subcommittees. The results were success beyond initial expectations.
Charge
The popularity of mission and vision statements notwithstanding, organizations frequently fail to offer clear direction to teams or departments. There is great value in the organization saying clearly and succinctly: "We need this, and we're counting on you to deliver it." To that end, leadership drafted — and obtained the president's blessing on — a formal charge to the new BI Community of Practice. The charge was tangible evidence of executive sponsorship and support. At the opening of meetings in the early weeks and months of the community of practice, the co-chairs would often read the charge out loud — almost as an invocation. At other times co-chairs would refer to plans or decisions in the context of the charge. The charge was carefully cultivated to grow into a guidepost for the group.
The charge was not long, 125 words in total. And the essence of the charge was boiled down to one sentence, positioned as the first sentence in the charge: "The BI Community of Practice is charged with developing a successful BI strategy for the University of Tennessee and for the IT enterprise systems." The other 101 words merely provided clarity and scope.
People
With the charge written and delivered, the first activity the co-chairs of the BI Community of Practice undertook was a review of the individuals participating in previous business intelligence steering efforts. Representation of subunits was important, but in analyzing past failures, IR discovered that a major contributing factor to failure was the routine overturning at higher levels of decisions made by the steering groups. The groups had typically been composed of individuals who possessed neither the authority to speak on behalf of their subunits nor the trust of those who did have authority. This crippled the ability of the group to make decisions and take action on those decisions.
With this in mind, the co-chairs reconstituted the BI Community of Practice by paying special attention to identifying the decision makers at each subunit and learning who those people trusted. The co-chairs also considered what individuals would be most directly impacted by the community's decisions, as well as the individuals' ability to constructively contribute to group discussions. Perhaps unsurprisingly, the new BI Community of Practice membership was fairly different from that of past steering groups.
Project Management
With the right people on board and a clear direction, the next step toward success was developing a good plan. One of the co-chairs created and maintained a project schedule that showed major milestones, targeted dates for reaching them, broad tasks required to get there, and the dependencies among tasks. Of note is that the project management focused on development of a strategy, not on implementation of a technical tool. Past failed efforts at UT had focused project management efforts on the development or acquisition and implementation of BI software without considering an overall strategy.
At most community meetings a co-chair would review the plan to date, and importantly, incorporate feedback and criticism into a revision of the plan. The community of practice was never a slave to the plan; they revised it at will to adjust for what they had accomplished, what they had learned, what had changed in the environment, and where their goals might have shifted. The value of the plan was in the discussions about it; everyone knew where they were headed and what they believed we needed to do to get there. It also kept members individually accountable and the community corporately accountable for keeping promises and making progress.
Responsibility
The community of practice was a relatively large group at 22 members. Every member was necessary to the group's success, but 22 members is too large for most working situations. Diffusion of responsibility is a very real and very pernicious phenomenon; it is familiar to most through the colloquialism "When everyone is responsible, no one is responsible." As a direct action to avoid diffusion of responsibility, the co-chairs divided the community of practice into four subcommittees (Tools, Resources, Policies, and Training) of five to six people each, with the co-chairs serving ex officio on each. Each subcommittee received both a carefully selected chairperson and a specific charge. Tasks on the project plan were then assigned to the subcommittees.
These subcommittees were effective for two reasons. First, a team of five people is much easier to manage, logistically speaking. Finding times and places to meet is much easier with 5 than with 22. It is also harder for an individual to hide in a group of 5, although perhaps it is more generous to say that it is easier to facilitate participation of all members when the group size is smaller.
Second, the chairs of these subcommittees all immediately took a far greater interest in the business of the community of practice. Once their name was attached to a subcommittee and they were responsible for reporting progress to the larger committee, their participation levels notched up considerably. The subcommittee chairs became highly committed to success, doing what they could personally to acquire resources, to influence decision makers, and to contribute to planning. These actions were the manifestation of buy-in.
Lessons Learned
Ultimately the BI community of practice accomplished their charge: they developed a BI strategy document that laid out justifications, options, approaches, needs, a proposed platform, and a plan. That document was then formally approved by UT's Statewide IT Committee and served as the guiding document for all business intelligence development thereafter.
Beyond the successfully developed strategy documents and consequent technical implementations, our community building approach resulted in a couple of unexpected benefits. One was the establishment of an operating principle that although campuses would be allowed to utilize the UT system's BI platform in whole or part (both in terms of accessing their own data and in terms of using the software implemented), campuses would also be allowed to pursue different avenues for business intelligence that met specific local needs. This principle of availability without foreclosure greatly aided the acceptance and adoption of the strategy. There was never a plan to develop such a principle, but the project and group management techniques allowed it to emerge.
Another unique outcome was the request for proposals (RFP) for BI software that the community of practice developed. In the end, the community developed a clever approach to the RFP that recognized the best-of-breed vs. wholly integrated offerings without attempting to choose one approach. The purchasing rules were defined in such a way that the community of practice could make a best-of-breed vs. integrated decision in the presence of full information about all options, and then once that decision was made, select offerings among the proposals to fit that decision.
The availability without foreclosure principle and the clever RFP configuration were both examples of how unexpected positive outcomes can arise out of a partnership-based approach to organizational change. The intentional application of project and group management techniques helped ensure that the university obtained the maximum benefit from the diverse collection of partners it assembled for the purpose of developing a BI strategy. By obtaining those partners' commitment and being open to their contributions, the results were greater than anyone had hoped at the beginning of the process.
Today, a bit over two years into this process, UT has a budding business intelligence ecosystem. The university ended up relying heavily on the Microsoft software stack, implementing SQL Server 2016 and Power BI products to develop ETL, staging, semantic, and presentation layers. A functioning student data repository is already in production to complement data marts covering research, HR, and financial data. The BI team recently put alumni and advancement data in production, and everyone has been working hard to take advantage of the functionality of our new tools.
Where to Learn More
- A copy of the University of Tennessee's Business Intelligence strategy is available in the EDUCAUSE Library.
- Microsoft has published a case study on the University of Tennessee's use of Microsoft tools for its business intelligence platform.
- Most of the public-facing aspects of UT's business intelligence are presented through the President's Strategic Plan Dashboard. For example, see embedded Power BI reports in the Enhancing Educational Excellence section.
- More information is available on the UT System Administration – Information Technology Services – Business Intelligence team's website.
University of Montana
Matt Riley, Chief Information Officer
Institutional Profile
As a public, flagship university, the University of Montana serves a comprehensive research mission for approximately 12,000 students in Missoula, Montana. Montana is facing enrollment challenges and has embraced broad plans to attract more students, better retain existing students, and increase performance measures related to student success and complements.
Overview
IT efforts often drive a student success agenda, but how can IT effectively communicate the whole picture of progress?
In 2013–14, as the University of Montana began to recognize an urgent need to attract more students and also support existing students, IT at Montana was just coming out of infrastructure and operations improvements. IT was ready to and finally able to adjust its focus to align with institutional goals. A critical step toward achieving that alignment involved reintroduction of central IT personnel into functional areas such as admissions, financial aid, and the office of student success. This "people side" of the IT equation involved deployment of a different IT skillset, one focused on process facilitation within a project management framework. On the "tools side," between executive leadership and functional area leads, the institution knew where it wanted to go: degree audit for compliancy and rationalization of degree plans across all academic programs, a modern CRM for admissions, a web-based interactive catalog, intervention tools for advisors, customer service improvements across service areas, and better overall engagement with students around their academic career.
Although the solutions were somewhat understood by academic leaders, investments were limited, or not available at all due to a rapid shrinkage of resources related to the enrollment decline. Montana was struggling to simply pay faculty and keep the doors open, much less make the investments needed. Help was needed and IT stepped up to the challenge. In 2015, IT adjusted its goals from a previously needed focus on advancing infrastructure and service quality to a new focus on enrollment and student success. The change emboldened IT's decision making toward institutional goals/needs. Combined with the rapid adoption of virtual computing and cloud services and the retiring of stagnant technologies/services, IT found both the money for investments and the time needed to move forward with the tools and services the institution had previously identified. The partnerships with functional offices across these student service areas paid off, and IT's projects became collaborative projects with the existing teams in these offices.
By early 2016, there were a string of successes to report, and an "institutional engine" for rolling out institutional change in support of student success now existed at the University of Montana. However, it was difficult to communicate these successes to campus leaders and other groups interested in change and progress at the university. Information on individual projects, such as the successful rollout of the degree audit tool, was being shared, but the overall situations and impacts were not as clear. We needed a graphic representation of progress; it needed to come from IT, and it had to resonate with campus leadership. I spent some time with our communications director in IT and thought about successful communications we had seen on campus versus failed efforts. We decided to take a stab at building a one-page timeline inclusive of our student success projects across campus (see figure 1). The timeline shows the major milestones for individual projects, informs who is involved with the project, and predicts when the next milestones will hit.
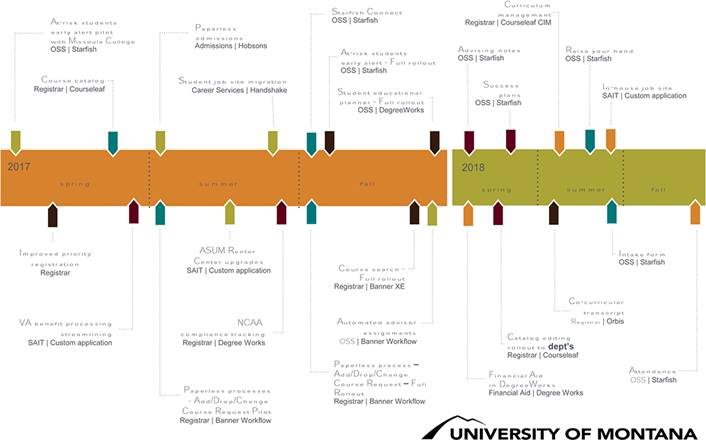
This simple effort has been a major asset for communicating IT's commitment to student success and engagement and to increasing enrollment and achieving better outcomes at the University of Montana. The fact that we also include projects led by others on campus, and always note the offices or service areas involved in every project, demonstrates the very real collaboration and coordination of effort that is occurring. The graphic is busy, it can be difficult to read in a presentation, but our president likes to include this slide and spend a minute talking about our technological efforts to improve student engagement and success anytime she can. I believe our president enjoys the visual impact of that busy graphic, demonstrating the complexity and challenge of change, and that it is still very easy to see the trail of successes and the path ahead for future improvements.
Lessons Learned
As Montana forges ahead with change, often led by IT, we are capitalizing on success in communicating progress. The one-page roadmap is joined by supporting web pages for major projects and by project templates that identify goals, stakeholders, process evaluation/reengineering steps, critical milestones, and communication needs. By collaborating across campus functional areas and including projects managed outside of IT, we have extended IT's project management approaches beyond our organizational boundaries and created a project culture on campus that is "bringing down the silos." We are coordinated, communication is both better and easier, and there is a spirit of accomplishment in support of our student success goals across the University of Montana campus. How to continue the momentum and spread success to other IT areas has become a hot topic in our IT Senate, and that success has been used in recent OneIT efforts to pull together IT across campus for efficiencies and effectiveness.
Ultimately, IT is hitting the mark for the University of Montana by focusing on institutional goals, finding the resources to hit those goals without further investment from starved central fund sources, and demonstrating progress. These actions remove much of the confusion that a president and cabinet might have regarding the complexities and interrelationships involved in making real change enabled by technology.
Where to Learn More
- University of Montana, IT Projects
- University of Montana, OneIT at UM report
As these case studies point out, effective data and analytics initiatives require alignment between IT and the overall institutional mission. The case studies describe a pattern of considerations that are important for the success of analytics and business intelligence work. Effective initiatives focus on teamwork to get stakeholders involved and to maintain engagement, demonstrate success through clear communication, and pay attention to culture change as an important aspect of this work. Finally, these IT leaders note that this is a continuing and ongoing effort that involves documentation of decisions and education about change management.
Jay Eckles is Director of Business Intelligence at the University of Tennessee.
Chris Gill is Chief Information Technology Officer at Drake University.
Matt Riley is Chief Information Officer at the University of Montana.
Kevin Saunders is Director of Institutional Research at Drake University.
© 2017 Jay Eckles, Chris Gill, Matt Riley, and Kevin Saunders.