
Key Takeaways
-
This four-part series on successfully establishing a business intelligence program at your higher education institution provides a how-to guide for strategic planning, building the organization, managing work, and marketing products.
-
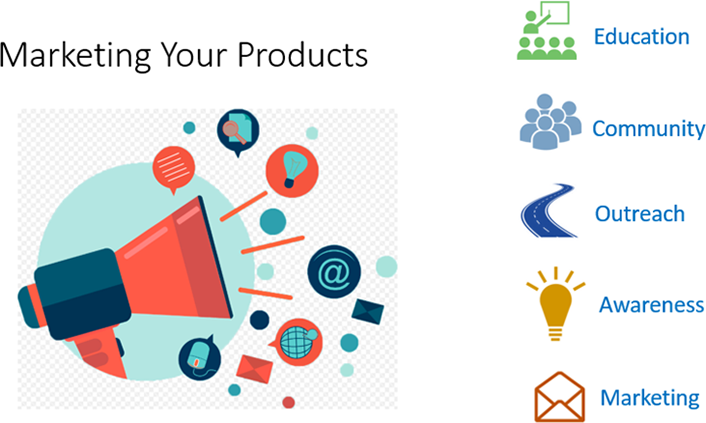
Marketing includes a diverse set of focused activities — including education and training, outreach, community building, and communications — while also creating the opportunity to drive adoption of your data and measure your impact.
-
Comparing the impact of marketing activities at the University of Washington and Purdue University revealed common goals: raise data maturity across the institution, increase demand for data, and better utilize data assets and investments.
Whether you are new to the field or a seasoned business intelligence (BI) professional, there are some basics (and not so basics) you need to run a successful analytics organization. In this four-part series, we cover key concepts to help you build, manage, and sustain your BI team. Taking the University of Washington and Purdue University as examples, we share practical tips for establishing your program, strategic planning, building the organization, managing the work, and marketing your products. We also reference industry best practices we have found helpful in building BI organizations at four institutions. We conclude our series here with a focus on marketing your BI program's products to your campus community.
Marketing Your Products
Even after making significant investments in analytics and data initiatives, many institutions still struggle to drive data usage across the campus. Clearly, "build it and they will come" does not work for IT, or for BI. Universities striving to become data-driven enterprises must develop new data skills and new competencies.
CIOs across higher education increasingly mandate BI training for their staff, largely because the BI team plays a key role in helping end users make the most of data — a benefit for the entire campus community. First, though, you have to get users interested in taking advantage of the BI products offered. A comprehensive marketing program can drive adoption of your BI program's data and analytics and thereby advance your institution's data maturity. Marketing is more than just "selling" BI, however. Here, through the experiences of two institutions, we specifically look at how education, training, and communication can facilitate BI acceptance and usage.
University of Washington
Most faculty and staff are not data professionals, and yet they are expected to rely on data to inform the decision-making and planning processes in their units. At the same time, the term "business" is often frowned on by the academic community. Together, these two factors suggest that data — let alone business intelligence tools — is not fully used as a strategic asset in a university or college setting.
Historically, the University of Washington's BI products consisted of parametrized reports and data cubes. These technical tools require technical expertise both to produce and to use. To access these tools, users had to go to several different locations and, depending on the type of BI they were working with, they had to go through several steps to run the tools. Clearly, the tools and the process required to access them did not make data exploration and analysis easy, accessible, or intuitive. For a diverse user base that ranged from business office staff and unit analysts to executive leadership, this constituted a high barrier to entry.
We needed a delivery platform that was easy to interact with, yet enterprise-grade. It needed to be web-based, accessible on mobile devices, and display large amounts of data in informative chunks. It also needed to promote data exploration, not get in the way of it. As a team, we needed to stop talking about tools and technology and start talking about business value. Most importantly, we needed to start promoting BI and talk about why it matters. To achieve this, we took a two-pronged approach, then measured our results.
The BI Portal
First, we built the UW Business Intelligence Portal (BI Portal). Built on mvc.net technology, JavaScript, and HTML5 and hosted in Azure cloud, our easy-to-use tile interface presents a searchable catalog of available data warehouse reports, cubes, analytics, and visualizations (see figure 1). It also shows which data products are trending, provides recommendations, and allows users to submit feedback or vote on other people's recommendations.
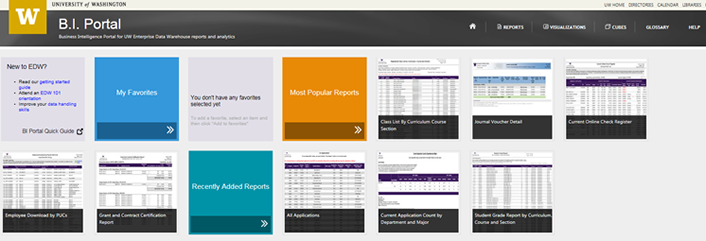
Figure 1. The University of Washington's BI Portal
The portal display customizes based on individual user behavior and includes a Help pane with access to training and documentation. For tech-savvy users, the portal also includes the underlying SQL code for all data products. The portal's impact surprised us: providing a single, intuitive point of entry — without changing any of the data products themselves — led to data becoming used more broadly across campus.
How was this possible? When looking at the culture of UW's BI community, what stands out is that users value personal — and personalized — interaction. For example, we knew from product support logs and surveys that one-on-one phone consultations led to faster ticket resolution and higher user satisfaction than generic guidance provided by other means, such as e-mail. The BI Portal includes several features that provide the extensive personalization the users value in a way that is cost-effective and repeatable.
For example, a recommendation engine directs users to useful reports based on the user's own actions. To achieve this, an algorithm compares the report the user is currently viewing to reports viewed by campus users in similar roles and generates additional report recommendations accordingly. So, a budget coordinator in the College of Arts and Sciences, for instance, will receive suggestions based on the reports that other budget coordinators on campus viewed.
Another way BI Portal guides users to relevant reports is to provide recommendations within individual reports. The algorithm for this function identifies the reports most commonly viewed by users who have also viewed the present report and displays them in an information pane (see figure 2). Thus, by using BI to manage BI, we increased the visibility of various data products across campus. As users became more familiar with what was available, adoption increased.
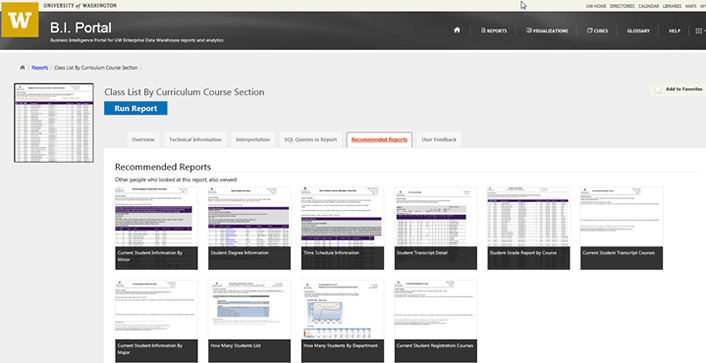
Figure 2. The BI Portal's Recommended Reports tab
Communication and Outreach
Our second prong was a focus on communication and outreach. Aside from a platform that was easy to use and personalized, we needed to spread the word to help faculty and staff become more fluent with data. We leveraged existing communication channels where possible; for example, we published campus-wide announcements through the university's marketing group, on business partner websites, as part of executive briefings from the IT department, on the IT blog [https://itconnect.uw.edu/connect/web-publishing/uw-blogs-network/], on the IT Twitter handle, and even on the UW YouTube channel. We also created a tutorial video for the portal.
As elsewhere, brand matters in BI. Using established communication channels and familiar branding created trust in the product. It also opened doors, such as when the Board of Deans and Chancellors invited the BI department to demo BI products in person.
We emphasized bottom-up communication as well. What started as a quarterly review of work within the team — a common practice in industry — turned into annual presentations to senior leadership. These report-outs from the BI team provided high-level information on what the team had accomplished. But, rather than cover all our work in a status-update format, the meetings centered on a particular theme and focused on value and impact. What made this even more unique is that the full team was present and delivered the content. This gave team members the opportunity to represent their work and hear directly from executives. It also helped them better understand how their work supported strategic priorities. Finally, it gave executives a chance to get to know the staff, to get to know BI, and to represent the value of BI to their peers.
These reviews made complex content easily accessible by relying on pictures and analogies, and included end users representing their own experiences. At times, the reviews also included animations or hands-on demos of new products relevant to our leaders, such as interactive dashboards. Business leaders began attending in addition to IT leaders. Aside from building trust and transparency, this model ultimately played a role in raising the data maturity at the institution.
Training
Since these early communication efforts, the BI products at UW have grown beyond operational reports and data cubes to data visualizations, advanced analytics, and predictive models. While these tools do make data overall easier to produce, understand, and use, they also require training for new users. Relying on adult learning and instructional design methodologies from organizations such as the Association for Talent Development (ATD), we implemented a training curriculum that covered the breadth of our BI offerings and targeted a range of user types (personas). Training was delivered in various formats, such as classroom-style and on-demand through online videos and webinars. To make training broadly accessible, we relied on products with a look and feel that UW staff were familiar with, including using the existing Trumba Calendar system for class registrations and the UW Data & Analytics website for publishing the course catalogs and advertising the courses.
Measuring Success
Finally, this wouldn't be the BI team if we didn't measure something. Measuring — and communicating — the impact of your marketing will help you evolve your program. For example, noticing an uptick in BI training registrations after specific marketing releases can help you determine when to increase, decrease, or change your communications or your timing, or make other adjustments such as adding more class sections. As figure 3 shows, registrations for data training classes spiked after communications releases.
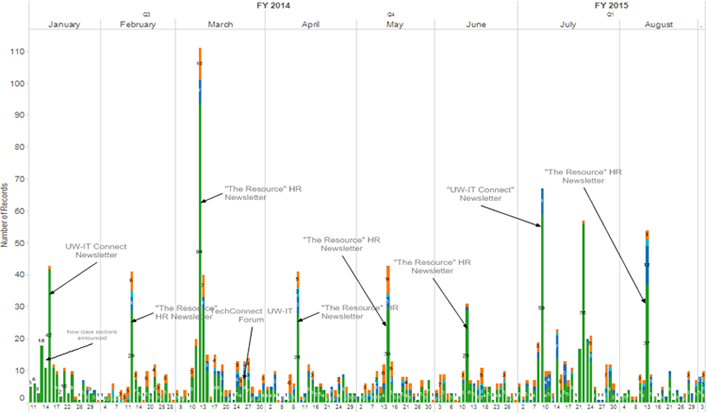
Figure 3. Measuring success of marketing efforts
Lessons Learned
So, what stood out in our marketing journey? No matter how we delivered the content, we relied heavily on pictures to emphasize the message. The goal was to provide instruction and support for using data and tools by whetting people's appetite for them and getting users excited about them. This was better accomplished with intuitive, interactive, and simple images than with a lengthy how-to manual. As with data, we found that a good visualization can give learners an intuitive grasp of complex issues and relationships.
Although our discipline just might continue to be called business intelligence, we did find that language really matters. For example, we noticed that faculty members were less likely to attend a "class" than they were to come to a "workshop." Academic deans were more likely to value small, targeted, face-to-face "working meetings" with their leadership teams than they were to watch a video delivering the same content. In contrast, administrative analysts favored the video over the in-person meeting. Understanding different user personas is key to delivering your message effectively.
Finally, we learned that being part of a university provides many advantages in marketing. For example, a capstone project with graduate students can be a useful way to augment staff or get new ideas, while also giving students work experience (in fact, graduate students built our UW Data and Analytics website). Faculty have participated in our Tableau Advanced class to augment their own coursework with students, and partnering with a department can bring you the opportunity to train your trainers by having them co-teach with university faculty.
Purdue University
As with many higher education institutions, Purdue's BI environment is highly distributed, with report developers and analysts operating in many different central offices and other units. Our central Business Intelligence Competency Center (BICC) plays a key role in supporting these distributed information producers and helping them work together as a community.
The BICC team is responsible for getting data into the environment and making it available. The BI Community consists of the subject matter experts, trainers, and analysts working across many different units and is responsible for creating reports and dashboards, as well as data and business process expertise.
Figure 4 illustrates the roles of the BICC and the BI community and how they interrelate.
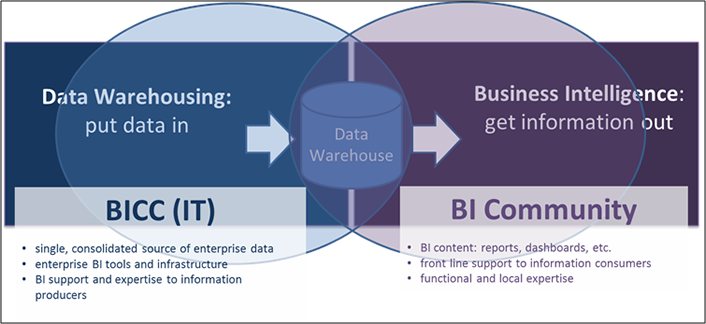
Figure 4. Business Intelligence Competency Center and BI community responsibilities
Purdue's community-based approach lets us provide central support and standards while capitalizing on local knowledge and expertise. However, it also requires deliberate focus to ensure that people both know the types of products and services available centrally from the BICC and are aware of opportunities to share information and collaborate.
BICC offers four central services:
- Data. The BICC builds and maintains Purdue's enterprise data warehouse environments, which include data from our enterprise systems. We continue to add new sources of data as well, working toward establishing a single, integrated source of enterprise data.
- Tools. Purdue's information producers use a variety of tools. At the enterprise level, the BICC supports tools for reporting and data visualization.
- Services. The BICC provides help desk support and training to help answer questions and address issues.
- Expertise. The BICC partners with the BI community to advance BI at Purdue. We help define and implement strategy though our various governance groups, and spearhead strategic initiatives such as the management dashboards.
Purdue's BICC uses several different kinds of outreach efforts to connect with customers and stakeholders and make them aware of our services, as well as to gather input and feedback. Our approach focuses on connecting with customers and stakeholders through many different user groups and committees on campus.
Outreach Activities
Both of Purdue's major enterprise BI tools have active user groups led by members of the BI community, with central support provided by the BICC. They are also scheduled to meet back-to-back, for the convenience of people interested in both tools. In these meetings, the BICC provides updates and announcements, while community members share tips and tricks and showcase projects they're working on. We're also involved in reporting showcases and other meetings, such as when staff from the business offices comes together. Groups of analysts meet regularly to talk about data topics, and we're engaged with them as well.
Meetings with user groups and committees provide a great opportunity to share information and bring people together. Because it's also essential to get formal input into strategy and priorities, we have several advisory and governance groups that we meet with regularly as well. One of our groups handles standard reports and data issues for HR and finance, while another group handles the same for students. In both cases, attending these group meetings gives us an opportunity to hear about issues and pain points and look for opportunities to collaborate. We also work with the groups to establish priorities for maintenance work and minor projects.
Purdue's cross-functional BI Advisory Committee brings people from various groups together in one place, and we use those meetings to spur discussion and solicit input. For overall BI strategy and priorities for larger projects and initiatives, we have a BI Strategic Priorities Committee that meets twice per quarter. (See the first article in our series, "Running a BI Shop: Part One, Strategic Planning.")
We conduct additional outreach activities to raise awareness and gather input on specific initiatives. One major cross-functional BI initiative focused on creating management dashboards: a single source of authoritative, trusted information for data-driven decision-making for unit leaders. This project is a collaborative effort between offices that produce official reports, so we are working closely with them to define the roadmap. We have given presentations about the initiative at several other meetings to raise awareness and gather input, especially from the Provost's Office and academic deans and department heads.
Collectively, Purdue's outreach activities in the BI space represent significant time and effort investments from both the central BICC and many others across the institution. We believe that an active and engaged data community is essential to our ultimate success, and that this investment is well worth it. As noted earlier, we found both focused subject-area discussions and broader cross-functional discussions useful. Our two-pronged approach involves going to existing customer and stakeholder meetings and creating opportunities for people to come together across functional lines. In all cases, we focus on two-way communication: we talk about news, services, and initiatives; listen for pain points; and gather feedback and input.
Training
Training is another key component of Purdue's community support and marketing efforts. As we continue to broaden data access, information producers and consumers have an increasing need to understand the many nuances of the data, as well as how to effectively use enterprise BI tools.
As with other areas, we take a collaborative approach to training. BICC provides the tool training, while the functional offices provide data and report training. All training classes are coordinated centrally, using a common calendar tool and point of access. Figure 5 shows suggested training paths based on subject areas, including both tool and data training.
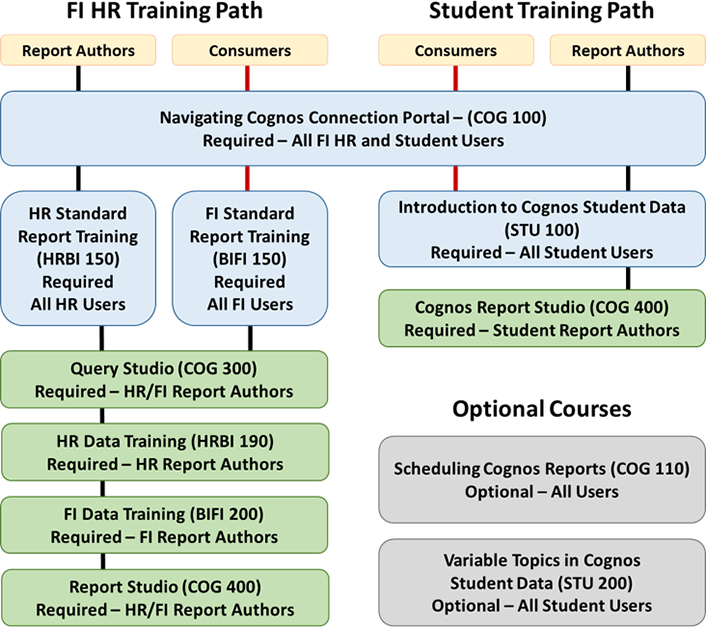
Figure 5. Training paths for stakeholders finance and human resources (FI HR) and students
Measuring Success
The usage of Purdue's BI environment offers one way to measure the impact of these engagement efforts. As noted in part 3 of this series, "Managing the Work," this measure also gives us the opportunity to use our own BI tools to manage our work. To supplement the usage data available from our enterprise BI tools, we combine it with HR data from our data warehouse. This gives us insights into which departments and areas actively use particular reports, as well as the types of roles people play.
We leverage this usage data in various ways. For example, figure 6 shows the growth in use of finance and HR reports since the deployment of new "data marts" in our data warehouse. We use this data in briefings with key stakeholders and sponsors to show our progress, as well as to identify which areas are already ramped up and which might need additional support.
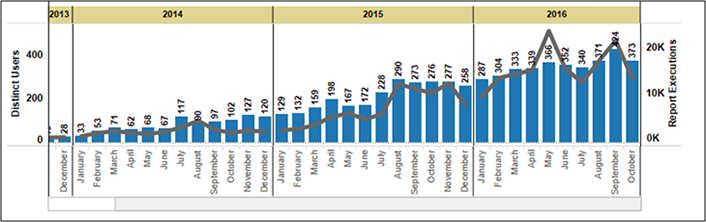
Figure 6. Growth in finance and HR report usage since the 2014 launch of data marts
We relied on usage data to assess and clean up our standard reports for student data by determining which standard reports were run most frequently and which were not being used. We also identified the top report users so that we could target them in our feedback sessions. Finally, we leveraged usage data to inform our plans for a major systems transformation project. This data let us review the usage of standard reports compared to custom or departmental reports to assess the project's impact on existing resources and plan the work according to need.
Final Thoughts
At Purdue, we engage in a broad set of engagement activities to promote and support our BI products and services. Although this requires a significant investment of time and effort, it also helps us ensure that the BI community is aware of and using available resources — and it is vital to gathering the feedback and input we need to guide future plans. Analyzing usage data lets us both measure the impact of these efforts and further tune them to the areas most in need.
Marketing Your Products Summed Up
In taking stock of our experiences at the UW and Purdue, a few things stood out to us.
- Marketing requires significant bandwidth. Whether the BI team plays a central role in marketing or owns it entirely, communication, training, and education require focused coordination and that those engaged in these marketing activities understand and navigate the BI community's culture.
- Marketing requires the team to be active in many different areas. Although training provides instruction and builds the technical know-how that data professionals need, user groups and special interest groups let us foster connections and build a strong data community. This is particularly important in highly decentralized institutions such as UW and Purdue.
- Marketing definitely gives visibility to data and data products. Marketing raises the data maturity at all institutional levels and increases analytics use across campus. It can produce champions both within and outside of the central BI team, as well as across the BI community. As a result, however, it can increase demand beyond what BI teams can handle. Try to plan accordingly.
- Marketing provides an excellent opportunity for BI teams to leverage their own BI tools to manage, target, and enhance end-user education. This can help you hone your marketing campaigns, such as by using report usage data to personalize the information you provide end users. It can also facilitate BI operation management by articulating the return on your institution's marketing investment.
Final Thoughts
We encourage everyone interested in developing, maintaining, or growing their on-campus BI initiatives to read the four articles in this series as needed to understand how such an effort looks on the UW and Purdue campuses. While we certainly don't claim to have all the answers, the examples provided can serve as a useful starting or comparison point for your own efforts. Given the value of such programs to higher education institutions in decision making and strategic planning, we look forward to growing data maturity across the community.
Anja Canfield-Budde is the interim associate vice president for Information Management at the University of Washington.
Aaron Walz is the founding director of Purdue University's Business Intelligence Competency Center.
© 2016 Anja Canfield-Budde and Aaron Walz. The text of this article is licensed under Creative Commons BY-NC-SA 4.0.