
Key Takeaways
-
The breadth and detail of educational data — particularly from MOOCs — poses challenges and opportunities for higher education institutions.
-
Chief among these challenges is finding ways to separate the sea of data into meaningful categories and present them in usable forms.
-
The Harvard/MIT edX Data Pipeline is an open-source effort to manage MOOC data among higher education institutions.
-
Using the project's tools, institutions can make online course data usable by stakeholders from institutional and course administrators to students and researchers and thereby improve the educational experience and outcomes.
When tasked with parsing the many bytes of data in higher education, we often begin to see them as an enormous sea — a unified, undifferentiated mass that extends beyond the horizon. We admire its potential value even as we fail to realize it. This analogy is particularly apt in relation to data generated from MOOCs, which operate around the clock, gathering information on the page views, clicks, comments, and engagement of the tens to hundreds of thousands of students around the world taking courses at any given time. Institutions are striving to realize that information's potential to improve course content, student experiences, and academic outreach to traditional and underserved communities. But first, they must separate the sea of data into meaningful categories presented in a usable form. Teams at Harvard and MIT aim to make this task easier by sharing tools, knowledge, and experiences with other institutions.
In late July 2016 we held our first workshop. Participants included institutional analysts from Arizona State University, Boston University, edX, Hamilton College, Harvard University, Microsoft, MIT, Rice University, and Wellesley College. The workshop aimed to introduce participants to methods developed by the Harvard and MIT teams to manage our massive influx of edX data. We discussed specific tools as well as the future of educational data and cross-institutional research.
MOOC Data: Possibilities and Challenges
Institutions have gathered data to improve both their own performance and that of their students since formal education began. Traditionally, the bulk of this data came from attendance records, course grades, and admissions records. The difference today is in the breadth and detail of educational data, particularly within digital learning environments. Learning management systems (like edX, Canvas, Moodle, etc.) record individual mouse clicks, submissions to problems, written communication in forums, and the amount of time spend reading texts, watching videos, and engaging with fellow students. When combined, the amount of data with the scale at which it's generated and the effort required to make that data usable expands, as do the possibilities of the insights and improvements the data can bring.
Big Potential
Today, institutional analysts use MOOC data to assess course and learner performance, while course designers focus on troubleshooting both general teaching approaches and the courses at hand and making adjustments accordingly. For example, an MIT instructor wrote a physics question using baseball, which we'd think nothing of in a typical course on the MIT campus. In this case, however, the course was a global MOOC, and forum posts proliferated from confused learners from around the world who either did not understand the rules of baseball or had never heard of it. Such experiences are eye-opening; immediately notified of the problem, we included links to Wikipedia's baseball page in the course. We also used the forum to explain the terms in the question more clearly to help those students in the midst of the assignment; once the course was finished, the professor found a new, more globally understood analogy.
As another example, an MIT intermediate-level undergraduate quantum physics course was able to use data from a MOOC to improve residential instruction. The professor of this course ran an edX version with roughly 2,000 users doing some portion of the assessments. The same assessments were given to 18 on-campus students at MIT. While both audiences found the course challenging, the professor discovered that in some cases the challenge arose from problems being much harder than expected (e.g. with inadvertently unclear language) or too easy to be effective in teaching (e.g. with answers too easily guessed). These insights came because the 100× larger number of MOOC learners than MIT students provided sufficient statistical power to resolve item difficulties with confidence.
As these examples show, insights from course data can let course teams quickly change or flag questions that cause students undue struggle. They can also help instructors reflect on their assumptions and better target their course materials to the vast — and vastly diverse — global audience.
Further, big data can help us better understand and bridge inequality gaps in education. For example, we can track how many women are taking computer science courses at different institutions and levels — in high schools, at Harvard and MIT, internationally, and so on. We can then look at the data set and compare and contrast what we find with various norms, including those of other online or campus-based courses.
To get to the point where we can turn bytes into usable data such as this involves addressing data scale and diversity issues.
Big Challenges
The amount of data arriving from edX, already on the order of terabytes, increases every day. Add to that the need for backup, and the amount of data quickly doubles.
Further, students generate not just large data, but a wide variety of data types. MOOC student interactions include activities such as answering assessment questions, watching videos, reading text assignments, and participating in discussion forums. Each of these activities can be measured, and they're all data intensive. The breadth of different data types requires that we carefully consider how to holistically capture the experience of learners.
Consumers of MOOC data fall into various groups — from leadership to researchers to students — each of which has particular needs and goals in relation to edX data. The data therefore has to be transformed into formats that serve the needs of these diverse groups.
Furthermore, institutions can share these transformations in order to appropriately compare MOOC metrics across institutions. The idea behind the Harvard and MIT data pipeline is to bring institutions together to tackle problems and share knowledge and experiences.
The Harvard/MIT edX Data Pipeline
The Harvard/MIT partnership began as an initial collaboration aimed at studying the vast amounts of data being collected in the early days of edX. The two institutions bring various talents to the table: MIT is generally very good at analyzing huge amounts of data, while Harvard — particularly the Graduate School of Education — brings knowledge of which questions are most important to address. Teams from both institutions have been vital in illuminating backgrounds and behavior of MOOC learners.1
Birth of a Workflow
The edX organization created and continues to develop the platform for delivering HarvardX and MITx MOOCs. The edX platform records a variety of user interactions that are made available to institutions. On a nightly and weekly basis, edX exports course data to institutions that then make use of that data for research and analytics. So, unlike, say, a Silicon Valley startup, where you're implementing the platform and adjusting code and information logs in real time, we focus on managing these large, stable data exports and making them usable for customers of our institutions.
Indeed, one of the questions we started with when developing our workflow was a simple one: Where does the flow end? It's really useful and helpful to think about the customers first. These customers include the researchers, who want to glean insights from vast data stores; course administrators, who use data to refine and sometimes change more radically the material they teach and how they teach it to best address student needs and student success in learning; and institutional administrators, who are interested in cross-course information, such as overall health of a program and general patterns in student behaviors.
edX Data Pipline Open Source Tools
First we structure the edX information into particular data set types and thereby render it more usable to our various customers. Team members at both Harvard and MIT got involved in this effort early on and created what we call canonical data sets — that is, data sets meant to fulfill a myriad of requests while maintaining rigorous definitions on how the data are aggregated. One example here is the person course data set, which summarizes the activity of a user in a course. Each row is a single student and columns represent behavior (number of clicks), backgrounds (gender, geolocation), and performance (grade, certification). When considering data and research requests, we find that this data set generally handles the majority of questions our customers are interested in addressing. The current form of the person-course data set has approximately 60 unique columns (behavior, backgrounds, performance) for over 9 million course enrollments. In addition, they are updated in conjunction with the regular data exports from edX, meaning they can be used to provide a regularly updated set of visualizations and reports for our customers.
The Harvard/MIT edX Data Pipeline relies on two open-source repositories:
- edx2bigquery, which handles the regular data exports from edX and generates the canonical data sets using Google’s BigQuery infrastructure
- XAnalytics, which provides a dashboard that connects to the edx2bigquery pipeline, allowing various institutional representatives/roles to interact with edX data
The Harvard/MIT edX Data Pipeline leads to numerous canonical data sets that can be used for analytic and visualization purposes. Figure 1 shows a sample of visualizations: demographic and backgrounds summary stats (top row), time-stamped activity (middle row), and course structure visualizations (bottom row).
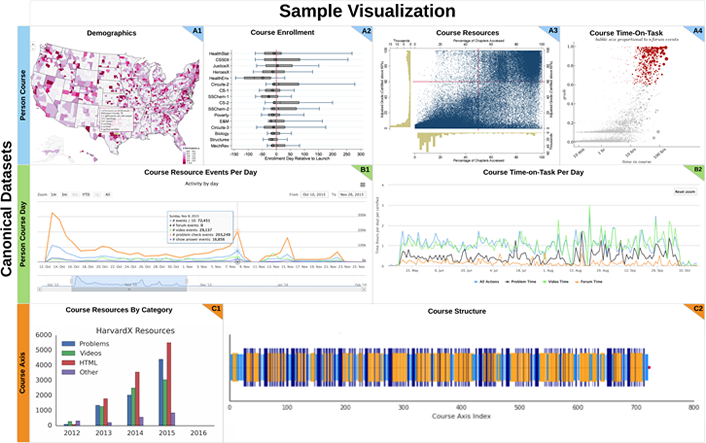
Figure 1. Sample visualizations from Harvard/MIT edX Data Pipeline data sets
Finally, in terms of implementing the Harvard/MIT Data Pipeline, we're actively looking for ways to expand this effort and collaborate with others in the future. This was a driving goal of our July workshop.
Collaboration: Tutorials and Next Steps
From the onset, we saw this work not just as an investment that we were making for our own institutions but also for the larger community. Our overarching goal was to develop a platform from which a broad variety of organizations running edX courses could benefit. This led to very specific considerations in the design of the Harvard/MIT edX Data Pipeline.
One of those considerations was to have an open-source code base that other institutions could use. We view our workshop participants and other institutions as collaborators in our project, the same as our stakeholders at MIT and Harvard. To make our workflow easily and quickly usable by other institutions, we are currently formalizing documentation to support adoption.
In the future, we plan to hold a regular meeting to discuss edX data, our workflows, and the workflows of other institutions. We hope to grow a community around which institutions can begin sharing tools and insights into the data stemming from their MOOC offerings.
Note
- Andrew Dean Ho et al. "HarvardX and MITx: The first year of open online courses, fall 2012–summer 2013"; and A. D. Ho, J. Reich, S. Nesterko, D. T. Seaton, T. Mullaney, J. Waldo, and I. Chuang, "HarvardX and MITx: The first year of open online courses," HarvardX and MITx Working Paper No. 1 (2014).
Daniel Seaton is a research scientist in the office of the Vice-Provost for Advances in Learning (VPAL) at Harvard University.
Glenn Lopez is a data scientist in the office of the Vice-Provost for Advances in Learning (VPAL) at Harvard University.
Dustin Tingley is faculty director of VPAL Research at Harvard University.
Isaac Chuang is a professor of Electrical Engineering and Computer Science, professor of physics, and senior associate dean of Digital Learning at MIT.
© 2016 Daniel Seaton, Glenn Lopez, Dustin Tingley, and Isaac Chuang. The text of this article is licensed under Creative Commons BY-NC-SA 4.0.