Key Takeaways
-
This article shares the five-year experience with business intelligence and analytics at Lehman College of the City University in New York.
-
Next up is Lehman 360, with the concept of providing the right data, at the right time, to those who need it to take action.
-
As the volume of data grows, higher education will need increased capabilities to integrate and analyze data in ways that will serve as differentiators.
The EDUCAUSE Top 10 IT Issues list is insightful, even prescient, as a means to describe the key technology challenges faced by colleges and universities. In the most recent (2016) Top 10 list,1 business intelligence (BI) and analytics combined were described as a differentiator, critical to ensure the relevance of "institutional priorities and decision making and … easily accessed and used by administrators, faculty, and students."
The annual Top 10 list is important and useful — but not easy to tackle. It may take years for BI and analytics initiatives to mature and become part of the fabric of an institution. This article shares the five-year experience with BI and analytics at Lehman College of the City University of New York (CUNY). Because the landscape is changing rapidly, I will also attempt to forecast how BI and analytics might evolve going forward.
Lehman College Context
The City University of New York (CUNY) is the largest urban public higher education system in the United States. Lehman became an independent senior college within CUNY in 1968 and now offers more than 90 undergraduate and graduate programs to more than 12,800 students.
Like most institutions of public higher education, Lehman is facing the challenges of reduced government funding, greater competition for students, and the need to enhance retention and graduation rates. In 2011 Lehman became the first college within CUNY to pilot BI. Lehman's former president and the university CIO saw the value of piloting BI and understood that big data, BI, and analytics were poised to play a significant role in supporting student success.
The BI Journey
The need for a BI capability at Lehman arose from the need for a more contemporary approach to providing the college with descriptive data for day-to-day decision making. Lehman's journey has benefited from learning how other colleges and universities demonstrate leadership in BI and analytics. In addition, EDUCAUSE has facilitated information-sharing through articles and presentations from the many colleges and universities that have forged the BI path.
Initial Goals
The Lehman College dashboard was designed to provide online access to college data in a user-friendly format. With a small team and limited budget, our initial BI goals were to:
- Empower users: A key goal was to reduce the need for academic and administrative departments to "stand in line" for critical reports. Users were frustrated by wait times and generally felt that their reporting needs were not met in a timely fashion. The BI dashboard became a resource on the college intranet for chairs, deans, and administrators to have day-to-day information available in near real time.
- Facilitate reporting: The college needed a better reporting capability as part of the university-wide implementation of a new enterprise resource planning (ERP) application. Lehman was in the second wave of CUNY colleges to migrate to the ERP's new student information system (SIS), and the dashboard enabled the college to access more comprehensive information and, as a result, be more nimble during the transition.
- Support student success: The college sought new ways to respond to questions from senior leaders and departments relating to student success initiatives. Most questions focused on factors that contributed to retention and graduation rates among full-time, first-time freshmen as well as transfer students. To better answer these questions, the college selected a stand-alone predictive analytics modeling solution. This enabled improved pattern recognition and enhanced our ability to identify actionable information.
We were flying blind before BI. The data that we can now extract and act upon has made a huge difference for our program.
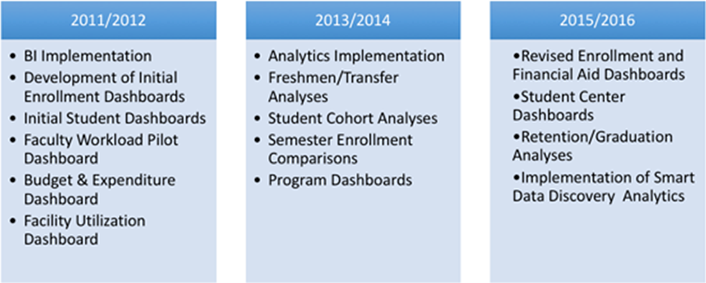
Figure 1 shows the overall timeline for Lehman's development of the BI/analytics dashboard.

Figure 1. Lehman College dashboard development timeline
Five main areas of learning were identified as key factors during Lehman's implementation of BI and analytics: institutional culture, partnership and collaboration, pilots, metrics, and selection of resources.
Institutional Culture
BI and analytics suites should not be regarded simply as "tools." Their implementation and ultimately their acceptance depends on the institution's level of confidence in the data and the readiness to integrate BI and analytics into decision-making practices. In 2011, many Lehman offices maintained their own data locally on spreadsheets and legacy Access databases. These were the trusted information sources and, as such, data governance was limited.
Workshops served as the main vehicle to demonstrate the value and ease-of-use of the new BI platform. It took time for faculty and staff to gain confidence in the new online system. Especially critical was the adjustment from legacy static reporting to a dashboard with dynamic data that was updated daily due to shifts in enrollment. As a result, the dashboard started an internal dialogue around issues of readiness. For those new to the BI and analytics journey, the development of a prelaunch readiness checklist can be useful. Factors might include:
- In what ways does the institution use data to support decision-making processes?
- Where is data currently stored, and how is it aggregated and shared?
- Is data trusted across various offices and departments?
- What type of information governance is in place, and what institutional elements facilitate or resist the use of data in decision making?
- Where does BI/analytics appear on the strategic roadmap?
Partnership and Collaboration
To succeed, Information Technology (IT) must become a trusted partner that enables departments to meet their information needs. At Lehman, the IT division serves as a technical BI resource, along with Institutional Research, to support subject matter experts across campus departments. Early adopters worked in conference room sessions to sketch out dashboards using iterative development methods. These sessions not only helped the programs gain an understanding of the value of BI, they provided IT with greater insight into departmental needs. Small wins were celebrated together, and key programs became champions of the BI dashboard. These collaborations became the basis for a variety of joint BI-related presentations relating to best practices and innovations at meetings and conferences within and outside of CUNY.
A data dictionary, developed by a cross-campus team, reinforced the need for data stewardship and helped clarify and standardize the enrollment terms used by departments. This common understanding is now consistently reflected across institutional data, daily enrollment snapshots, and related reports.
We now have the enrollment data we need to make more informed decisions. We know where we stand on a daily basis, have the tools to collaborate with college departments and programs to improve enrollment services, and our communication to students is now much more targeted.
Pilots
Small pilots and quick wins were critical to Lehman's successful BI and analytics launch. Early adopters helped promote the use of dashboards by describing how the data informed decision making. A key achievement took place during the first weeks of registration, when deans and department chairs used the dashboard to optimize class sections based on changes in enrollments. When enrollments appeared to decline, a team conducted a six-week review using BI and other data to address the issues associated with lower than expected enrollments. BI was later used to support a reverse transfer pilot program across the Bronx CUNY colleges, enabling participating community colleges to review data on their students who transferred to Lehman. Based on courses completed at Lehman after transfer, students may be eligible to receive an associate degree from the community college where they started. The BI dashboard supported the pilot and received the 2015 CUNY Tech Award for Best IT Collaboration. The pilot program has since been expanded system-wide.2
Metrics
Measures of success with BI and analytics are both quantitative and anecdotal. Monitoring use, numbers of log-ins, and growth of reports across departments reveals that BI has become a differentiator at Lehman. Dashboards not only enhance decision support for a variety of college offices; they support an institutional focus and serve as a basis to provide students with personalized information. Lehman's pilot has informed other CUNY colleges and the CUNY system in their implementation of BI and analytics.
Selection of Resources
Over the past few years, new, lightweight BI and analytics options have emerged. These resources not only reduce technical complexity and cost barriers, they enable faster time-to-implementation for those institutions new to BI and analytics. Given the accelerated growth in technology, colleges and universities need to make careful decisions regarding investments in the BI and analytics space. For example, Lehman has invested in a new category of advanced analytics known as "smart data discovery." This emerging class of capabilities automates data analysis through machine learning and regression algorithms — many provide auto-generated visualizations and interpret relationships in natural language.
Next Steps: Lehman 360 Student Platform
Colleges and universities face a similar challenge — they lag behind consumer technologies in terms of the digital experiences available to students. However, students arrive on our campuses with high expectations for consumer-friendly, mobile, and frustration-free experiences, whether in registering for courses, understanding graduation requirements, or addressing myriad other processes. IT departments must deliver greater value by enabling new capabilities to differentiate our institutions in this more consumer-focused model.
The bottlenecks that sometimes frustrate students can take a variety of forms and often serve as a problem-solving opportunity. A recent initiative focusing on the student experience led a Lehman team to combine existing systems and eliminate the need for students, faculty, and staff to stand in line each semester to validate identification cards. In another case, a team is leveraging Lehman's business process automation platform to enhance the student experience by piloting an online "declaration of major" form. With built-in logic, approval workflows, and metrics, students will no longer need to go from office to office to obtain the necessary permissions to indicate their interest in a particular academic plan.
Even as BI, analytics, and process improvement initiatives proceed, a new requirement is emerging: to extend the capabilities of BI and analytics beyond an administrative role to serve as the core of a student-centered interconnected and integrated platform.3 Lehman's experience suggests the need for a single portal with relevant and actionable information for faculty, advisors, and students.
Lehman President José Luis Cruz believes that actionable data is key to harnessing the transformational power of a campus community; for data to be actionable, we must make it come alive as pervasive, relevant, contextualized, timely, and understandable to each and every member of the campus community. From the technology perspective, we call this model Lehman 360. It will launch as a pilot within the year under the guidance of the college's Advising Work Group and with the concept of providing the right data, at the right time, to those who need it to take action. The Advising Work Group is a cross-campus collaboration led by Lehman's vice presidents of Student Affairs and Enrollment Management with a focus on the role of advisement as critical to student retention and persistence.
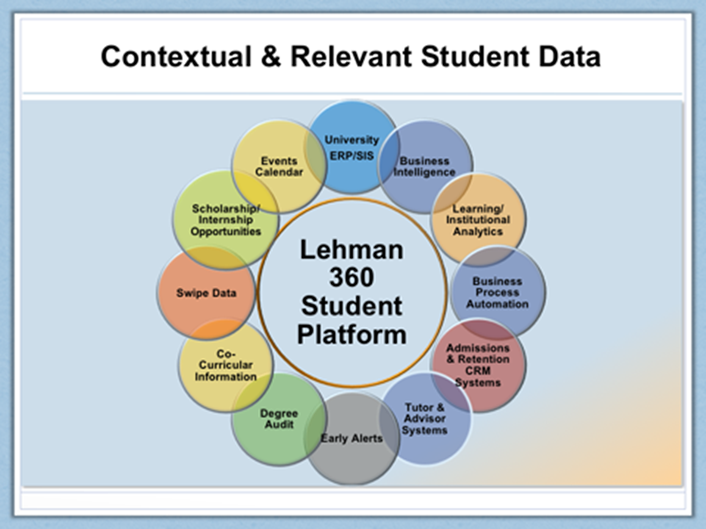
Along with related process automation efforts, Lehman 360 will support improved advising, retention, and degree completion by leveraging robust web capabilities, BI, and analytics. The platform is intended to streamline and unify student data from across multiple and sometimes disconnected academic and administrative systems (see figure 2). When tied to the milestones of the student journey and made actionable, an integrated approach can contribute to student success, positively impacting enrollment, retention, and graduation goals.

Figure 2. Lehman 360 aims to unify data across multiple systems
Lehman 360 will place the student at the heart of the digital ecosystem and allow students, faculty, and advisors, based on their role, to access a more complete view of student data. Students will receive personalized, just-in-time text message alerts and nudges about relevant events as they progress in their academic journey. They will also receive texts celebrating their achievements of key milestones. The alerts will direct students to a portal for detailed information about academic or financial issues as well as relevant events, activities, and reminders concerning requirements. The following examples illustrate how Lehman 360 is being conceptualized:
- Students will be able to toggle data that meets their needs regarding their program, academic status, grades, course requirements, experiential learning, co-curricular activities, etc. They will also receive personalized event and activity reminders tailored to their club activities and their majors.
- Students will receive notifications from their instructors about lecture and video posts, assignment deadlines, and course requirements.
- A Computer Science major will receive alerts about the Computer Club, Hackathon events, career workshops, and internships.
- The platform will generate a notification to students who meet certain criteria. For example, rising seniors with a GPA of 3.0 or above can receive alerts that they qualify for a particular scholarship in their major.
- If a student's attendance has declined or if the student has received a "C" in a gateway course in their major, an alert will be sent to schedule an appointment with an advisor. Faculty and advisors will also be alerted and have access to similar, relevant academic and co-curricular data to assist them when they meet with students.
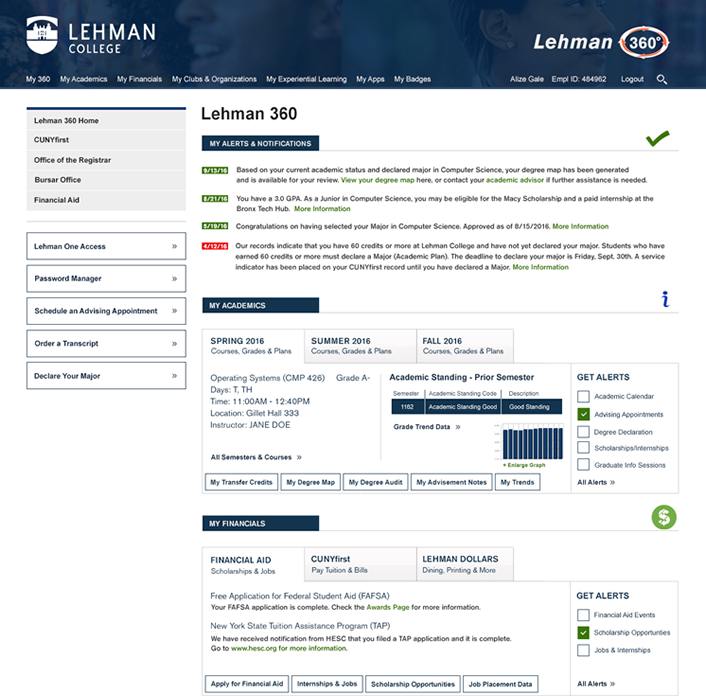
Figure 3 shows a draft design of the student view in Lehman 360.

Figure 3. Lehman 360 design mockup
Differentiating Ourselves
Physicist Niels Bohr is reported to have said, "Prediction is difficult, especially when it's about the future." New machine-learning and artificial intelligence capabilities will dramatically change how we use BI and analytics to supplement the observations and experiences of subject-matter experts. A broad conversation will be needed as we consider, for example, how Siri, Cortana, Alexa, and Watson might be leveraged to support the student experience in the future. As the volume of data grows, higher education will need increased capabilities to integrate and analyze data in ways that serve as differentiators. The innovations we bring to managing BI and analytics in the service of students and society will help shape our success as digital colleges and universities.
Acknowledgments
The author wishes to acknowledge Brian Cohen, CUNY vice chancellor for Technology and university CIO; Dr. Harriet Fayne, interim provost and senior vice president for Academic Affairs; Ediltrudys Ruiz, assistant vice president for Information Technology; David Stevens, Manager of Web Services; and Lehman College IT staff.
Notes
- Susan Grajek, "Top 10 IT Issues, 2016: Divest, Reinvest, and Differentiate," EDUCAUSE Review, January 11, 2016.
- "CUNY Expands Associate Degree Eligibility Benefitting Thousands of Transfer Students," CUNY Newswire, February 24, 2016.
- For more information, see Terri-Lynn B. Thayer, "Achieve a 360-Degree Student View With CRM in Higher Education," Gartner, February 9, 2016.
Ronald M. Bergmann is vice president and CIO, Information Technology Division, Lehman College of the City University of New York. He is a fellow of the 2012 EDUCAUSE/CLIR Frye Leading Change Institute.
© 2016 Ronald M. Bergmann. The text of this article is licensed under Creative Commons BY-NC-ND 4.0.
