
The rapid growth in data generated and collected during educational activities has great potential to inform how we teach and learn. In creating data-informed learning environments, campuses can generate synergies between learning analytics and learning design that allow for real-time adjustment and long-term iterative improvement of digital and classroom-based learning environments.

Data collected in the course of learning activities offers the appealing opportunity for educators to understand how students actually engage in the academic experiences designed for them. This provides a more detailed, comprehensive, and (relatively) impartial version of the kind of classroom feedback that instructors have relied on informally for years. The availability of real-time diagnostic information can support instructors in making responsive adjustments to their teaching in the moment and lead to iterative improvements in learning designs over the long term.
Getting the Right Data
What data to gather to inform learning design depends on the kind of learning environment involved. People tend to think of learning analytics in the context of digital learning environments where it is relatively straightforward to collect data. It is not, however, necessarily straightforward to interpret what the data means. For example, one kind of common data to collect in online learning environments is clickstream data — a running log of what digital objects someone clicks on and when they do so. Such data can be compiled to look at class-wide patterns or identify individuals exhibiting particular behaviors, but it is important to think carefully about what such patterns mean in terms of student engagement and learning. Another kind of data generated online is student artifact data. When the student artifact is text based, as in the case of essays or discussion messages, then natural language processing and machine learning technologies can be used for the purpose of identifying common topics addressed, finding students with similar interests, or evaluating particular qualities of the texts.
While digital learning environments are a natural site for learning analytics, a variety of interesting data can also be collected from classroom-based learning environments. Doing so is important to avoid overly privileging digital traces and ignoring important activity that occurs in the real world. Such multimodal learning analytics are based on data collected from physical spaces, such as speech, gaze, or gesture. There are also possibilities to use video data in combination with computer vision techniques and handwriting or sketch analysis of classroom-created student artifacts. Of course there are critical ethical and privacy issues to consider in collecting any of these kinds of data.
A final important kind of data is self-logged data, where learners voluntarily generate data about themselves. The difference in this data from that previously generated by self-report surveys is that it is collected in the moment (rather than reflectively) over multiple points in time. Frequent quick prompts can ask students to indicate what they are working on or their current confidence around the material at particular points in the learning process. This generates fine-grained data about student activity or attitudes that is more easily interpretable than clickstream data alone and can generate lots of potentially interesting patterns over time.
Ethics and Privacy
Before talking about how data can be used to inform the design of learning environments, it is important to consider ethical and privacy concerns. These issues come up any time data about students is collected and used. The core questions here relate to ownership (whose data is it?), access (who can see the data?), and impact (for what purposes is the data being used?). Such issues don't just affect learning analytics in higher education, of course. Much data tracking and data usage go on in the commercial sector with minimal oversight. However, institutions of higher education have an elevated responsibility to students and need to be both careful and conscientious about what they do with student data.
One important principle here is transparency. Universities need to have clear and understandable policies that let students know what data is being captured and for what purposes it will and will not be used. In terms of access, one way to gain buy-in from students is by giving them the ability to see their own data so they understand the insight it can generate. There is a vast difference in feeling that data on you is being collected by some unseen entity and feeling involved and engaged in the process of using that data. In one of my research projects we found that if you establish an atmosphere of trust (including in this case the clear provision that the analytics were to be used to improve performance, not to evaluate it), then students can find the use of even very fine-grained data acceptable. Universities also need to consider whether opt-out or opt-in provisions are appropriate and what consequences non-participation will have for both students and the institution's information base as a whole. While there are no simple answers, these are questions that every institution needs to think about if planning to use student data in learning analytics.
Data-Informed Learning Design
At a high level the number one thing that happens with data-informed learning environments is that you have much more information going into how you're thinking about the design and helping you evaluate whether what you intend really happens. Many times we design learning environments with the best of intentions, but without many checks to see if what we expect actually results. In classroom-based teaching instructors may be able to use anecdotal reflection to get a holistic sense of things, but this often misses much of the picture. In online learning environments it is even more difficult to have a sense of how the students are engaging. With learning analytics we can set clear goals for what we hope happens during a learning experience and then check to see if this does indeed occur. We want to see if our designs are having the intended effects and creating the kinds of learning experiences we desire for our students; learning analytics gives us a powerful way to achieve this. See figure 1 for an example of discussion forum analytics both embedded directly into the learning system and extracted from it. The colored dots show where learners have been involved in the conversation (light and dark blue dots) and the parts they've missed (red dots). The numerical metrics on the right show that most students have been engaged in reading each other's ideas, though one particular student has spent most of his time looking at his own contributions.
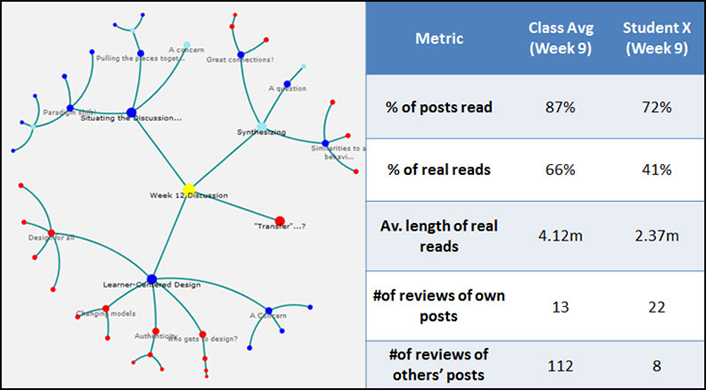
Figure 1. A graphical discussion forum with embedded and extracted analytics
With learning analytics also comes the ability to identify common and consequential patterns. In other words we can see what lots of students are doing and then evaluate whether that is what we want, as well as looking for key moments where students often make big insights or run aground. Once we start to see how that happens, we can redesign our learning environment accordingly. For example, some interesting work has looked at students learning to code and found that there are certain times when they struggle but then reach a solution, and other times when their struggles lead them to get stuck in a sink state. In other words, they hit a dead end where they keep trying the same things without success, clearly spinning their wheels. Once we identify those places, it can inform our design in a variety of different ways. For example, we might decide that we don't want students to end up stuck, so we're going to design a way to keep them from going down that dead-end path. Or, depending on our learning goals, we might want to allow them to explore that path because it's important for them to realize it's a dead end. Once students have found the dead end, we can gently guide them away. Thus learning about the patterns that students engage in offers another way for learning analytics and data to inform the design of learning environments.
Analytics can also be embedded into an environment to inform the learning process directly. Consider research conducted at Stanford that used gaze tracking to study student collaboration. Two students who couldn't see each other were asked to work together to learn about how the brain processes visual information using information and diagrams shown to them on their computer screens. The researchers found that the more the students looked at the same part of the screen at the same time, the higher the quality of their collaboration. This seems straightforward, but then the researchers added an analytic innovation — they supported the collaboration further by providing an indicator on the screen that showed each student where the other student was looking. Embedding this analytic in the interface allowed the students to coordinate their attention as a natural part of their activity without having to discuss it, and this was shown to foster higher quality collaboration and increased learning.
Personalization
"Personalization" has become a buzzword in online learning and learning analytics. There is certainly something attractive in thinking about a learning environment that is uniquely designed to meet our needs. But this tailoring can happen in several different ways. One is through system adaptation, where the environment adjusts itself based on the analytics of a student's past activity. For example, an intelligent tutoring system for math can track the kinds of problems that a student succeeds in solving and those she has problems with and provide a selection of personalized problems to work on. Another way that personalization can occur is through system adaptability, in which the student is able to make adjustments in the system using the analytic data to guide his or her decisions. For example a student might see that he has had troubles with a certain kind of math problem and elect to work on that skill. There are obvious tradeoffs between these two approaches. The first makes preferred choices on the student's behalf, creating a more optimized learning path without any effort on their part. The second asks more of students and requires more support, but creates powerful opportunities for students to become aware of and active in their own learning. This supports their development of self-regulated learning skills, which can lead to better strategies for lifelong learning.
Self-regulated learning skills can also help students make changes to their learning behaviors even without the need to adapt the learning environment. This involves a cycle of goal setting, activity, and refection. See figure 2 for a schematic of this cycle and how it can be supported by the principles of Integration (making sure students are grounded in how the learning analytics relate to the learning activities), Agency (giving students the opportunity to interpret and take action on their own analytics), Reference Frame (providing one or more comparison points for interpreting the analytics), and Dialogue (offering feedback and support to students as needed). For example, in my research group we ran a study that asked students to recall what they thought they did when interacting in a discussion forum and then let them compare this with what they actually did. The differences between what they thought they had done and what the data actually showed was a compelling motivator for them to change their behavior. In this case, while the learning environment itself didn't change, the analytics supported the students in changing the way they interacted with it.
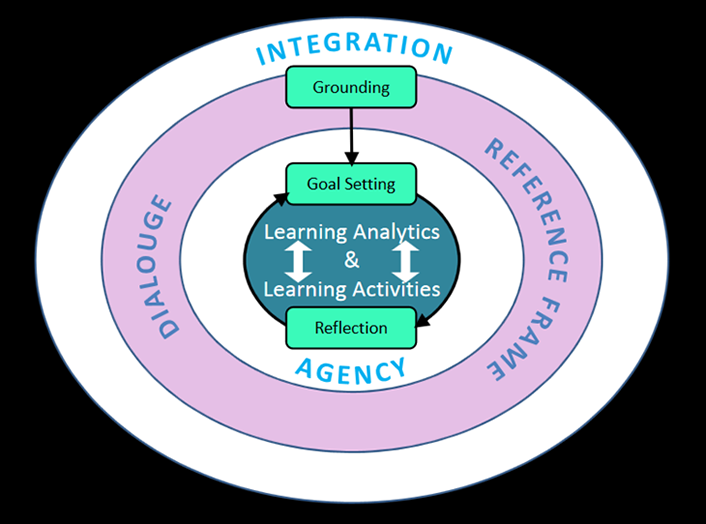
Figure 2. A schematic of how learning analytics can be designed to support students' self-regulated learning
Three Tips for a Data Strategy to Improve Learning Environments
Certain steps can help institutions develop a data strategy that will support the improvement of their learning environments. First, identify the kinds of things you want to track and measure. Think about this as a dynamic consultation process with the eventual end users and resist the temptation to start from the perspective of "this is the data we have." That is a dangerous approach because it doesn't begin with the users in mind. Dynamic consultation means going to the people you hope will use the data, maybe instructors, designers, administrators, or students, and trying to understand their information needs — what kinds of questions do they want to be able to answer with the data? You will also often need to educate people about what is possible with data, as many of them won't know beforehand. By iterating between what the users of the data want and what you know is technically possible, you can start to figure out the data to capture and how you want to process it. This approach will ensure that you are building a system that will be useful to people. A lot of existing analytics systems present pretty dashboards but aren't necessarily very useful to the people who could benefit from them.
Second, you'll want to think about how the data you are collecting can speak to the questions your users want to ask. This relates to the problem of what the data means and often requires thinking beyond basic aggregate reports. A danger with early stage learning analytics, especially from learning management systems, is simply saying, "How much of everything are we doing?" That question presumes a learning model of "more is better," which is not always the case. We don't have infinite time and resources, thus we can't expect everyone to do more of everything all the time. Nor can we presume that simply doing more of the same thing will address all learning challenges. We want to understand at a more fine-grained level what kinds of actions are useful and effective at what point in time. One powerful tool for this purpose is temporal learning analytics. With temporal analytics, instead of simply aggregating the data to count how often something happened, we can look at how learning processes unfold over time, along with more and less productive flows and sequences of activity.
Third, when considering a data plan, think about it in connection with learning environment design. Instead of saying "this is the data that the system already generates; what can we do with it?" take a step back and think about how to design the learning environment to produce useful data. I think this is a huge key to creating better learning analytics because a lot of the challenges we face in analytics now derive from limitations in the data collected. Let me share a simple example in the context of a digital textbook. Many digital textbooks have a tool that lets students highlight a portion of the text as they read. While it is useful to know what text students decided to highlight, we don't know why students highlighted where they did. It might be because they thought something was important or confusing or likely to be on the test. So is more highlighting better or not? It's not clear. Now compare this to a situation in which the highlight tool requires students to pick a color to highlight with, each which has a specific meaning. One color marks something the student wants to remember for the test; another color indicates information the student is excited about. With this small addition we are suddenly able to collect much more useful data that facilitates meaningful interpretation.
Future Considerations
As higher education diversifies and it becomes the norm for students to participate in experiences across learning environments and even institutions, we will need to build systems that let us look at this data together in meaningful ways. In addition, increased attention and value are starting to be placed on co-curricular and informal learning activities as important components of students' overall education, but by their nature these events will take place in all sorts of different learning environments, often not the formal ones. This creates a dilemma. We will want to be able to bring together learning data and evidence of expertise across these systems; however, if we push too hard for tool or data structure uniformity, we will lose the value that comes from having a diversity of options in learning environments available.
Going back to the themes of data privacy, ownership, and learner agency, a more powerful vision for the future involves a diversity of learning environments within a larger analytics ecosystem that provides the technical infrastructure to facilitate efficient communication between those systems. Several projects are going on in this area; for example, learning tool interoperability standards already allow us to have the same tools pulled in to different learning management systems. In the area of learning analytics, the Apereo Foundation has an initiative to create an open analytics infrastructure that would support the collection and analysis of data from a variety of different learning environments. We can also imagine a future where the student is in control of the data documenting the learning trajectories over his or her lifetime. This is an extension of many of the ideas behind learner-controlled e-portfolios, badges, and microcredentialing that we already see happening.
I see great opportunities for data to inform both the design of learning environments and how students engage with them. Institutions can advance these efforts by consulting with their projected end users to produce more useful analytics and by developing clear and conscientious data-use policies.
Alyssa Wise, PhD, is an associate professor of Learning Sciences and Educational Technology in the Steinhardt School of Culture, Education, and Human Development at New York University.
© 2016 Alyssa Wise. The text of this article is licensed under Creative Commons BY-NC-ND 4.0.