
Key Takeaways
- Because in-house labor expenses can consume more than half of the IT budget, it is essential for IT leaders to understand labor's cost, productivity, and impact.
- Valuing an hour of productivity makes it possible to meaningfully estimate labor costs.
- Using a Monte Carlo simulation technique addresses uncertainty for variables such as direct salary.
- Applying this approach is beneficial in itself, beyond the values derived; it can, for example, provide a better understanding of the cost risk involved with a projection, a sensitivity analysis that identifies the greatest risk contributor, and a risk distribution for better decision making.
Jerry Krawczyk, Director, Information Technology Services, The Pennsylvania State University
IT leaders make numerous decisions throughout the day, many of which focus on the overall financial sustainability of an existing IT service; whether to invest in a new or existing IT service; or whether an IT service should be provided in-house, outsourced, or hybrid-sourced. Although estimating hardware and software costs is relatively straightforward (based on vendor quotes, actual contracts, and so on), developing meaningful labor productivity and expense estimates is often challenging — if it is undertaken at all.
However, given that in-house labor expenses can constitute more than 50 percent of the overall cost of providing in-house IT services, it is essential that IT leaders obtain a solid understanding of the cost, productivity, and impact of the labor component. If in-house labor's productivity or cost is estimated inaccurately, informed decisions will be difficult.
To address this and other related concerns, I offer here a quantitative, risk-based approach to improve a decision-maker's understanding of the labor cost component. This approach easily scales to various scenarios, and IT leaders can apply it when conducting any type of cost analysis, cost–benefit analysis, or business case analysis.
To help frame this discussion, it's helpful to consider the following questions:
- How much confidence do you have when assessing an in-house labor cost estimate? Is there clarity about the basis of the estimate?
- When assessing in-house labor estimates versus a third-party contractor or consultant, does the comparison contain comparable cost considerations?
- When planning a project with an estimated number of activity hours, how do you estimate the staffing requirements?
Stepping through the Process
The following process provides a simple and comprehensive approach to estimating the cost impact of labor, factoring in additional cost considerations such as fringe expenses and estimating productive hours.
Step 1: Understand the Direct Salary
First, gather direct staff salary information for the job category or function under consideration. During this step, and all others, it is important that you
- document your assumptions, and
- aim for a reasonable approximation rather than 100 percent accuracy.
As I describe later, the uncertainty for each variable — in this case, direct salary — will be addressed by applying a Monte Carlo simulation technique that will provide a distribution of possible results beyond that of a point estimate.
Step 2: Understand the Fringe Expense
Second, identify the fringe expense, which is typically generated by the Finance and Business organization. The fringe expense captures the university's costs related to employee benefits, Social Security and Medicare, and so on. Depending on the position and the organization, fringe benefits can add from 20–40 percent to the direct salary costs.
Step 3: Estimate the Available Hours
Third, estimate the number of hours the staff resource is actually available for work. "Available hours" are defined as the number of hours a staff member is in the office or other work location to perform assigned work activities. Typically, the calculation is based on eight hours a day, five days a week, and 52 weeks a year, resulting in 2,080 hours per year.
To reflect the reality of work behavior in the United States, however, the available hours might be higher. A Gallup study estimated that the average U.S. worker puts in 47 hours per week.1 Based on this, the number of available hours rises to an estimated 2,444 per year. In general, however, the typical approach is to use the standard 2,080 hours (e.g. 40 hours/week multiplied by 52 weeks/year). See figure 1.
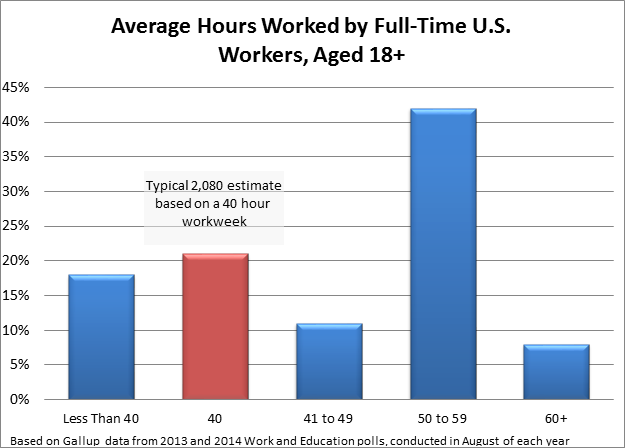
Figure 1. Average hours of U.S. workers based on Gallup study data
The thing to remember is to clearly articulate and document this base assumption. "Unavailable time" is subtracted from the base, capturing the impact from time off during the year, which includes holidays, vacations, training or professional development, and sick time. The net result estimates available hours. To assist in this calculation, I recommend obtaining the "unavailable hour" data from Human Resource records, or the appropriate source, along with minimum and maximum hours resulting from holidays, sick time, vacations, etc.
Step 4: Estimate the Productive Hours
Fourth, estimate the number of productive hours based on the available hours. "Productive hours" is the amount of time staff members actually perform their assigned work activities; it accounts for the fact that staff members do not fully engage in productive activities eight hours a day. Employees spend time on general and administrative activities, such as staff meetings and HR, as well as on standard distractions, such as discussing the weekend football game. The Center for Management and Organization Effectiveness published a study estimating that for "people who work 45 hours/week, approximately 17 hours are considered unproductive."2 Additionally, although not assessing unproductive time specifically, a Draugiem Group study found that the most productive employees took a 17 minute break for every 52 minutes of work.3 So, based on these two studies, unproductive work time could account for 25–38 percent of time during a given week.
Step 5: Additional Overhead Expenses
Finally, in addition to the fringe expenses, most organizations incur employee-related expenses such as providing a computer, telephone, office space, and professional development and training. Such expenses are incurred by any third-party provider; to normalize the comparison, they should be factored in to the internal staff cost as well.
Applying the Process: An Example
To help bring this home, consider the following example. For simplicity, I'll estimate for a single, generic FTE and apply a salary range. The key questions here are:
- What is the productive salary for a Database Administrator Level 3?
- How many productive hours are expected during the year?
- What is the productive hourly rate for a Database Administrator Level 3?
Step 1: Estimating Annual Salary
Assume the average annual salary for a Level 3 Database Administrator is $70,000, with a low-end of $60,000 and a high-end of $95,000. Although this is a wide distribution, you can introduce additional precision by surveying the actual salaries of the resources you expect to use, along with other market-based information.
Step 2: Establishing Fringe Expense
Next, add fringe expense based on the direct salary. For this example, assuming a fringe rate of 35 percent will increase the salary expense to an average of $94,500, with a low of $81,000 and a high of $128,250. The fringe rate will vary from institution to institution; you can obtain it from the appropriate financial office.
Step 3: Finding Available Hours
Next, estimate the number of available hours based on the estimated time the staff is in the office and available for productive work. With the Gallup study in mind, assume available hours based on staff members working 45 hours/week, or 2,340 hours/year, with a minimum of 40 hours/week, or 2,080 hours/year and a maximum of 50 hours/week, or 2,600 hours/year. To calculate the available hours, subtract
- 96 hours for holidays;
- 160 hours (four weeks) for vacations, with a minimum of 40 hours and a maximum of 240 hours;
- 40 hours for time spent at professional development/training, with a minimum of 0 hours and a maximum of 120 hours; and
- 56 hours for sick time, with a minimum of 0 hours and a maximum of 160.
This nets an estimated number of annual available staff hours of 1,988 average, with a minimum of 1,464 and a maximum of 2,464.
Step 4: Determining Productive Hours
Productive hours represent the time that staff members are engaged with deliverable/actual work. For reference, this is what external consultants consider as the "billable" rate (less profit). You can base the estimated number of productive hours on a percentage derived from any time-tracking system. For the purpose of this example, assume that 25 percent of a staff member's time in the office is consumed by "nonproductive" work, with a minimum of 10 percent and a maximum of 35 percent. The net result: a staff member's productive hours vary from 952 to 2,218 at the extremes, with an average of 1,491 annually.
Step 5: Predicting Additional Expenses
Based on the average point estimates, the fully burdened productive annual salary for a Level 3 Database Administrator is approximately $148,000 (assuming a $70,000 base salary). Based on anecdotal data, you can estimate that the university's support-related expenses (such as computers, office supplies, and training) will vary between $5,000 and $15,000 per year, with an average of $10,000 per year. Adding this to the salary and fringe expense yields a total average cost of $158,000.
Summarizing the Estimate
Based the calculations described in these five steps, we can calculate that a fully burdened productive salary is approximately $158,000, with a productive hourly rate of $105.74. Calculating the minimum staff cost, based on the lowest salary ($60,000) and highest productivity worker (2,218 productive hours/year), generates a productive salary of approximately $100,000, with an hourly rate of $45.23. Alternatively, the maximum staff cost, based on the highest salary ($95,000) and lowest productivity worker (952 productive hours/year), generates a productive salary of approximately $293,804, with an hourly rate of $308.75.
Bounding the Estimate
The resultant point-estimates methodology produces an almost meaningless result because the minimum-maximum variance is so high (approximately $200,000). This is where using a Monte Carlo simulation pays dividends. The Monte Carlo simulation technique is a mathematical/statistical evaluation that randomly samples each input variable to obtain a probability profile or risk profile of the output. The benefit of the Monte Carlo simulation is that the output will be bound from a risk distribution perspective, and the most sensitive variables identified for further risk mitigation.
Based on the example, use the input and distributions shown in table 1. Derive the midpoint, minimum, and maximum from estimates, actuals, and statistical sampling. Calculate the average based on the scenario distribution. The calculated average will vary from the midpoint estimate if the data's distribution is abnormal.
Table 1. Example bounded estimate
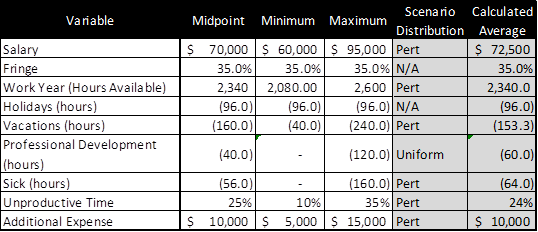
The result of the Monte Carlo simulation (based on 10,000 samples and assigned distributions) is a calculated average productive salary of $164,344, bound with a 90 percent variability of between $138,046 and $194,625. In other words, there is a 90 percent probability that the productive salary will fall within this range, as shown in figure 2.
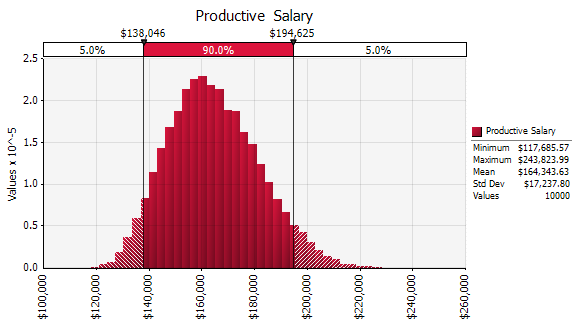
Figure 2. Estimated average productive salary
The Monte Carlo simulation also shows the average productive hours per year of 1,491, with a 90 percent probability that these hours will fall between 1,292 and 1,711 (see figure 3). This calculation will be helpful during project planning and scheduling exercises, when it is important to consider the impact of nonproductive time for determining resource needs versus resource requirements related to a project schedule.
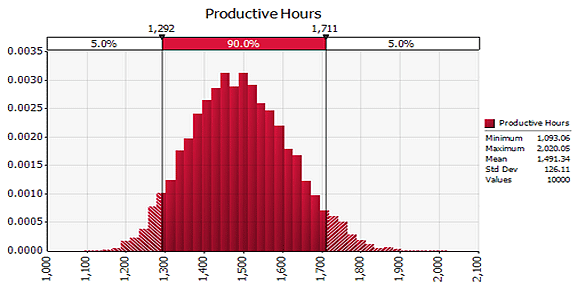
Figure 3. Estimated productive hours
Finally, the Monte Carlo simulation lets us calculate the number of staff members that equate to FTEs. Here, if an FTE equates to 2,000 hours of productive work, approximately 1.25 staff members are equal to 1 FTE or 2,000 hours of productive work, with a 90 percent probability range of between 1.15 and 1.35 staff member per FTE.
Dividing the productive salary by the productive hours yields an average productive hourly rate of $111.51, with a 90 percent probability range from $83.48 to $144.40 (see figure 4). You can use such an estimate when comparing the relative costs of in-house labor with outsourced or consulting labor.
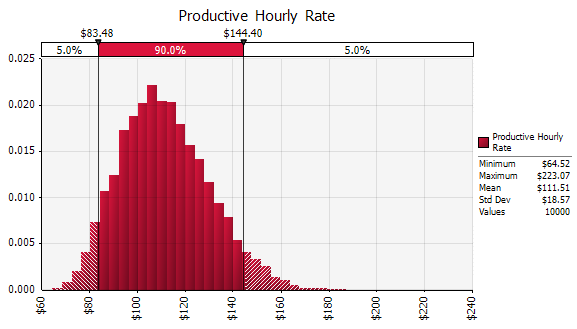
Figure 4. Estimated productive hourly rate
Discussion: Applying the Method
Although the values provided in this example are based on actual values, the objective of describing this methodology is not to focus on the values, but rather on the application and benefit of the approach itself. Such a focus illuminates four key takeaways.
First, this methodology is highly scalable, from large, complex business-case analyses down to single-position cost estimates. The value is in not only allowing you to derive an estimate based on the embedded uncertainty but also to understand the probability distribution around the resulting estimate. For example, using the resulting average cost or hours estimate implies that there is a 50–50 probability of labor cost overruns based on the input distributions. Thus, a conservative planning approach might be to use the 75 percent values, thereby building cost-risk mitigation into the plan.
Second, the quality of the analysis depends on the quality of the assumptions and input variables. The more precision and confidence in the input, the better the quality of the output. Using actual institutional data plus industry benchmarks is highly recommended.
Third, as institutions increasingly discuss moving IT services to the "cloud" or outsourcing specific activities, they must be able to make such decisions based on comparable data. This methodology offers a way to develop a comparable comparison between the cost of in-house labor and that of a third-party vendor.
Finally, using this approach helps you quantify the true cost of a productive, efficient use of labor resources, which is beneficial for resource and project planning.
Developing reasonable and defendable labor cost estimates is achievable and not as difficult as often portrayed. The decision-maker gains a better understanding of the impact of the labor cost associated with delivery of a service or on a project that encompasses more than just the direct salary. Additionally, as the adoption of cloud or third-party services continues to grow, this approach will help "normalize" the cost elements when comparing IT service or project alternatives.
- Lydia Saad, "The '40-Hour' Workweek Is Actually Longer — by Seven Hours," Gallup, August 29, 2014.
- Christopher Stowell, "Workers Only Average Three Productive Days per Week!" Center for Management and Organization Effectiveness.
- Lisa Evans, "The Exact Amount of Time you Should Work Every Day," Fast Company, September 15, 2014.
© 2014 Gerard Krawczyk. The text of this EDUCAUSE Review online article is licensed under the Creative Commons Attribution-NonCommercial 4.0 license.