
Key Takeaways
- Learner-centered approaches to higher education require that instructors have insight into their students' characteristics, but instructors often prepare their courses long before they have an opportunity to meet the students.
- To address this dilemma, we developed the institutional Student Profile Report, which informs instructors about the demographics, enrollment history, and general academic performance of the students in their upcoming classes before the start of the semester.
- Survey results indicated that instructors found the report interesting and useful, and our analysis of grade outcomes found that the report did not introduce bias in letter grade assignment.
Benjamin A. Motz, Senior Lecturer, Department of Psychological and Brain Sciences and Cognitive Science Program; Julie A. Teague, Senior Analyst and Programmer, and Linda L. Shepard, Director, Bloomington Assessment and Research, Indiana University
Institutions of higher education aggregate and warehouse many terabytes of student data, aiding routine functions including degree conferral, financial aid eligibility, online course management, and more. In recent years, scholars of teaching and learning have begun exploring new ways to utilize these "big data" resources, extracting information that might directly contribute to the institution's educational mission. These nascent methodologies have come to be termed learning analytics.1 For the most part, efforts in learning analytics have focused primarily on the development of predictive safety nets, empirically derived early warning systems that deploy flags and interventions for students who are underperforming or otherwise "at risk."2 Nonetheless, some believe that learning analytics has largely untapped potential, with far more value to be gained from mining student data, beyond providing diagnostic tools.3
Accordingly, this article describes a novel use of institutional data resources in higher education. Rather than providing information about students at risk, we aimed to develop a system that would broadly inform instructors about all their enrolled students, providing summarized institutional data about the aggregate characteristics of the students enrolled in their respective classes. We call it the Student Profile Report (SPR), a short document that summarizes student records, intended to provide a useful snapshot of information about the population of students taking a course prior to the start of a semester. We hypothesized that, when given this report, instructors might be spurred to develop more learner-centered course materials, better accommodating their students' characteristics. Our current research seeks evidence that instructors would be attentive and responsive to this implementation of learning analytics and, importantly, that the report would not cause bias in letter grade assignment.
Figure 1 shows an SPR for Telecommunications T206, Introduction to Design and Production. "Univ Index" describes how the percentage for the class compares with the university as a whole: a value < 100 means that the percent of females in the class is lower than the percent of females on campus, and conversely, a value > 100 means a greater percentage of females in the class than on campus; "Pgm Index" compares to all other Telecommunications courses; and "Course Index" compares to all other sections of T206. Professor Jane Doe might use this report to discover that the 123 students in her upcoming class are more likely to be male, ethnically diverse, somewhat challenged by math and science (as indicated by the low percentages receiving As and Bs in Math M118 and Psychology P101), but also performed relatively well in Introductory Telecommunications (T101).
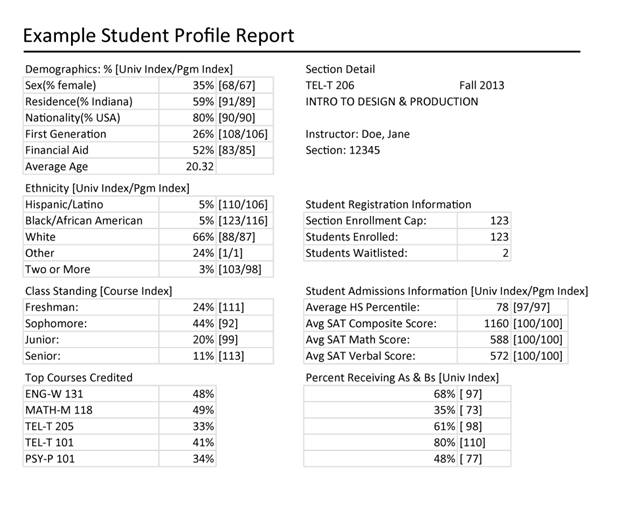
Figure 1. SPR for the course Introduction to Design and Production
Theoretical Framework
Why should an institution provide aggregate student information to instructors? Because the alternative (expecting instructors to craft courses with minimal knowledge of the enrolled students) is pedagogically indefensible.
The overarching goal of teaching is not to deliver information to faceless crowds, but instead to cause learning to occur among enrolled students.4 Courses and classroom activities should be developed on the basis of helping students discover and construct knowledge, not on the basis of what the instructor wants to talk about.5 And importantly, to develop successful learning activities, instructors must have some insight into their students' relevant knowledge base, and they must also be sensitive to their students' sociocultural approaches to education.6 Otherwise, instructors risk more than just appearing "out of touch" — they risk developing ineffective educational experiences. Course planning involves predicting the effects of learning activities on a group of students, and to make successful predictions, we must have relevant knowledge about those whose behaviors we are trying to predict.7
For these reasons, experienced teachers advocate for instructors (particularly new instructors) to collect information about their students at the beginning of the semester, either by administering a questionnaire or by giving a short ungraded test that directly measures background knowledge.8 These efforts could help inform instructors about their students' interests, abilities, demographics, and skill sets, and ideally, the remainder of the course would be tailored to the general characteristics measured in this initial survey.
But practically speaking, these efforts may be too little, too late for a course to be meaningfully centered on the enrolled students. Most course policies, readings, assignments, and activities are developed well in advance of the first day of class, firmly cemented in the syllabus long before enrolled students even take the tags off their back-to-school outfits. Getting to know students at the start of the term may foster better relationships between students and faculty (a nontrivial outcome), but this is unlikely to result in any substantive customization of course structure. Exceptionally thoughtful, reflective instructors do exist, who customize and adapt their course after the start of the semester, but it's our experience that these instructors are relatively rare and special, and these efforts at learning about students requires substantial time investment. Moreover, of all the traditional first day of class activities, students rank an instructor's efforts at learning about them as having the lowest perceived importance.9
Instructors' efforts at surveying their classrooms might also be redundant. Institutional data resources could supplant an instructor's need to survey students, and reports about these institutional records might also be made available to instructors weeks before the start of classes, allowing them sufficient time to tailor their instructional strategies and exercises according to the enrolled students' characteristics.
Student Profile Report
Here we describe and evaluate an effort to provide summarized institutional data to individual instructors, informing them about the aggregate characteristics of the students enrolled in their respective classes. But as we developed the SPR, three issues presented administrative hurdles to the report's widespread rollout:
- Gauging whether teaching faculty were interested in receiving this type of information about their students, and assessing how it might be used
- Preserving the confidentiality of student information
- Evaluating whether this information would introduce bias in instructional activities
The SPR implementation and pilot program described here attempt to address these practical challenges.
The Issue of Instructor Interest
For the SPR to have any positive effects on teaching and learning, instructors must have sufficient interest in the report to access it, read it, and reflect on it. Unless instructors are eager to know summary statistics about their future students, the data analysts responsible for developing and distributing the SPR would better spend their limited time on other institutional reporting projects.
Highly effective instructors, even those keenly interesting in knowing about their students, might have good reasons to disregard the SPR. Carter et al. found that expert teachers in grade school are generally skeptical of the usefulness of information on individual students and want to avoid making judgments too soon about their future students.10 At the college level, seasoned instructors may be undaunted by the prospect of preparing a course for another cohort of yet-unknown future students because experiences with previous students in prior classes already provide useful information about what works and what doesn't. It makes sense to generalize from past experiences when planning for future semesters, and these past experiences could provide richer insight into the general properties of the students who tend to take a particular course than any canned institutional report. Of course, to the extent that student characteristics change from semester to semester, an instructor's experiences with past classes may offer a limited (if not inaccurate) understanding of the student group enrolled for an upcoming semester.
The SPR might also meet resistance among instructors who already plan to survey their classes at the start of the semester. Instructors might already be invested in using their own questionnaires to collect information about their students, and if so, the SPR might be seen as superfluous. Or contrariwise, if an instructor has absolutely no interest in tailoring the course to the characteristics of enrolled students, the report might also be seen as having minimal value.
For these reasons, the study sought to evaluate whether instructors are generally interested in the SPR and whether the SPR contains information that they would normally gather through other methods. Since an institutional report is only as valuable as its perceived usefulness to the institution's mission,11 we saw strong merit in assessing whether instructors would appreciate and use the SPR.
The Issue of Confidentiality
Student records are protected under FERPA (Family Education Rights and Privacy Act, 1974) such that even faculty and instructors must be designated in university policy as "school officials" and demonstrate "legitimate educational interest" in order to access student information. Faculty assign grades for their respective courses, but generally, faculty may not access the student records of previous enrollments, grades, or admissions information for any individual student without the student's written consent.12
While typically a faculty member should not be able to access an individual student's previous grade in another course, no legal barrier prevents faculty from accessing the average grade for all students in a course, or in the course's home department, in a given semester. Aggregate student records are routinely disclosed, and the average course grade in a large introductory course poses minimal risk to the disclosure of any individual student's grades. However, the U.S. Department of Education, in response to student inquiries, has cautioned institutions to be mindful of the possible de-identification of individual students through small cell sizes and recommends that institutions develop reasonable practices and policies to reduce the risk of disclosure.13
Our disclosure limitation strategy for the SPR (developed in consultation with our institution's legal counsel) is to aggregate data to minimal cell sizes, such that the SPR would only output data about groups of five or more students. Instructors teaching classes with fewer than five students enrolled would not have access to an SPR for that class (the queries that populate the report would return null results). In this way, instructors can learn about the aggregate properties of all students enrolled in their respective courses, which should suffice to tailor the overarching structure of their courses while still protecting the confidentiality of the individual students' records.
Security pertains not only to what appears on the report, but also to who has access to the report and its underlying data. We developed the SPR as a standard report object made broadly available to the campus through a web-based reporting interface, and the report required only four simple parameters: department, course number, section number, and semester. However, the information needed to generate the report (such as transcript data, prematriculation metrics like test scores, and demographic data) is highly restricted, and the query accesses "live" data in the enterprise warehouse, a protected environment. To minimize the data management issue of opening the warehouse to large numbers of faculty, key administrators who already have access to the warehouse serve as the front door to the SPR. Establishing administrative data experts as the point of entry for the report seems suboptimal, although there are some advantages. The administrators are already trained in appropriate data handling, they have the opportunity to discuss any concerns with department heads or faculty before distributing the report, they can validate the data, and they can help contextualize the information for others (for example, determining optimal timing of the report to capture the majority of registrations). Key issues for seamless data steward approval of the SPR were: (1) the reliance on administrators to pull the data rather than creating security profiles for faculty; (2) the sign-off from legal counsel concerning cell size; and (3) addressing the potential for grading bias.
The Issue of Bias
If instructors know that their students, in aggregate, performed relatively poorly or relatively well in previous courses, will this knowledge affect how the students' current work is evaluated? Evidence exists for this type of bias, sometimes referred to as the self-fulfilling prophecy effect, where an instructor's understanding of a student's prior performance biases the way the instructor interacts with that student.14 Instructors also have adjusted their teaching behaviors on the basis of whether they have high or low expectations for the class as a whole.15
Differentiating one's teaching strategies on the basis of expected student ability may be seen as a problematic bias, but alternatively, this differentiation might be seen as a good thing — customizing instruction to the abilities of learners is a positive and productive feature of learner-centered pedagogies. An instructor who is blind to the students' abilities might set unattainably high expectations or languidly low standards, neither of which would result in a constructive learning environment. Nevertheless, if information in the SPR might lead to low expectations, and in turn these low expectations might lead to poor instruction and student learning outcomes for some students, this would constitute a strong reason to withhold institutional student records from instructors.
To date, we are not aware of research on the effects of providing accurate aggregate student information to college instructors, nor do we know whether this type of knowledge about students has triggered or augmented biases in course outcomes, particularly in letter grade assignment. An important goal of our study was to measure and report any such effects stemming from instructors receiving aggregate student data.
Method
Our study involved (1) distributing the SPR via e-mail to a random sample of eligible instructors one month before the start of the semester and (2) comparing final grade outcomes between the students in these classes and in classes where the instructor did not receive the report. Interest in the report was measured by a short online survey distributed two weeks after the start of the semester to those instructors who received the report. All aspects of this project were approved by our local institutional review board.
Participants
One month before the start of the 2013 fall semester, we created a list of all 200- and 300-level undergraduate courses at our institution that met the following criteria: exactly one instructor of record teaching only one section of that course (excluding any team-taught courses), projected enrollment of at least 60 students, 3 credit hours with letter grade assignment (excluding pass/fail classes), and in-person class meetings scheduled in a campus lecture hall for the full length of the semester. We excluded introductory 100-level classes so that the students enrolled in selected classes might be more likely to have prior relevant coursework, which would result in a more informative report; we also excluded advanced 400-level courses, which generally tended to have small class sizes. We then randomly sampled 100 of the eligible classes. The instructors of half of these sampled classes (chosen at random) were selected to receive the SPR, and the remaining instructors did not receive a report; the latter were held as a control group to compare grade outcomes among a comparable sample of courses.
We later excluded classes from our analysis if the section was cancelled, if the instructor of record changed (which tended to occur when adjunct instructors were assigned just before the start of the term), or if another instructor of record was added to the class during the semester. After these exclusions, there remained 41 classes in the group that would receive the SPR and 33 in the control group. We confirmed that these final samples (after exclusions) were roughly evenly divided across major disciplinary subdivisions (humanities, social sciences, natural sciences, etc.).
Materials
We developed the SPR following consultation with our institution's teaching center (including both faculty and instructional consultants), our institutional research group, our institution's legal counsel, and our faculty governance committee. During brainstorming meetings we reviewed the available data resources in our institution's data repository, selected data that were relevant to teaching and learning, and considered how to summarize the data in order to provide insight about a student population's characteristics.
SPRs were generated from our institution's data warehouse via a web-based reporting environment. An authorized user (typically departmental administrative assistants) only needed to provide a section code and a semester to retrieve an up-to-date SPR formatted as a Microsoft Excel file. If fewer than five students enrolled in the section, the report returned null results.
Most of the variables on the SPR also include additional numbers listed in square brackets: Univ Index, Pgm Index, and/or Course Index. These indexes can be used to compare the student population in the reported course with the properties of larger comparison populations. An index is calculated by dividing the reported value by a base value, and then multiplying by 100. For instance, if 35 percent of students enrolled in TEL-T206 are female, while 51.3 percent of the students enrolled in the institution are female, the Univ Index is (35/51.3) × 100 = 68. Indexes below 100 indicate that the reported value (e.g., 35 percent) is less than the base value (e.g., 51.3 percent), while indexes above 100 indicate that the reported value is greater than the base value. Univ Index compares the value to the entire undergraduate student population of our campus; Pgm Index compares the value to the program in which the course was listed (e.g., all other undergraduate telecommunications courses for the TEL-T206 report), and Course Index compares the value to all other sections of the course (e.g., all other sections of TEL-T206).
We also developed a short web-based survey in Qualtrics, intended to measure instructor attitudes to the SPR and only targeting those instructors who received an SPR. Participants responded to survey items using five-point scales, rating their agreement with statements about the SPR, or rating the usefulness of specific elements in the SPR. The last page of the survey also included two open-ended questions, inviting instructors to describe any specific, concrete changes they made to their teaching as a result of reading the report and to share any general feedback about the SPR.
Procedure
We began this project by generating SPRs for the instructors of each of the sampled classes in the treated group. These reports, in Microsoft Excel format, were e-mailed to the class's instructor exactly one month before the start of the semester, accompanied by a PDF containing a detailed explanation of the pilot program and additional documentation regarding the content of the report. This documentation, which was developed in consultation with faculty and instructional consultants, included background information on learner-centered instruction, recommendations on how to interpret the report, and general recommendations about which aspects of a course might be improved using insights from the report. In both the e-mail and the documentation, we included provisos that the information in the SPR was provided only to facilitate the development of more apposite classroom activities for the enrolled students, and that it should have no influence on final letter grade outcomes. The e-mail also mentioned that instructors would be invited to fill out a short survey about their attitudes toward the SPR after the start of the semester.
Then, exactly two weeks after the start of the semester, we sent an e-mail invitation for these instructors to take the survey. Each instructor received a personalized link to the survey, hosted on Qualtrics, so that responses could be easily matched to instructors. Two days after this initial invitation, instructors who had not yet completed the survey received an e-mail reminder.
The first page of the survey included an informed consent statement, and respondents indicated their consent to participate in this study by continuing with the survey. The next page asked respondents to indicate whether they had received the SPR. Those who had no recollection of receiving the SPR, or who did not open it, were thanked for their response and did not proceed further. The remaining survey questions were only presented to instructors who indicated that they received and opened the SPR for their class.
Four months after the end of the fall semester we collected grade information from our institution's registrar for all selected classes (both treated and control) and double-checked that the final instructor of record for each class was the same as the instructor assigned before the start of the semester. Any class where the instructor changed (both treated and control) was removed from further analysis (see "Participants," above).
Results and Discussion
Executive Summary of Results
- Instructors who received the SPR were interested in the report and wanted to continue to access it in future semesters.
- The report caused some instructors to adopt learner-centered perspectives, tweaking specific teaching tactics to emphasize material that would accommodate the properties of enrolled students.
- There was no evidence of grading bias; the report did not cause instructors to assign grades that were artificially close to the students' prior grades.
How Was the SPR Received by Instructors?
Of the 41 instructors in the group who received the SPR, 20 ultimately submitted a response (48.8 percent), but four of them indicated they did not see the SPR or had no recollection of receiving it, and thus were excluded from further analysis, leaving 16 respondents total. Although admittedly a small sample, we have no reason to believe it unrepresentative of what we might observe if we had targeted a larger group.
In figures 2 and 3, the diverging stacked bar chart shows the frequency distribution of responses to each item, horizontally aligned so that each distribution is centered on the midpoint response, "Neither Agree nor Disagree," or "Somewhat Useful," marked with a vertical line.
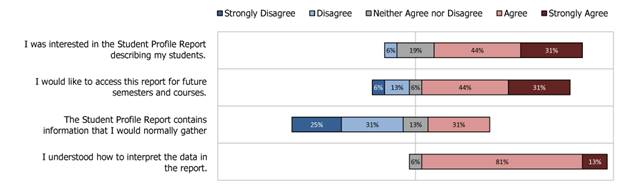
Figure 2. Instructor agreement with survey items
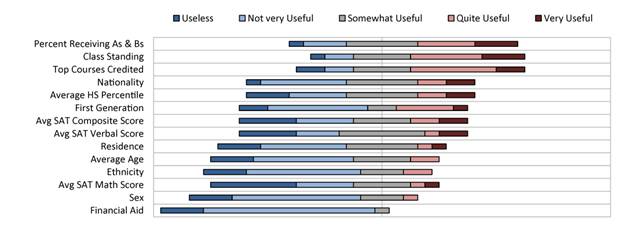
Figure 3. Ratings of each individual element's usefulness in the SPR
The first survey item asked respondents to rate their agreement with the statement, "I was interested in the Student Profile Report describing my students." As shown in figure 2, respondents indicated that they were indeed interested in the SPR, and the average agreement was significantly higher than the midpoint (which was labeled "Neither agree nor disagree"), t(15) = 4.47, p < .001. Moreover, agreement with the statement "I would like to access this report for future semesters and courses" was also significantly higher than the midpoint, t(15) = 2.66, p = .018. These provide strong evidence that a sizeable proportion of college instructors would be interested in receiving the information detailed in the SPR.
A large proportion of respondents (51 percent) explicitly disagreed that the SPR contained information they "would normally gather through other methods," suggesting that the SPR delivers new insights that generally do not overlap with instructors' typical methods for learning about their students. Responses to this item overall did not differ significantly from the midpoint (p = .12), but the fact that the bulk of respondents found new information in the SPR suggests that the report is not superfluous. Even if it did contain information that an instructor would normally collect, the SPR has the advantage of providing this information before the start of the semester. Importantly, the student information rendered on the SPR was not overly technical or inaccessible, as the majority agreed that they understood how to interpret the report, t(15) = 9.60, p < .001.
We also asked instructors to rate the usefulness of each individual element within the SPR. Figure 3 displays these ratings, ranked by their average usefulness (most useful on top). Overall, instructors tended to find the students' prior coursework to be most useful; particularly the previous courses taken, the percent who received As and Bs in these previous courses, and the students' average class standings (freshmen, sophomore, etc.). These presumably helped inform instructors about potential strengths and deficiencies in their students' relevant background knowledge. An instructor of a 300-level neuroscience course wrote that she "added slides simplifying scientific concepts since clearly some students were not scientifically inclined as indicated by the credited courses."
Even though some elements of the SPR ranked low in usefulness overall, some instructors found them to be pedagogically informative and actionable. The instructor for an Environmental Policy course wrote that the "data on residence and ethnicity help me choose the types of examples to use in explaining concepts." And on observing disproportionately more males in his European History course (40 percent female), an instructor tweaked the schedule to make more time for topics "such as gender questions, everyday life, etc." to ensure that these would not be given short shrift in class discussions. With the exception of the percent of students receiving financial aid, at least one instructor found every piece of information on the SPR useful.
Did the SPR Introduce or Augment Bias in Grade Outcomes?
For every class (both those whose instructor received the SPR and those who served as a control), we retrieved the class's combined incoming cumulative grade point average (GPA; on a four-point scale) immediately prior to the start of the semester, and then the final assigned average class grade in GPA units from our institution's registrar. The difference between the class's assigned GPA and incoming GPA (GPA difference) can be considered an indirect measure of grading bias. If students' prior academic marks, as detailed in the SPR, caused instructors to assign grades that were artificially close to the students' prior grades, we ought to see smaller GPA differences for those instructors who received the SPR. These GPA differences might be affected by many factors besides grading bias (section characteristics, changing standards in upper-division courses, etc.), but if the SPR does cause grading bias, this specific effect should be evident in these results.
We investigated these effects by fitting a simple linear model, assessing whether GPA difference (dependent variable) could be predicted by whether an instructor received an SPR report (binary independent variable; 1 if instructor received the SPR, and 0 if class was in the control group). We also included the class's incoming GPA as a covariate, because GPA differences might be influenced by the students' prior academic performance independent of whether the instructor receives the SPR. And finally, we also included the interaction between incoming GPA and whether the instructor receives the SPR, to test for the possibility that getting the SPR could introduce bias for high-performing and low-performing students in different ways.
Overall, the model predicted a significant proportion of the variance in GPA difference between classes, adjusted-r2 = .191, F(3, 70) = 5.523, p = .002, but the only significant factor in this model was the students' incoming GPA, F(1, 70) = 12.522, p = .001. In other words, our sample size was large enough to detect measureable effects on students' GPA differences, but we observed no effect of receiving the SPR — only the students' average incoming grades affected the GPA difference between their incoming and assigned grades. Figure 4 shows the scatterplot depicting this correlation.
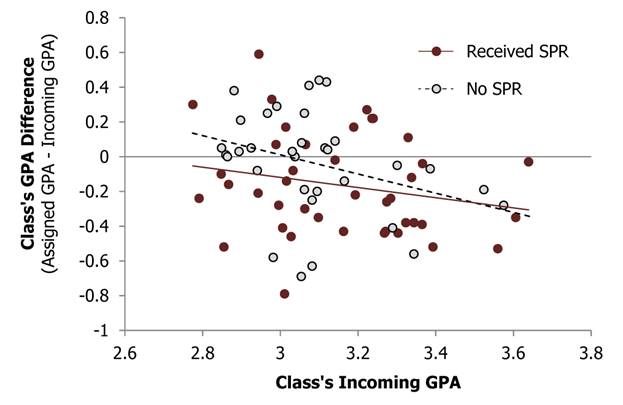
Figure 4. Scatterplot showing negative correlation between class's incoming GPA and GPA difference
In general, when incoming students had high GPAs (right side of graph), the class's assigned GPA tended to be lower than the incoming GPA (which results in a negative GPA difference); when incoming students had low GPAs (left side of graph), the class's GPA difference was higher. The data revealed no significant influence of receiving the SPR (p = .638), nor any significant interaction between receiving the SPR and incoming GPA (p = .701).
In short, the SPR had no measurable effect of inflating or deflating students' final letter grade outcomes in the direction of their prior grades.
This analysis provides evidence against the hypothesis that the SPR might cause self-fulfilling prophecy effect in letter grade assignment among treated classes; moreover, it also provides evidence against a general self-fulfilling prophecy effect in any of these courses. Across a wide range of courses and disciplines, classes with students on the low end of the academic spectrum got slightly better grades, and classes with high-performing students got slightly worse grades. In other words, instructors tended to assign similar grades regardless of whether their classes were populated with those who'd previously been relatively high-achieving or relatively low-achieving students. This might be interpreted as academic regression-to-the-mean rather than some polarization of outcomes that would be predicted by theories of the self-fulfilling prophecy in higher education. Instructors showed no tendency to assign grades that were near to their students' past grades; and even when the students' previous grades, in aggregate, were explicitly given to the instructor in the SPR, these had no influence on the instructor's letter grade assignment. As one Biology professor wrote in the subsequent survey, "I find that high school scores, SAT scores, and even previous grades … are not at all predictive of student performance in my class."
General Discussion
Overall, a majority of instructors found the SPR interesting, providing a new perspective on their students, and most expressed interest in continuing to receive it for future classes. Because there was no evidence that the SPR introduced or augmented any bias in letter grade assignment, we see strong merit in continuing to develop and distribute this report to instructors.
In a perfect world there would be no need for the SPR. Ideally the college instructor would carefully assess each student's interests and abilities and provide personalized instruction accordingly. Unfortunately, the current realities of most institutions of higher education (e.g., large class sizes, tenured faculty balancing research commitments with teaching, increasing reliance on part-time instructors with other priorities) are not conducive to tailored learner-centered pedagogical approaches. A simple institutional report cannot affect these realities, nor can it, on its own, create an effective educational environment. But it may nevertheless help instructors learn about, and reflect on, the properties of their enrolled students, and this reflection may have the subtle effect of reframing teaching activities, improving their alignment with students' interests and background (as indicated in survey responses). Additionally, the SPR might fertilize a faculty culture of learner-centered approaches to teaching. Future work will evaluate these effects in greater detail.
In the meantime, institutions that wish to provide aggregate student information to instructors might use our current research outcomes as rationalization that instructors will generally appreciate such an initiative and that it is unlikely to cause grading bias.
The fact that we found no evidence of grading bias or self-fulfilling prophecy effects is not entirely surprising, as these effects, if evident, have been demonstrated to be minimal and generally to dissipate rather than accumulate over time.16 Moreover, in the large classes that we investigated (minimum 60 students), the bulk of grading was likely handled by teaching assistants or rigid examinations, neither of which is expected to be particularly sensitive to the SPR. It may also be the case that aggregate information about an ostensibly diverse group of students is simply insufficient to trigger any type of evaluative bias when dealing with individual students. Legal (and ethical) barriers prohibit instructors from seeing their individual students' previous grades, and prior to the current work, paranoia about the confidentiality of student records might have extended this barrier to prevent instructors from learning about their students in aggregate. We hope that the current work, and specifically, our failure to observe any evidence of grading bias, begins to eliminate that concern. Considering the value in knowing about one's students, we hope the current study opens the doors to new teaching innovations and more tailored educational environments. For example, in the future we might imagine delivery to faculty of some enhanced derivative of the SPR within an online learning management system, populated with real-time data. We expect that demands for learning analytics such as these will grow in the near future, and additional investigations into the ways that faculty use these data should prove a fruitful area for future research.
Nevertheless, with the goal of reinforcing the importance of fairness in letter grade assignment, we still advocate that the SPR be distributed with a short reminder that the background information described in the report should not affect assessment of the students' future work.
Survey results suggested a wide range of pedagogical purposes served by the SPR, ranging from merely satisfying an instructor's curiosity (one wrote that the SPR "confirmed a few of my suspicions about my B210 students") to effecting curricular changes in course schedules and classroom materials to accommodate the enrolled students' general characteristics. Importantly, these more substantive revisions did not result from having browbeaten instructors with repetitive seminars and workshops on being learner-centric; rather, instructors were simply interested to learn about their students, and on being provided the SPR, some made changes accordingly. Anecdotally, during the pilot semester we received about a dozen requests from other instructors who had seen their colleagues' SPRs and wanted a report on their own classes. Our results clearly indicate that the SPR was well received, and a range of subtle but positive outcomes seemed to stem from the instructors' insights.
Even so, four respondents indicated (in open-ended feedback) that they could not identify any specific use for the report (and provided low usefulness ratings to all items in the survey), but all four noted that they were nevertheless interested in the report. An instructor for a class on the history of sports wrote, "The student profile report was interesting but did not impact a decision to change my current teaching strategies." And the instructor of a Statistics course wrote, "While the report helped me frame my thinking about the students, I did not make any concrete changes to the course for this semester based on the report." It seems clear that instructors' interest in learning about their students does not require any self-evident utility to these insights. Even the Biology professor (who asserted that his students' prior work was not predictive of success in his course) agreed that the report was interesting and that he would want to have it in future semesters. As the Statistics professor suggested, there may be more subtle benefits to simply having a general understanding of the students enrolled in a course.
Since we conducted this initial pilot, the SPR has been introduced to our campus at a variety of campus meetings, faculty committees, campus conferences, and events around Innovative Teaching and Learning. The SPR has been used to provoke ideas around other learning analytics projects and is being reviewed as a tool for establishing baseline metrics for classroom comparison studies. In all these venues, the response to the SPR has been positive.
Higher education's continuing shifts toward learner-centered instruction are critically important as our field comes under more pressure to demonstrate educational value. The SPR seemed to have the effect of propelling instructors, in a small but non-negligible way, in this direction — toward providing instruction slightly better aligned with their students' needs. In this way, the SPR provides a novel demonstration of the power of learning analytics to positively affect higher education.
Acknowledgments
The authors are grateful to Greg Siering, Katie Kearns, and Laura Carpenter for their expertise and facilitation of this effort, and to the anonymous reviewers who provided keen insights and helpful comments on an earlier version this article.
- Ryan Baker and George Siemens, "Educational data mining and learning analytics," in Cambridge Handbook of the Learning Sciences, ed. R. Keith Sawyer (Cambridge: Cambridge University Press, 2014); and George Siemens, "Learning analytics: The emergence of a discipline," American Behavioral Scientist 57 (2013): 1380–1400.
- Catherine Rampell, "Colleges mine data to predict dropouts," Chronicle of Higher Education 54, May 30, 2008; Kimberly Arnold, "Signals: Applying academic analytics," EDUCAUSE Quarterly 33, no. 1 (2010): 1–10; and Leah Macfadyen and Shane Dawson, "Mining LMS data to develop an 'early warning system' for educators: A proof of concept," Computers & Education 54 (2010): 588–599.
- George Siemens and Phil Long, "Penetrating the fog: Analytics in learning and education," EDUCAUSE Review 46, no. 5 (2011): 30–32.
- Robert Barr and John Tagg, "From teaching to learning: A new paradigm for undergraduate education," Change: The Magazine of Higher Learning 27 (1995): 12–26.
- Phyllis Blumberg, Developing learner-centered teaching: A practical guide for faculty (San Francisco, CA: John Wiley & Sons, 2009); and Maryellen Weimer, Learner-centered teaching: Five key changes to practice (San Francisco, CA: John Wiley & Sons, 2013).
- John Bransford, Ann Brown, and Rodney Cocking, How people learn (Washington, DC: National Academy Press, 2000); and George Kuh, Jillian Kinzie, John Schuh, and Elizabeth Whitt, Student success in college: Creating conditions that matter (San Francisco, CA: John Wiley & Sons, 2010).
- Ziva Kunda, Social cognition: Making sense of people (Cambridge, MA: MIT Press, 1999).
- Dean Dorn, "The first day of class: Problems and strategies." Teaching Sociology 15 (1987): 61-72; Rebecca Brent and Richard Felder, "It's a start." College Teaching 47 (1999): 14-17; and Wilbert McKeachie and Marilla Svinicki, McKeachie's teaching tips (Belmont, CA: Wadsworth, 2013).
- Amber Henslee, Danny Burgess, and William Buskist, "Student preferences for first day of class activities," Teaching of Psychology 33 (2006): 189–207; and Jonathan Bassett and P. Marie Nix, "Students' first day of class preferences: Factor structure and individual differences," North American Journal of Psychology 13 (2011): 373–381.
- Kathy Carter, Donna Sabers, Katherine Cushing, Stefinee Pinnegar, and David Berliner, "Processing and using information about students: A study of expert, novice, and postulant teachers," Teaching and Teacher Education 3 (1987): 147–157.
- David Norris, Linda Baer, Joan Leonard, Louis Pugliese, and Paul Lefrere, "Action analytics: Measuring and improving performance that matters in higher education," EDUCAUSE Review 43 no. 1 (2008): 42–67.
- Family Educational Rights and Privacy Act (FERPA) of 1974, 20 U.S.C. § 1232g (1974); and Bobbye Fry, "An academic dilemma: student records, faculty access, and the Family Educational Rights and Privacy Act," PhD diss., Texas Tech University (1999).
- Privacy Technical Assistance Center [http://ptac.ed.gov/], "Data-De-identification: Overview of Basic Terms," US Department of Education, 2012.
- Robert Rosenthal and Lenore Jacobson, Pygmalion in the classroom: Teacher expectation and pupils’ intellectual development (New York: Holt, Rinehart & Winston, 1968); and Samuel Wineburg, "The self-fulfillment of the self-fulfilling prophecy," Educational Researcher 16 (1987): 28–37.
- Christine Rubie-Davies, "Teacher expectations and perceptions of student attributes: Is there a relationship?" British Journal of Educational Psychology 80 (2010): 121–135.
- Lee Jussim and Kent Harber, "Teacher expectations and self-fulfilling prophecies: Knowns and unknowns, resolved and unresolved controversies," Personality and Social Psychology Review 9 (2005): 131–155.
© 2015 Benjamin A. Motz, Julie A. Teague, and Linda L. Shepard. The text of this EDUCAUSE Review article is licensed under the Creative Commons Attribution 4.0 license.