
Key Takeaways
- Encouraging literacy about change management — change literacy — will help varied campus constituencies deal with ongoing change by developing their change readiness.
- Most change efforts exhibit a productivity and emotional pattern as the organization and its people adjust to the new state, typically illustrated as a "change curve."
- A change readiness index became the leading method of measuring relative readiness across disparate colleges, helping to quickly identify key steps that a college could take to improve its readiness.
Jim Russell is academic integration manager at the City University of New York.
Many aspects of change programs found in the private sector apply to higher education if modified for colleges and universities. This article presents one view of what change management can mean in higher education and three examples of how to modify some of those practices for use on campus. Ultimately, encouraging literacy about change management — what I call change literacy — will help varied campus constituencies deal with ongoing change by developing their change readiness.
What Is Change Management?
First I should probably explain what change management is coming to mean since its formalization as a discipline in the early 2000s. Think of "change management" as the people and processes aspects of change rather than the technical aspect that IT manages though project management and other methodologies. The best change managers employ a broad range of skills and tools to assist people within organizations experiencing change. I have found it impossible to identify any single tool or universal approach. Instead I work with dozens of tools to identify the best one for each situation.
The tools change managers employ might include Six Sigma, PROSCI's Best Practices, or William Bridges' Leading Organizational Change. The skills managers use might include communications, facilitation, training, process analysis, and executive coaching. Determining which skills or tools to use in different circumstances varies with the situation. Many change managers spend almost as much time adding or refining skills as they do employing them in a change effort.
There are two schools of thought on what change techniques can do for an organization, and those perspectives often drive where any change initiative is situated within an organization. Those two approaches boil down to:
- The management of change as a tactical initiative associated with a project or project portfolio
- Change management as a strategic tool
Tactical vs. Strategic Change Management
The change effort in which I have been involved for the past five years (as a member of the project implementation team within IT) has been a tactical one. The City University of New York has been deploying an ERP system called "CUNYfirst" in a wave approach. The tools I use are generally repeatable across those waves, and the amount of time I have to engage with any particular community is limited and tied to the need to move on to the next wave. My role as academic integration manager has entailed general change management as well as work with specific constituents, including faculty and academic leadership. The team that works with me includes training and communications professionals as well as other change managers.
When viewed as a strategic initiative, change management incorporates change tools such as executive development or continuous process improvement into diverse parts of the organization. Some colleges and universities have developed executive positions or departments focusing on program services (New York University [http://www.nyu.edu/about/leadership-university-administration/office-of-the-president/office-of-the-executivevicepresident/finance-and-budget/program-services.html]), institutional effectiveness (Baruch College, CUNY), or organizational change management (Yale [http://its.yale.edu/services/client-teams-business-systems/its-management/organizational-change-management-ocm]). Some of these structures function as a discrete service available to campus constituents from the sponsoring unit, often IT. Others work across reporting units to bring a holistic perspective on change management. A term I frequently use to describe such a sustained, holistic approach to change is change literacy.
Change literacy is the development of awareness and expertise with a range of change skills and tools that allow organizations to cope with ongoing change. This change readiness makes the whole organization more agile and better able to cope with periodic disruption from intense change associated with improvements, be they technological or otherwise.
Lesson One: Drawing Your Way to Engagement
Several years ago I worked with Ted Joyce at Baruch College on incorporating "clickers" into his economics classes. What I found particularly engaging with his teaching style was his use of the classic supply and demand curve, which he would draw for his students at the beginning of the term. After he established the basic concept, he would "scaffold" any new concepts on that original curve. He would re-draw the curve and apply "sin taxes" to modify the demand, for example, or to show how decreased supply might maximize demand. And his students "got it" with this approach. Similarly, I often look for "foundational" drawings when introducing some of the core concepts of change to leaders and managers at colleges.
The Theory
Most change efforts exhibit a productivity and emotional pattern as the organization and its people adjust to the new state. This phenomenon is typically illustrated as a "change curve." The change curve in part represents the human response to change and is based on a combination of psychological models including Kurt Lewin's three-phase model of social change1 and Elisabeth Kübler-Ross's "Five Stages of Grief"2 model explaining people's reaction to death. Over the years, many organizational and behavioral researchers have explored, expanded, and adapted the change curve to reflect the emotional reactions of people to transitions and change. Figure 1 shows a typical change curve with emotional reactions to the change initiated.
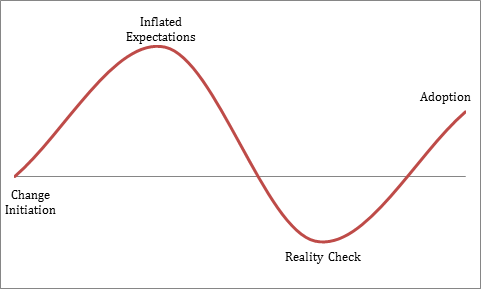
Figure 1. Basic change curve
One of the first stages of developing change literacy involves introducing this explanatory curve and underlying concepts to the executives and directors who will lead their organizations through a planned change. I draw this curve several times during the change process and eventually develop an understanding of where these organizations lie on the curve at different stages of a project or change initiative. Sometimes the change is greater than the typical change curve represents, so the amplitude is higher. Sometimes the organization deploys change management techniques to reduce the depth of the oft-cited "valley of despair," yielding a shallower dip in the downward curve representing the emotional "reality check." The point is, the basic curve can and should be modified to represent each organization's actual status throughout the change process.
I might use the same curve to describe the productivity dip often observed at the go-live of a new product or service as the people and processes adjust to the new state. That dip can be labeled on the downward curve shown in figure 2.
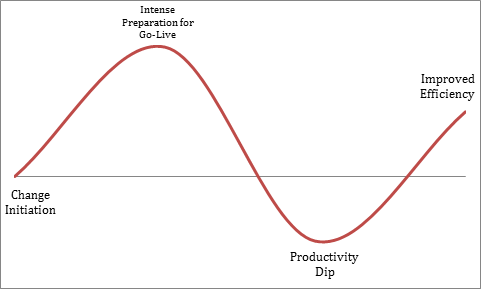
Figure 2. Change curve with productivity dip
The Experience
When considering how faculty at several CUNY campuses perceived productivity associated with CUNYfirst, I began to see a pattern of near resentment for the loss of services as the project drew resources away from the day-to-day support of the academic community on those campuses. For many, especially those with limited exposure to the planning around the ERP deployment, the productivity dip preceded the implementation. Their requests for services from operational staff were likely to have been delayed due either to staff commitments to the project or freezes in the configuration or shadow system during the implementation process. I thus drew the perceived productivity dip shown in figure 3.
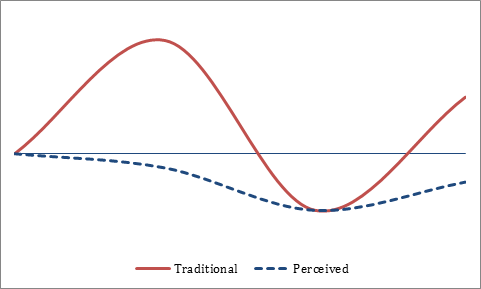
Figure 3. Change curve with perceived productivity dip prior to ERP implementation
The Resolution
One of my goals is to create "ah-ha" moments when the observers of the perceived productivity curve find their organization on the curve, validating the sense of frustration they hear from their campus constituents. Then they understand why the expectations of the ERP change are low for some. This demonstration worked well for one of the CUNY colleges going through the change process, as the campus CIO explained.
Following that experience, I suggested mediation efforts that focus on
- communicating to campus constituents the reason and necessity for redirecting operational staff,
- developing transparency for constituents into the efforts leading up to go-live as well as work order queues, and
- dedicating operational staff to help specific services recover when they become available after the lead-up time to the ERP implementation.
What made this a change literacy vignette was that with any future change initiatives, the executives involved can watch for this perception gap and address it earlier.
Lesson Two: Communications in Higher Ed
When I compare notes with IT leaders about change initiatives, one of the topics that comes up frequently is communications. Too many people believe the oversimplification that change problems can be avoided by more (and more) communication. I have also heard change practitioners say that one can't over-communicate. More will not help when using the wrong communications content or vehicle or communicating with the wrong people. I have found this problem amplified on the academic side, where faculty members have a low tolerance for "business spam" and engage at a high level, along with their non-teaching and research colleagues. As a result, I've observed seasoned communications professionals struggle with how to gain credibility and traction with the faculty at colleges where I have worked.
The Theory
One communication theory suggests that every community (or college or university) has a communicative ecology.3 I like to use the term "ecology" because it helps evoke the idea that the landscape is dynamic and will change as a result of any intrusion, such as a new message about change. Such an ecology incorporates the technologies of communicating within the organization as well as aspects of the social communities and the themes of the communications.
As a result of the campus community's scholarly interests, the very nature of the communications is richer and more nuanced than ecologies outside of higher education. That does not mean that higher education is "smarter" than other industries, but rather that communication methods have developed with a greater reliance on scholarly approaches. I have found the willingness of people in our community to question top-down initiatives and the protections (tenured or unionized) that allow them to express those questions vary from most private sector experiences. Combine that with well-educated and informed questioners, and communicators must anticipate the nature and types of responses that our community will generate. Examples I've experienced include CIS faculty critiquing the hosting platform use of single threaded operating systems, design faculty disparaging the use of frames in the user interface, or education faculty concerned about the lack of scaffolding theory applied to the training programs. This mindset constitutes the first, or academic, layer of the communicative ecology in higher education.
The second, or social, layer is as dynamic as in many private sectors, but the influence of some communities is disproportionate, such as the oft-cited influence of faculty (or more particularly faculty governance arms such as the faculty senate or executive committees). This result of the shared governance model prevalent in higher education forces any communication plan associated with a change effort to become more complex than typical communications plans. Thus, communications paths that might be deemphasized in a typical hierarchical organization will be turned on end when the social influence of specific communities falls outside the traditional reporting stream. We all experience this when we attempt to account for the influence of faculty organizations, union employees, and groups such as graduate assistants, academic support personnel, centers and institutes, or operations councils. How should we communicate with each constituency? When? And, in particular, what role should two-way communications play with each community? These questions challenge even the most experienced higher ed administrators.
The third, final, layer of the communicative ecology is the technical (a term used as broadly as possible). Communication can use face-to-face meetings, for example, e-mail, pieces of paper placed in mailboxes in the departmental offices, or anything in between. This technical layer may not prove as successful as its counterparts in the private sector, however. For instance, when adjuncts elect to read college-sponsored e-mail on third-party accounts such as Gmail or AOL, those systems may not aggregate accounts well. These external mail systems also periodically block college-sourced mail if the college is on a "black list" of spam conduits or if the bulk distribution causes the e-mail provider to place the message in a spam folder. Also note that some colleges struggle with simpler technologies and are challenged just getting staff to pick up the pieces of paper placed in their inboxes or to come to a general faculty meeting.
With this ecological perspective of three layers to consider, the actual message still needs to be introduced into the ecology. John Kotter, one of the early advocates for a structured approach to change in organizations, wrote about the need to communicate a vision of the future state [http://www.kotterinternational.com/our-principles/changesteps] to promote buy-in. Most change management efforts develop a communications plan to help do that, the thought being that once leaders have established a vision, a framework or plan can be used to deliver that vision.
The Experience
John Ray, the communications manager for CUNYfirst, learned a few lessons about what should go into these communications plans and what pitfalls should be avoided.
"The largest challenge I experienced in attempting to communicate this massive change to an audience of 40,000 faculty and staff, and about 250,000 students, was get the attention of a seemingly uninterested population (faculty and some leadership), feeding a hungry audience (mid-level managers, front-line staff and administrative support) and reaching students who rarely gather at the same place (physical and virtual) in a predictable manner. We learned that we needed to bypass managers who usually controlled information getting to staff members who have the most frequent interaction with constituents (HR, Help Desk, Bursar, Registrar, Admissions, Financial Aid) by meeting them and sending memos and material directly."
A higher education communicative ecology formed the basis of Ray's challenges. That ecology included a diverse set of constituencies with disparate social contexts and competing priorities that drew attention away from any change messages. He also experienced the usual technological hurdles with adjunct e-mail, portal content, and spam filters, which represent the technological layers of the higher education ecology.
The Resolution
Ray's solution was to push communications and communications plans out to a distributed network of communications liaisons. He also promoted local assessments to pinpoint aspects of communications infrastructure that require attention. One of the most important lessons he developed was around agility and the need to continuously monitor the "health" of communications and make changes where appropriate.
Content shared with local communications liaisons included some of the future state visioning that Kotter called for, but Ray was careful not to provide too much hype or spin. The communication liaisons then worked with local change leaders to share the information with "influentials" who helped carry the message in a way that direct, top-down communications might not have been able to do as successfully. Influencers included faculty champions and student marketing teams in addition to the directors in operational units.
Ray encouraged colleges and departments to ask themselves how well prior communications actually worked, who the truly influential people were, and several other questions to help them understand how communications really worked for them. At times he supplied information to key staff members rather than directors and sent messages directly to groups when the local situation warranted it.
Ray's solutions become more holistic when communities that had become accustomed to regular communications continued to look for it after the original implementation ended. Leadership and management have stepped up by delivering more communications through monthly video conferences or more frequent updates to communities on new projects. One of the techniques Ray introduced to campuses — involving student or faculty champions — has been reused when campuses launch new services or tools. For instance, one of our senior colleges decided to expand the footprint of Hobsons, the CRM tool used by their admissions office. The project manager at the college consciously took several of Ray's communications approaches and applied them to the change effort within that project.
Lesson Three: Measuring for Change
 "The only man I know who behaves sensibly is my tailor; he takes my measurements anew each time he sees me. The rest go on with their old measurements and expect me to fit them."
― George Bernard Shaw, Man and Superman
The final lesson learned involves CUNY's efforts to measure and understand how ready certain schools are for additional change. This is one of the questions CUNY struggled with, especially given our flexibility with the sequencing of the rollout. Many other colleges also have asked me this question when dealing with capacity for change at their college or how to identify the weaknesses in a change effort.
CUNY developed a survey that gave the central administration a chance to understand the impressions faculty and staff had regarding the project's details. Designed as a bi-annual survey, it captured data in 2008 and 2010 on confidence in campus leadership, effectiveness of project communication, customer service orientation at the colleges, and satisfaction with features such as training and usability.
This survey wasn't detailed enough for those of us trying to work with colleges to improve the likelihood of success or to identify which colleges were ready for additional modules of CUNYfirst. In a 2006 article in EDUCAUSE Quarterly Martin Klubeck and others wrote about the need for metrics to "tell a story."4 The story we needed to measure was readiness and capacity for change. What I wanted was a metric that told the story of the CUNY colleges' change readiness.
Adapting the Private Sector Tool
The change readiness audit model from Kate Nelson and Stacy Aaron is a model that can help evaluate change readiness.5 They run a consulting practice that includes training on their particular set of tools for change managers. Among this model's features is a series of questions that help clarify or discover some basic factors a change manager looks for in terms of readiness. Generally these factors will tie back to the earliest steps on ProSci's stages of personal change development, specifically Awareness, Desire, and Knowledge. The ProSci method predicates organizational change upon individual change and uses the acronym "ADKAR" to describe those change stages: Awareness, Desire, Knowledge, Ability, and Reinforcement.
I began modifying the concept behind the change readiness audit into a change readiness index to address our tactical needs. An advantage of doing this was being able to identify some of the characteristics that contributed to inhibited success with our vanguard rollout. Based on a series of focus groups held with the early adopting schools, I created a series of factors to examine in predicting readiness:
- Business ownership. Is everyone prepared to do their part to support CUNYfirst? Are disciplines in place to support communications and training? More importantly, is it understood that the success or failure of the implementation is the campus's responsibility and that they own the outcome?
- Coordination. Are cross-functional teams cooperating to redesign processes, or are people territorial? Are operational units coordinating with one another and leveraging common resources?
- IT ownership. Is the campus IT unit ensuring that data, reports, and systems are integrated and prepared for CUNYfirst? Are end-user support mechanisms in place, and has the data landscape (including shadow systems) been prepared for launch?
- Knowledge management. Is the campus preparing their processes, training, and knowledge sharing to support the CUNYfirst launch? Do they know how their organization currently functions, how it will function with the CUNYfirst system, and what the key differences will be?
- Leadership. Does the VP level understand the urgency for change and fully support it? Are managers empowered to make decisions? Is behavior supporting the change rewarded?
Over time we've reused these factors with other implementations. However, we have found that some changes and implementations do not depend on success in each of these areas. Examples included the non-critical role of knowledge management in system changes that did not impact processes or responsibilities, or the decreased presence of IT in other rollouts. While this list served us well through three waves of campus rollouts, we have lessened some factors based on the evolving change footprint.
To provide measurements in these areas I worked with the team to design surveys for key staff members in each college's operational areas. We decided to include in the survey pool a distribution of 10 percent leadership, 30 percent managers, and 60 percent staff below the managerial level. In many cases we targeted the questions to specific levels because the "knowledge holder" might be the manager and not the lower staff members. We developed rubrics to let us evaluate the responses and derive a measurement. The final step was developing a weight for each question within the factor after we had developed and reviewed the final list of questions.
- Competency/Success Category: Coordination
- Meta Question: Does the operational team meet regularly with each other?
- Literal Question: Were all areas represented in the last three meetings?
- Question Target: Manager
- Rubric: 1=no, 5=yes
And
- Competency/Success Category: Business ownership
- Meta Question: Does the campus have a functioning communications process?
- Literal Question: What is CUNYfirst?
- Question Target: Staff
- Rubric: 1=I don't know, 5= CUNYfirst stands for Fully Integrated Resources and Services Tool; replace aging legacy systems; streamline and standardize many of the things we do at our colleges while maintaining individuality; modernize our toolset to meet real-world conditions, and improve data security to protect our students and staff
Figure 4 shows weighting of the readiness factors in response to the survey questions.
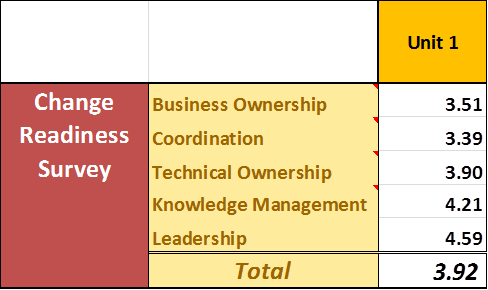
Figure 4. Quantitative results of change readiness survey
I have also found value in tracking a more subjective evaluation of the college's readiness. This allowed me to capture other influences such as executive turnover, competing local priorities distracting staff from the CUNYfirst implementation, or the presence of high-performing teams or individuals that would help lift the staff during the implementation. In this case I benefited from working with change mangers who had experience with other change efforts and could independently gauge conditions at the campus that were not included in the general survey questions of the readiness survey. These gauges became a qualitative score that I included in the composite picture.
The final dimension in the picture I developed for readiness was an examination of staffing size. I felt the need to measure this because of a foundational concept for me on how organizations absorb productivity dips. That concept is that organizations either absorb the shock through its systems or its people. Either the system is so well designed that it can handle inefficient processes and let users recover from the productivity dip, or the people running those systems will work harder, faster, or smarter to absorb that dip.
This dimension can be hard to measure across units because the roles and responsibilities of individuals such as bursar vary from college to college, as do the boundaries between support units such as IT and the functional operations units. Additionally, the number of students will vary, as will the type of students, and processes might be broader to support certain demographics of students. For instance, colleges with a higher percentage of students receiving federal or state financial aid will need more staff or systems to support those students than a law school or medical school with less financial aid and more student loans. With these complications I rely on normative data and make certain assumptions.
I assume that, in aggregate, community colleges in this region will have similar demographics and staffing requirements, as will comprehensive colleges or colleges with graduate programs. I do not attempt to determine the correct number of staff; instead I measure colleges that have more or less than the average of their peers. To perform these measurements I must first identify FTE by functional unit. In a few cases where a "one-stop" service existed or the traditional registrar responsibilities were distributed, I worked with the colleges to standardize the FTE staff count by operational unit.
I used the official student and staff FTE counts to establish a support ratio. In the end, the best measurement was a z-score,6 which allowed me to indicate just how far from the average a particular unit's staffing ratio fell. I isolated overall operational support ratios to students as well as to those units that support faculty or staff affected by the CUNYfirst implementation.
Finally, I added to the picture any outstanding comments that I felt executives should consider when reviewing readiness. This included key missing staff members, differentiated missions, and items from the quantitative or qualitative assessments such as a high number of "don't know" responses (indicating possible confusion or poor communication) or a high degree of resistance to the project on a particular campus. Figure 5 shows a sample change readiness dashboard for five colleges.
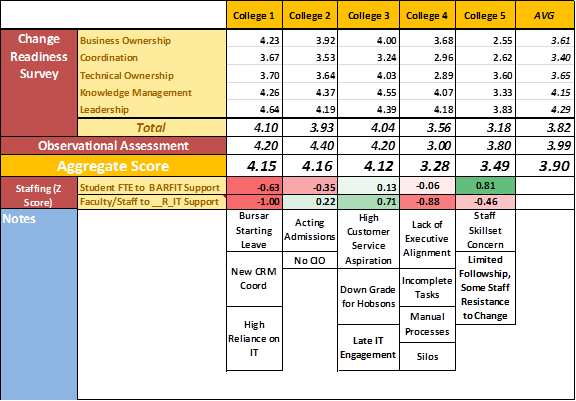
Figure 5. Example change readiness index dashboard
The change readiness index became the team's leading method of measuring relative readiness across disparate colleges. It allowed us to quickly identify key steps that a college could take to improve its readiness. In some cases it also allowed us to accurately predict where greater support would be necessary at go-live so that we were prepared to minimize the disruption of the ERP implementation. It gave the executives at the colleges as well as the central administration a story of the readiness of each group of colleges.
Recommendations
- Prepare your organizations for the upcoming period of rapid change in higher education through learning to manage change.
- Work with professional change managers to identify appropriate tools that will help you manage changes.
- Never assume that private sector tools can just be dropped into higher education environments.
- Develop a sensitivity to how these tools may need to be modified to work in higher education.
- Where possible, develop sustainable models of managing change that can contribute to change literacy at your institution.
Conclusion
The lessons learned by taking practices common in the non–higher education market and applying them around the tactical change effort of CUNY's ERP implementation represent just three possibilities of targeted change management in higher education. Just as with many other change efforts in higher education, we also have been developing centers of excellence around process reengineering, training, and executive leadership development. A rich body of knowledge and practices continues to be developed by many individuals and organizations working on change management. With a bit of prudent review and tweaking, colleges and universities should be able to adapt these change management tools to improve agility both within a specific project and within the whole organization, ideally developing a degree of change literacy among constituents. The resulting agility and responsiveness in the face of change will help higher education institutions deal successfully with the ongoing demands for reimagining their services and business models.
- Kurt Lewin, Field Theory in Social Science, Harper and Row, 1951.
- Elizabeth Kübler-Ross, On Death and Dying (New York: Macmillan, 1969).
- David L. Altheide, "An Ecology of Communication: Toward a Mapping of the Effective Environment," Sociological Quarterly, Vol. 35, No. 4 (1994), pp. 665–683.
- Martin Klubeck, Michael Langthorne, and Don Padgett, "Do-It-Yourself Metrics,"EDUCAUSE Quarterly, January 1, 2006.
- Kate Nelson and Stacy Aaron, The Change Management Pocket Guide: Tools for Managing Change (Cincinnati, OH: Change Guides LLC, 2005).
- From Wikipedia: In statistics, a standard score (or z-score) indicates by how many standard deviations an observation or datum is above or below the mean. It is a dimensionless quantity derived by subtracting the population mean from an individual raw score and then dividing the difference by the population standard deviation.
© 2014 Jim Russell. The text of this EDUCAUSE Review online article is licensed under the Creative Commons Attribution-NonCommercial- ShareAlike 4.0 license.