
Key Takeaways
- Higher-education institutions are under increasing pressure to innovate with technology and disseminate the results, but it can prove challenging to please diverse stakeholders in the process.
- This study surveyed faculty members and IT leaders within the University System of Georgia to examine their perceptions of and priorities for technological innovation.
- Survey responses were categorized into 17 critical success factors (CSFs) that respondents identified in relation to technology innovation, adoption, and diffusion.
- Institutions can use these CSFs to focus their own efforts and address issues that are most critical to faculty and IT, as well as to generate understanding of diverse priorities between the groups, and thus increase the odds of successful innovation efforts.
Wayne Dennison is vice president of Information Technology and chief information officer, Rose-Hulman Institute of Technology.
Information and communication technologies' rapid advancement, coupled with growing demand from a knowledge-driven society, places increased pressure on higher-education institutions to innovate with technology and disseminate the results.1 Researchers have proposed multiple definitions of innovation; however, it commonly refers to "the introduction of a new idea, method, or device."2 Today, the innovation focus is frequently on technology, largely because new technologies can provide flexibility and enhance operations for institutions that invest the time and energy in the adoption process.3
Once institutions decide to pursue a technological innovation, they must consider the logistics of how the process occurs as well as the timing. This may pose a dilemma, as multiple diverse groups on university campuses have differing — and sometimes competing — goals and priorities. Attempting to meet the demands of the campus community may impact the innovation process in terms of timing and/or addressing strategic goals. For example, some groups may need to move more quickly than practical due to an immediate need or readily available funding, while others may need to move more slowly to allow for thorough identification of requirements or to secure funding. IT leaders often must find a way to navigate this balancing act and meet the needs of their campus.
This research focused on two groups that play primary roles in higher-education innovation efforts: faculty and IT leaders. Faculty members comprise a primary constituent group on university campuses and use many different technologies. The ubiquitous use of technology by faculty and other constituent groups poses a challenge for university IT leaders — one that will likely continue to escalate in the foreseeable future as new teaching and learning tools continue to emerge.4 Meeting this challenge, while ensuring faculty members have an innovative atmosphere in which to be creative, is a major consideration of IT leaders on university campuses.
I conducted a survey to explore the perceptions of faculty and IT leaders regarding the critical success factors (CSFs) that impact technological innovation, adoption, and diffusion. The resulting data can be used to help university faculty members and IT leaders gain a better understanding of the CSFs that help ensure efficacious technological innovation and diffusion in a university setting. It can also help faculty members and IT leaders gain insights into each other's perspectives and create new synergies through collaboration, as well as better support innovation and diffusion processes by focusing efforts on the most critical items.
Technology Innovation in Higher Education
According to Yu-Mae Wang and Jerry Patterson,5 diffusion of technology is a complex and difficult process that is further complicated in a university environment due to the innovative culture it typically encourages. Trent Batson suggested that higher education's technological innovation environment is similar to that of an exciting new playground, where the children want to try all the pieces of equipment at once.6 The contention is that a child "running from apparatus to apparatus is analogous to the grand tour education has been on for thirty years, the technology rapture grand tour."7
This depiction of higher education's relationship with technology describes the chaos that technology can encourage. Technological innovation takes many forms on a university campus, and multiple constituents routinely experiment with one new technology after another in search of a magic bullet. The goal of this experimentation is often to resolve a particular issue, such as enhancing teaching, improving operations, or helping showcase the campus. This activity often leads to the identification of technological tools that help benefit not only the faculty and other university employees, but also the students and, ultimately, the overall educational process.
A common belief in the IT industry is that technology reinvents itself every three to five years. The need to be innovative to stay current is paramount. This is especially true for universities as they prepare to educate a growing number of students in an increasingly competitive business world. Innovation and the diffusion of beneficial instructional technologies is one way to address the expanding needs of students. Technology's nature will likely continue to change and flourish, especially in higher education.
An educational environment promotes growth and fosters a culture in which technological advances are not only in demand, but expected. As part of this evolution, faculty and IT leaders play pivotal roles in determining the best fit for technology in their particular university context. A traditional African proverb says "If you want to go quickly, go alone. If you want to go far, go together." By working together, faculty and IT leaders can discover new technological innovations, leveraging these tools to benefit their university and students more than if they work separately or toward opposing goals. This collaboration will help enhance teaching and learning, better prepare universities to meet the demands of today's students, and allow universities to go farther than if the individual factions work alone.
Methods
I approached this research using John F. Rockart's CSF theory,8 which defines CSFs as the "limited number of areas in which results, if they are satisfactory, will ensure successful competitive performance for the organization." This technique is often used in business environments to identify how an organization can become more competitive; however, CSF studies can be "valuable for making sense out of problems where there are many potential factors influencing the outcome."9
In this study, I used Rockart's theoretical perspective to identify CSFs of technological innovation and diffusion in a university setting, where many different variables can impact the adoption and diffusion process. To collect data, I distributed surveys to 2,091 faculty and IT leaders within the University System of Georgia (USG). To define the survey population, I engaged two statewide groups: the Digital Innovation (DI) Group and the USG's CIO Advisory Council.
The DI Group's mission as outlined on its website is "to facilitate immersion, sharing, collaboration and 'dreaming' to foster innovation by faculty, staff, and students, as well as, corporate agency and community members in the use of digital technologies to enhance the learning experience." The DI Group comprises approximately 2,200 faculty and staff throughout the USG who have participated in the group's professional development opportunities. I selected faculty participants who had self-identified by registering for an online or face-to-face professional development course with the DI Group development session focused on innovative uses of technology in teaching and learning.
The CIO Advisory Council consists of IT leaders from each USG institution, identified by the membership listing of individuals who serve as either the primary or secondary representative for their institutions. Typically, the "primary" representative is the university CIO and "secondary" representatives are campus Chief Technology Officers (CTO) and/or IT Directors. This group has an executive committee that meets monthly; the group at large meets four times a year to discuss technology-related matters and serves in an advisory capacity to the USG CIO.
I adapted the survey instrument from David Garson and Shannon Schelin's study,10 which reviewed the CSFs of IT initiatives. Their original study solicited the opinions of 38 CIOs, deemed to be experts in the field, and identified 14 CSFs for IT initiatives. The instrument consists of open-ended questions that encourage narrative responses, and closed-ended questions that yield short answers. I used the instrument to solicit feedback from the faculty and IT leader participants regarding the factors they believed to be critical to successful technological innovation and diffusion in higher education.
Results
In all, 405 individuals responded to the survey, for an overall response rate of 19.37 percent; faculty and IT leader response rates were 17.47 percent and 78.46 percent, respectively. The demographic information collected included gender, age, and educational level. Figure 1 shows the gender demographics of the survey respondents, a large number of whom were female. When examining the faculty and IT leader groups separately, approximately two-thirds of the faculty respondents were female and 90 percent of IT leader respondents were male. The higher number of male respondents from the IT leader group is indicative of the make-up of the CIO Advisory Council membership as a whole; however, the number of female responses from the faculty group was higher than expected. The Digital Advisory Group's demographic composition was not available for comparison.
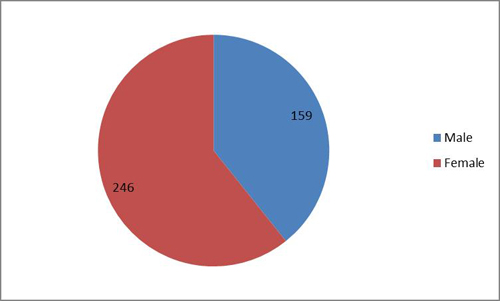
Figure 1. Gender of survey respondents
Figure 2 shows the respondents' age distribution. The majority of faculty respondents (59.6 percent) were between the ages of 41 and 60; 21.19 percent were below the age of 41 and 19.21 percent were above the age of 60. IT leader respondents had a similar age distribution: most (64.71 percent) were between 41 and 60, while 25.49 percent were below the age of 41 and 9.8 percent were above the age of 60.
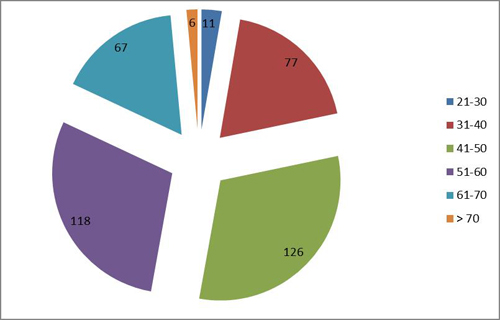
Figure 2. Age distribution of survey respondents
Table 1 shows the respondents' reported educational levels. Most faculty respondents held terminal degrees: 66.67 percent reported having a doctoral degree, 32.2 percent a master's degree, and 1.13 percent a bachelor's degree as their highest educational level attained. The IT leader respondents reported the following educational levels attained: 1.96 percent held associate's degrees; 29.41 percent held bachelor's degrees; 50.98 percent held master's degrees; and 17.65 percent held doctoral degrees.
Table 1. Educational Level of Survey Respondents
|
Affiliation |
Education Level |
|||
|---|---|---|---|---|
|
|
Associate |
Bachelor |
Master |
Doctorate |
|
Faculty |
0 |
4 |
114 |
236 |
|
IT Leaders |
1 |
15 |
26 |
9 |
|
Total |
1 |
19 |
40 |
245 |
The survey solicited open-ended responses from participants regarding their perceptions of CSFs for technological innovation, adoption, and diffusion in higher education. I defined CSFs for survey participants as those limited number of things that help ensure the success of a particular effort — in this case, technological innovation, adoption, and diffusion. I also gave participants an example of CSFs to help clarify the concept.
I asked participants to provide a list of the top five CSFs used to support technological innovation, adoption, and diffusion in higher education based on their experience and perceptions. The 405 survey respondents listed a combined total of 1,944 CSFs, which equated to 4.8 items per respondent. I entered the 1,944 individual items into a spreadsheet and sorted them alphabetically to produce an initial grouping of similar terms. The sorted data was manually coded to look for emergent patterns and themes.
Johnny Saldana defines a code in qualitative inquiry as "a word or short phrase that symbolically assigns a summative, salient, essence-capturing, and/or evocative attribute for a portion of language-based or visual data."11 I used a thematic analysis approach to complete the coding process. Gary Shank defined thematic analysis as a process of analyzing and coding qualitative data by searching for patterns that "emerge" when "observations pile up."12 Here, thematic analysis revealed key terms within phrases that helped me categorize the data. For example, the phrases "money for purchase of needed hardware and software," "provide necessary funding for innovation and research," and "provision of resources and materials," as well as the items "funding," "money," and "resources," all related to the availability of funding or resources and were categorized as the "Resources and financial support" CSF. Similarly, phrases such as "great help," "high level of IT support," "IT assistance," and "flexible IT staff that know about new technology and are willing to implement it and support it" were all categorized into the "Skilled technical support" CSF.
I systematically reviewed and categorized all 1,944 items reported into 17 individual CSFs (see table 2). To control for researcher bias and ensure the coded data's trustworthiness, I gave the listing of categorized items to three peer reviewers for feedback and validation. I also performed member checking through follow-up interviews with randomly selected survey participants to further validate the categorized data. I then compiled and ranked the listing of categorized CSFs based on the number of times each item was reported by the combined group, sorting the CSFs from highest to lowest accordingly. Table 2 shows the overall ranking of the CSFs: "Technology/infrastructure" was the median CSF, with eight items reported more often and eight items reported less often. "Professional development and training" was the most reported item overall, identified by 265 of the survey respondents. The least reported CSF was "Cost efficiency," reported by only 35 of the respondents.
Table 2. Critical Success Factors Identified by Survey Respondents
|
Ranking |
Critical Success Factor |
Frequency Reported |
|---|---|---|
|
1 |
Professional development and training |
265 |
|
2 |
Executive- and administrative-level support |
188 |
|
3 |
Skilled technical support |
168 |
|
4 |
Stakeholder involvement |
160 |
|
5 |
Skill level and commitment of faculty/students |
139 |
|
6 |
Innovative culture/collaborative environment |
133 |
|
7 |
Resources and financial support |
131 |
|
8 |
Incentives/rewards/time for innovation |
116 |
|
9 |
Technology/infrastructure |
107 |
|
10 |
Perceived value/addresses need |
102 |
|
11 |
Ease of use |
96 |
|
12 |
Quality, reliability, and flexibility of technology |
80 |
|
13 |
Proven effectiveness |
72 |
|
14 |
Strategic planning and governance |
55 |
|
15 |
Project management |
51 |
|
16 |
Enhances teaching and learning |
46 |
|
17 |
Cost efficiency |
35 |
|
Total |
1,944 |
In addition to calculating totals for the combined group of faculty and IT respondents, I tabulated separate counts based on how often each CSF was reported by each group (see table 3). When examining the data from the faculty's perspective, a slightly different picture emerges compared to that of the combined data. In table 3, CSFs that rank in the top five as reported by faculty and IT leaders are shaded, and the rank is displayed in bold. Faculty listed "Professional development and training" most often, while the top CSF for IT leaders was "Executive- and administrative-level support." Four out of five of the top CSFs listed by both groups are the same: "Professional development and training," "Executive and administrative-level support," "Stakeholder involvement," and "Skill level and commitment of faculty/students." Faculty also reported "Skilled technical support" as one of the top five items required for successful technological innovation and diffusion, while IT leaders reported the "Resources and financial support" CSF to round out their top five.
Table 3. Critical Success Factors as Reported by Faculty and IT Leaders
|
Critical Success Factor |
Faculty Reporting |
Faculty Rank |
IT Leaders Reporting |
IT Leaders Rank |
|---|---|---|---|---|
|
Professional development and training |
240 (14.1%) |
1 |
25 (10.2%) |
3 |
|
Executive- and administrative-level support |
151 (8.9%) |
3 |
37 (15.1%) |
1 |
|
Skilled technical support |
157 (9.2%) |
2 |
11 (4.5%) |
13 |
|
Stakeholder involvement |
133 (7.8) |
4 |
27 (11.0%) |
2 |
|
Innovative culture/collaborative environment |
121 (7.1%) |
6 |
12 (4.9%) |
10 |
|
Skill level and commitment of faculty/students |
122 (7.2%) |
5 |
17 (6.9%) |
5 |
|
Resources and financial support |
112 (6.6%) |
7 |
19 (7.8%) |
4 |
|
Incentives/rewards/time for innovation |
105 (6.2%) |
8 |
11 (4.5%) |
12 |
|
Technology/infrastructure |
103 (6.1%) |
9 |
4 (1.6%) |
14 |
|
Perceived value/addresses need |
90 (5.3%) |
11 |
12 (4.9%) |
11 |
|
Ease of use |
92 (5.4%) |
10 |
4 (1.6%) |
15 |
|
Quality, reliability, and flexibility of technology |
65 (3.8%) |
12 |
15 (6.1%) |
8 |
|
Proven effectiveness |
55 (3.2%) |
13 |
17 (6.9%) |
6 |
|
Strategic planning and governance |
39 (2.3%) |
15 |
16 (6.5%) |
7 |
|
Project management |
38 (2.2%) |
16 |
13 (5.3%) |
9 |
|
Enhances teaching and learning |
44 (2.6%) |
14 |
2 (0.8%) |
17 |
|
Cost efficiency |
32 (1.9%) |
17 |
3 (1.2%) |
16 |
Of the 405 people who responded to the survey, 158 volunteered to participate in follow-up interviews. I asked those survey respondents — 144 faculty and 14 IT leaders — to provide contact information through a separate survey mechanism; this information included name, institution, affiliation, e-mail address, and phone number. I collected and stored this identifying information separately from the survey responses to ensure that no individual could be directly associated with the responses they provided to the initial survey questions. I sorted the contact information based on affiliation and stored it in two separate Excel spreadsheets: one for the 144 faculty members and another for the 14 IT leaders. I then randomly selected two faculty members and two IT leaders from each list using Excel's MRAND function and sent e-mails to the four individuals to request and confirm their availability for an interview.
Interviews were conducted to validate the survey results, solicit additional feedback, and incorporate a feedback loop to gain insight into the CSFs reported by survey respondents compared to those identified in related literature. Each of the interview participants confirmed that the CSFs identified in the initial survey were expected. When asked if the survey-identified CSFs accurately represented their thoughts, each participant agreed with the individual items, but not necessarily with their ordinal positioning. I then asked them whether there were CSFs that they thought were missing from the list or that were present but unexpected based on their previous experiences and readings. Overall, the interview participants agreed that the list of CSFs identified seemed comprehensive.
According to the data collected from the survey, I found that the faculty and IT leaders had similar beliefs regarding CSFs for technological innovation, adoption, and diffusion. Each of the 17 factors was reported by both faculty and IT leaders as a critical success factor for technological innovation; however, the incidents of occurrence varied. The information collected from the survey was further substantiated by the follow-up interviews.
The CSF Innovation Model
Based on this research, I created a CSF Innovation Model to help illustrate the CSFs for technological innovation in a higher-education environment (see figure 3). The model incorporates the 17 CSFs for technological innovation and diffusion identified by the survey respondents. It begins with the highest-ranking CSF (the darkest shaded portion) and rotates clockwise as the number of occurrences for each CSF decreases. The size and shading associated with each CSF decreases with the decreasing number of responses, so the lowest-ranking CSF is the lightest shaded portion. The model provides a practical illustration for universities to use when focusing on technological innovation and emphasizes the many considerations they face regarding the adoption and use of innovations.
Figure 3. Critical success factor innovation model
The two groups studied have differing responsibilities, and the CSFs they identified affect them in different ways. Faculty members are primarily responsible for fulfilling the university's teaching mission and, as a result, are heavily affected by technological adoption. Faculty members are responsible for making technological innovations work in the classroom and using them to develop or enrich course content. Additionally, faculty incorporate technology into their courses to enhance the teaching and learning process, rather than drain resources and create additional work. In contrast, new technology adoptions impact IT leaders because their departments are typically required to support the new system, integrate it with other campus systems, ensure security of data transmissions, and so on.
Further, an innovation decision made by one group can have a broader impact on other constituent groups on campus. For instance, planning groups are often charged with making decisions regarding innovations for classroom use that impact faculty members, IT leaders, students, and others who use, implement, support, and/or provide or receive training for the system. When a faculty member decides to adopt a new innovation for classroom use, other groups might have to consider the funding or support implications. By focusing on the CSF Innovation Model components individually and collectively, universities can better understand and help meet the needs of multiple constituent groups.
Conclusions
Technological innovation requires an investment in time, money, infrastructure, and other resources. As technological innovation efforts continue to progress, the investment most universities devote to these endeavors continues to expand. To meet these growing demands, it's increasingly important for universities to encourage efficiency and use their resources effectively. The information collected from this study provides a better understanding of technological innovation, adoption, and diffusion from the perspectives of two key campus groups, faculty and IT leaders, and can assist in enhancing planning and governance processes surrounding innovation. Effective use of the information and insight gained from this study might help increase the likelihood of successful innovation efforts on university campuses.
University leaders can use the study's findings to enhance their innovation efforts by focusing on and developing initiatives that address the concerns of faculty and IT leaders during initial planning processes. Understanding what is pertinent to each constituent group will assist with resource allocation and securing buy-in and support. Understanding what is least important to each group will help identify areas that need further research, communication, and/or elucidation to elicit the necessary support and involvement. Also, identifying CSFs that faculty and IT leaders agree on provides opportunities to gain synergies and create partnerships that let the two factions work together toward a mutual goal while recognizing their differences. Identifying factors on which faculty and IT leaders disagree gives university leadership opportunities to provide avenues for information sharing.
Although I developed the CSF Innovation Model based on feedback from higher-education faculty and IT leaders, students are also impacted by items the factors the model depicts. Students are key to any university's mission and should be considered when pursuing new innovations. The model's CSFs can relate to students directly or indirectly. For instance, students are directly affected by how easy a particular innovation is to use and whether it enhances the teaching and learning process. However, the cost or level of project management associated with an innovation will affect them indirectly, if at all. Future research here might expand this study to include student feedback and/or use the study's findings to inform case studies at individual higher-education institutions with a focus on determining the most critical factors for a specific institutional context.
- Sang-Chee Tan, "School Technology Leadership: Lessons from Empirical Research," Australian Society for Computers in Learning in Tertiary Education Annual Conference, 2010, pp. 891–895.
- Susan C. White and Theodore S. Glickman, "Innovation in Higher Education: Implications for the Future," New Directions for Higher Education, vol. 137, 2007, pp. 97–105.
- Ibid, p. 97.
- Bret L. Ingerman and Catherine Yang, "Top-Ten Issues 2011," EDUCAUSE Review, May/June 2011, pp. 24–40.
- Yu-Mae Wang and Jerry Patterson, "Learning to See Differently: Viewing Technology Diffusion in Teacher Education through the Lens of Organizational Change," Journal of Educational Technology Systems, vol. 34, no. 1, 2006, pp. 69–82.
- Trent Batson, "Innovation in Higher Education It's Not the Technology," Campus Technology, June 10, 2010, pp. 1–3.
- Ibid, p. 1.
- John F. Rockart, "Chief Executives Define Their Own Data Needs," Harvard Business Review, March-April 1979, pp. 81–93.
- Wing Lam, "Investigating Success Factors in Enterprise Application Integration: A Case-Driven Analysis," European Journal of Information Systems, vol. 14, no. 2, 2005, pp. 175–187.
- David Garson and Shannon H. Schelin, IT Solutions Series: Humanizing Information Technology: Advice from Experts, IGI Global, 2004.
- Johnny Saldana, The Coding Manual for Qualitative Researchers [http://www.sagepub.com/booksProdDesc.nav?prodId=Book237888], Sage Publications, 2013, p. 3.
- Gary D. Shank, Qualitative Research: A Personal Skills Approach, 2nd edition, Merrill Prentice Hall, 2006, p. 148.
© 2014 Wayne Dennison. The text of this EDUCAUSE Review Online article is licensed under the Creative Commons Attribution-Noncommercial-No derivative works 4.0 license.