
Key Takeaways
- To harness visualization's increasing utility in new disciplines and departments, the University of Maryland launched a Campus Visualization Partnership between researchers and its central IT division.
- The CVP's initial projects included both a lecture series and an electronic presence to publicize projects, events, and campus experts.
- CVP also started a popular matching seed-grant program that offered up to $7,500 in matching funds to purchase new hardware.
- The positive response to these early projects has shown the power of collaboration and a modest budget to raise visualization's profile across an institution.
At the University of Maryland Fran LoPresti is deputy CIO, Division of Information Technology; Jay Elvove is project manager in the Division of Information Technology; Ben Shneiderman is Distinguished University Professor, Department of Computer Science; and Amitabh Varshney is a professor in the Department of Computer Science and director, UM Institute for Advanced Computer Studies.
Interest in visualization is growing, as evidenced by the flourishing conferences, thriving journals, and increasing commercial success stories of widely used tools such as Spotfire and Tableau. Enabling wider circles of scholars and students to use these new tools could bring substantial improvements to research, teaching, and learning.
Researchers with a visualization specialization recognize the remarkable power of contemporary visual analytics technologies, but adapting that value proposition to appeal to diverse disciplines in which visualization is not the norm has proved difficult. However, as the use of sensor nets, mobile devices, and social media continues to grow across disciplines, visual analytics' ability to show hidden patterns in structured numeric or network data, as well as more complex textual or multimedia data, will increasingly be valued across campus.
Our intention in forming the University of Maryland (UM) Campus Visualization Partnership (CVP) was to
- showcase the use of visualization in diverse disciplines via a lecture series;
- provide an electronic presence for collecting and posting ongoing projects, seminar opportunities, and visualization expertise on campus; and
- offer matching seed grants for small-scale hardware to explore visual display of discipline-specific data.
Our ultimate goal is to become a national role model for academic transformation by integrating visualization into research and teaching.
CVP Roots
The university approved an Information Technology Strategic plan in 2013. One of the areas of focus in that plan was to pursue a holistic approach to research computing, including visualization. In November 2013 we convened an organizational meeting of 30 enthusiastic colleagues from across campus. We introduced attendees to the vibrant activities of isolated campus groups, each of which had discovered the value of visualization independently. The existing efforts in medical, astronomical, chemical, fine arts, transportation, and other fields provided inspirational examples of what could be done on campus by colleagues who were seen as realistic role models. In figure 1, for example, campus researcher Scott Dempwolf explores his economic development data using NodeXL, a free network visualization tool developed with UM participation, and a new visualization workstation with a 16 megapixel display, acquired through the CVP Seed Grant.
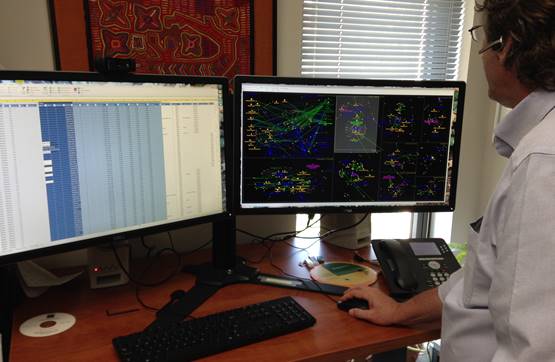
Figure 1. Scott Dempwolf explores a visualization of his economic development data.
As a result of that meeting, we formed the CVP, a partnership between the Division of Information Technology, UM's central IT organization, and representatives from multiple colleges; the goal was to promote visualization in both research and teaching.
A small steering committee directs CVP activities, while the IT division provides administrative support for the lecture series, website, publicity, and the matching seed-grant program. Because we formed a partnership that had the support of the president, provost, and Division of Research, the CVP was enthusiastically received by multiple disciplines, without parochial concerns about the lecture series and other activities.
Lecture Series
The goal of the lecture series is to promote awareness of both campus activities related to visualization and new visual analytic technologies. Grants from Yahoo! and Google support the series, and academic members of the steering committee recruit the speakers for it. The eight-session lecture series occurred during the spring 2014 semester. We also established a website for announcements.
The speaker series featured well-known presenters with an established track record. Two sessions showcased five campus leaders, while other talks were presented by diverse researchers and professionals from various institutions. The university's location inside the Washington Beltway helped attract government presenters from the U.S. Census and the Department of Energy. All presenters were invited to spend the day on campus so we could show them some of our ongoing efforts and they could meet with researchers and students.
The CVP Lecture Series: Speakers
"The University of Maryland's CVP lecture series was a key part of our initial effort to increase the profile of visualization across our campus. It not only had excellent attendance, but also led to additional collaborations among faculty groups who were unaware of each other's efforts.
Following are the speakers invited to participate in the Campus Visualization Partnership: Spring 2014 Lecture Series at UM.
- Introduction to Campus Visualization Partnership (CVP) Kickoff lecture/seed grant announcement
Fran LoPresti, Deputy CIO, Division of Information Technology, UM
Amitabh Varshney, Professor, Dept. of Computer Science, Director UM Institute for Advanced Computer Studies
Ben Shneiderman, Distinguished University Professor, Dept. of Computer Science, UM - Visualization Resources Across Campus: Showcase Projects and Facilities
Audra Buck-Coleman, Asst. Prof. of Graphic Design, Dept. of Art, UM
Quint Gregory, Assoc. Director, Michelle Smith Collaboratory for Visual Culture, UM
Michael L. Pack, Director, Center for Advanced Transportation Technologies Lab, UM - Visualization for Everyone [https://webmeeting.umd.edu/p3reoesa2i3?launcher=false&fcsContent=true&pbMode=normal]
Martin Wattenberg, Developer, Researcher, Google - Make Me Look! To SEE and Understand Your Research
Felice Frankel, Research Scientist, Center for Materials Science and Engineering, Massachusetts Institute of Technology (jointly organized with the UM Institute for Systems Engineering) - The Value of Data Visualization to the U.S. Census Bureau
Eric Newburger, Assistant to the Associate Director for Communications, U.S. Census - Visualizing the News
Matthew Ericson, Graphics Editor, New York Times - Visualization Metaphors: Old and New
Manuel Lima, Designer, Author of The Book of Trees and Visualizing Complexity - Data Intensive Science at Extreme Scale
Lucy Nowell, Program Manager, Advanced Scientific Computing Research, U.S. Dept. of Energy
Our Census Bureau speaker, Eric Newburger, was leading a similar effort to update his own staff's visualization capabilities. Although Census statisticians have a long, proud history of making maps and print-based charts, getting them to shift to interactive web-based visualizations requires substantial effort. Newburger described the Census Bureau's past contributions and showed how user-defined data sets supported exploration and insights allowing filtering or combinations of data. Active citizen, scholar, and journalist participation raises the value of Census products and promotes broad statistical literacy that could inform policy decisions.
Although UM has electronic classrooms, we held the series in the well-designed Arnold E. Seigel Learning Center, whose staff took care of high-quality livestreaming and web-based archiving of the talks. Campus-wide announcements spread the news about the lectures. Attendees had to sign up in advance with their e-mail addresses, which built our circle of e-mail contacts. Reservations were also required to manage the catered lunch for up to 58 attendees.
When we asked those present in the live classroom to raise their hands to indicate which of the 12 campus colleges they came from, the great diversity of attendees became clear. As expected, each lecture drew from different colleges, but some regulars attended every talk. Each event was filled to capacity, with a 60/40 split of students to faculty/staff (figure 2). Livestream locations varied from 6 to 17, while our on-demand viewing audience ranged from nine to 177 viewers.
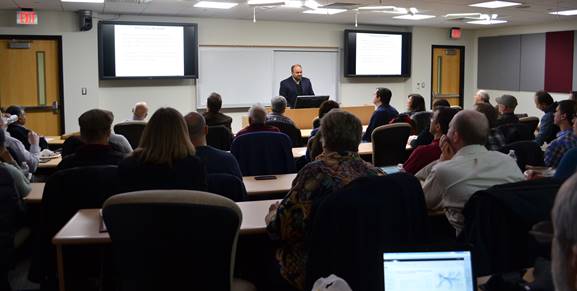
Figure 2. Each visualization lecture was filled to capacity.
Measuring Results
At the semester's end we sent an e-mail survey to 301 people who had registered for our lectures and received 76 replies (a 25 percent response rate). Respondents attended a mean number of 3.8 lectures. We asked them to rate their agreement with several statements on a 1 to 5 scale, where 1 was Strongly Disagree and 5 was Strongly Agree. More than 90 percent rated content level and relevancy to their work rated between Agree and Strongly Agree. Also highly rated were the lecture series' publicity, registration process (we used Eventbrite), facility, and technology. The most encouraging statistic? When we asked, "Would you recommend this lecture series to colleagues," the overall score was 4.5/5.
The survey also offered space for written comments; some respondents suggested speakers and topics for future lectures and a desire for more workshops and tutorials with hands-on tool use. The overall message was highly supportive, with strong encouragement to continue the lecture series — which we're planning to do for the 2014–2015 academic year.
A few quotes from the survey provide a good summary of the success of the lecture series. "I really enjoyed the series. I'm so happy that you covered such diverse disciplines. I'm very looking forward to next year!" and "These were delightfully informative presentations with very broad cross-campus range of interests. I can't imagine why faculty and staff wouldn't want to be involved."
Achieving Change
As change agent models make clear, once the desire for change is initiated, resources are required to make the change happen. At the organizational meeting, it was clear that faculty were enthused and wanted to pursue research in their particular areas but lacked the capital resources to begin the effort. To address this, we quickly arranged a small seed-grant program that required only a one-page proposal for up to $7,500 in matching funds to purchase new hardware. The key selection criteria were innovativeness, use by multiple projects, availability to present to visitors, and potential impact on research and teaching. The CVP convened an ad hoc panel to review the proposals. The award committee offered three grants, leading to prompt orders for large displays, high-resolution projectors, powerful desktop machines, and network connections to Deepthought2 [http://it.umd.edu/hpcc], UM's new high-performance computing cluster. This idea of "something small, soon" has already produced changes on campus, including a greater willingness to invest in visualization.
A longer term goal in achieving campus transformation is to expand the number of faculty and research staff who do research on or with visualization; CVP leaders were involved in the hiring of several faculty members for the fall 2014 academic year. Another long-term goal is to increase the number of courses on visualization and the inclusion of visualization in existing courses. Right now we are collecting information from our faculty on courses that have visualization components in them and creating a website of visualization experts on campus, their fields of study, and courses with visualization components.
Change agent models also stress the importance of recognizing those who have undertaken constructive initiatives. To this end, we plan to invite grant recipients to report on their use of visualization tools, write profiles of new research projects, and expand the circle of organizers for future lectures.
Conclusion
We know that campus-wide change will take many years, but we are heartened by our early progress and wiser in knowing what to do next. The CVP has shown that collaboration between central IT and the research community, along with a modest budget to support a lecture series, a matching grant program, and administrative support, is a good investment for introducing the UM campus to visualizations' vast potential to enhance research and teaching.
© 2014 Fran LoPresti, Jay Elvove, Ben Shneiderman, and Amitabh Varshney. The text of this EDUCAUSE Review online article is licensed under the Creative Commons Attribution-Noncommercial-No derivative works 4.0 license.