
Key Takeaways
- Budget cuts and increasing enrollments, coupled with legislative mandates that base funding allocations on student outcomes rather than headcount, are forcing the state of Tennessee to rethink management of its colleges and universities.
- Because funding affects all areas of the institution, performance needs to be measured across the enterprise to enable well-informed management decisions.
- The Tennessee Board of Regents successfully implemented a multi-institutional collaborative business intelligence project that cost-effectively delivers high-quality key performance indicators more quickly than if attempted by a single institution.
The adage "You can't manage what you don't measure" has a new twist: "You might not be funded for what you don't measure and manage." In 2010 the state of Tennessee passed the Complete College Tennessee Act (CCTA), which identifies performance measures by which all institutions in the state will be funded starting in 2012. Rather than providing funding based on enrollment headcount, the new outcomes-based funding formula provides the entire institutional allocation of state appropriations according to outcomes that include, but are not limited to, degree production; research funding and graduation rates at universities; and student remediation, job placement, student transfer, and associates degrees at community colleges. Rather than have each institution within the Tennessee Board of Regents (TBR) system research and implement the measurements, processes, and technology to meet this new funding formula, TBR took a collaborative approach that has involved seven institutions dedicating significant, ongoing resources and numerous other institutions providing input and testing.
TSU Builds BI Foundation
The TBR system consists of 6 universities, 13 community colleges, and 27 technology centers with a combined annual enrollment of more than 200,000 students and a budget of $2.2 billion, making it the nation's sixth largest system of public higher education. Fortunately, Tennessee State University (TSU) gave the system a head start on addressing the new funding formula through a business intelligence (BI) initiative it had begun several months earlier (see Figure 1).
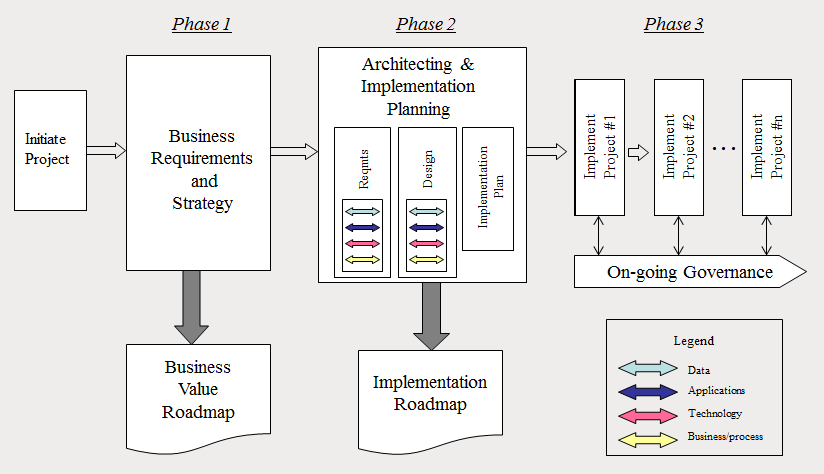
Figure 1. Phases for Implementing TSU BI Initiative
Led by Dennis Gendron, provost and executive vice president, TSU had developed a list of 140 key performance indicators (KPIs) that the administration wanted to track to measure its own institutional performance. KPIs are quantitative measures used to evaluate performance against expected results; they link objectives to measures and actions.
TSU developed its list of KPIs with extensive support from Deloitte Consulting over a three-month period. (For an overview of the process, see Figure 2.) After agreeing on the KPIs that cover areas including business, finance, alumni development, enrollment, faculty and staff measurement, graduation, quality of education, athletics, and more, the TSU IT team began building out the KPIs. The process involves starting with a clearly defined business outcome and then developing the quantitative or qualitative measures of the results against specific goals so that initiatives can be put in place to achieve the intended targets.
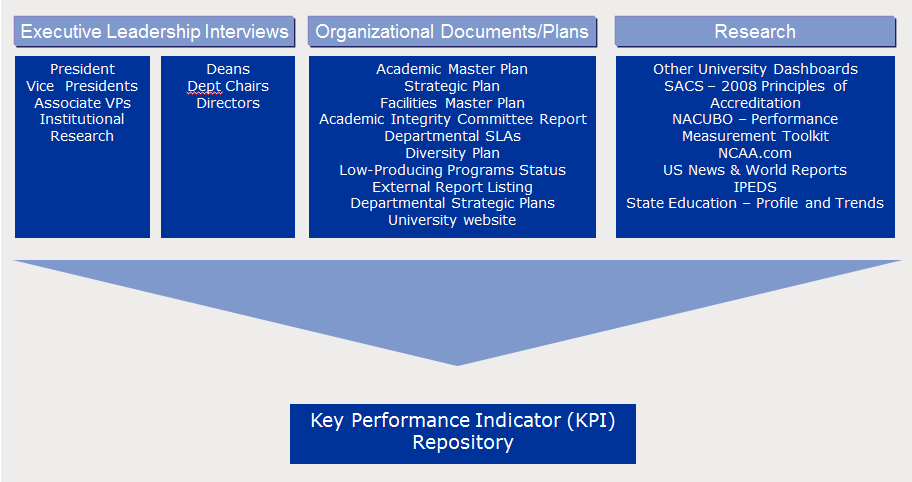
Figure 2. KPI Repository Methodology
Sharing Resources and Gaining Stronger ROI
When TSU presented its initiative at a TBR-sponsored IT conference, we (TBR staff Thomas Danford and Pamela Clippard) immediately saw the value of sharing resources in developing the KPIs to measure institutional performance and to gain stronger returns on investment of TBR's existing technology investments.
Just over four years ago, 17 institutions within the TBR implemented a SunGard Higher Education Banner Digital Campus that includes Banner as the student information system and the SunGard Operational Data Store (ODS), among other solutions. The TBR moved to a common platform to help improve organizational effectiveness, allocate resources more efficiently, and increase the breadth and quality of services to students. Under the model developed by TSU, we could mirror at any institution that wished to participate data extract, load, and transform (ETL) routines for the KPIs from Banner and the ODS, and then generate the KPIs and graphically display them in scorecards, dashboards, and other reporting tools, depending on the institution's choice of reporting software. Users would gain the capability of drilling down and slicing and dicing the data into multiple reports, giving their administration the ability to answer critical, executive-level questions.
The only prerequisites for participating are being a SunGard Higher Education Banner customer that also uses ODS and being committed to developing at least five KPIs within 90 days. As of July 2011, seven institutions are actively developing and using KPIs. An additional four institutions within TBR review, test, and refine the KPIs. Currently, 50 completed KPIs are available, with a goal to have the CCTA metrics complete by June 30, 2012. A list of the KPIs with the functional areas that are the focus of improvement is available in PDF format, along with some graphical examples.
Recruiting Volunteers
After we decided to make this a collaborative project, the first step was to recruit volunteers. Championing the initiative took considerably more time than expected. We attended TBR leadership quarterly meetings and numerous subcouncil meetings, traveled to campuses for presentations, and participated in system seminars and conferences. We continue to participate in all these meetings with the goal of recruiting more institutions to join the effort, as well as to share results. We also present at venues outside the TBR because the project would benefit any institution using Banner and ODS (see Figure 3).
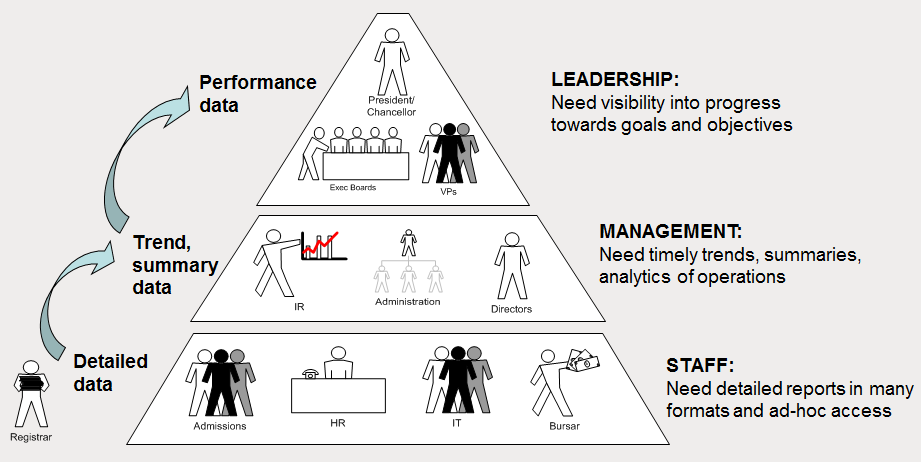
Figure 3. KPI Beneficiaries
Our strategy for recruitment has been to start with executive leadership because they have long understood the value of quantifiable measurements. If we're successful in selling them on the project, they in turn relay their enthusiasm to others at their institution, which can free up resources for participation. Building out a single KPI can take as little as three days to as much as three weeks to code, test, refine, and deliver and involves multiple steps (see Figure 4).
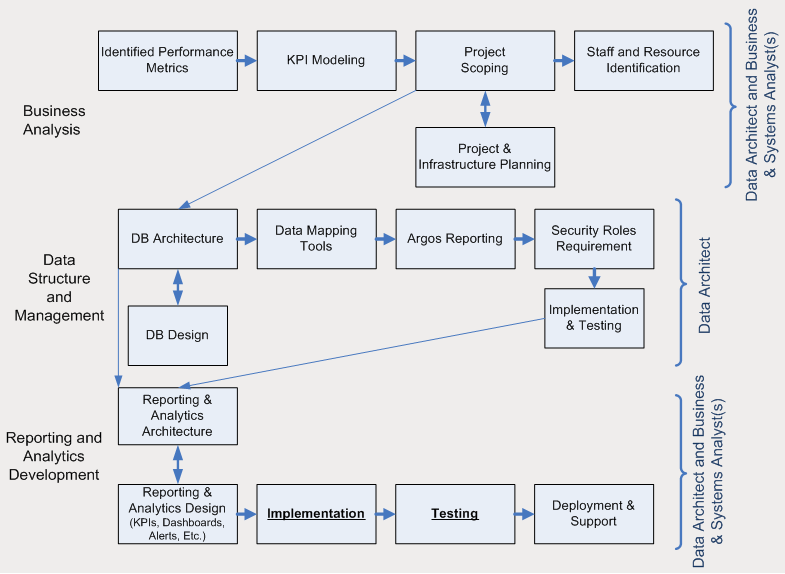
Figure 4. KPI Organizational Structure
It's interesting to note that some of our most productive and enthusiastic contributors are those from smaller institutions with limited resources. The more resource-constrained the institution, the more the executive leadership benefits from measurements to help make better-informed decisions.
Establishing Processes
Before other institutions could be brought into the process, we needed to build out some of the KPIs and think through the mechanics of the collaboration. Pamela Clippard of the TBR central office was designated as project manager for the entire initiative, which established a collaborative thread from the system IT office to the TBR institutions.
When a new institution volunteers to partner in the BI Initiative, BI team members visit the central office in Nashville for a BI boot camp. The BI team consists of the IT and functional users who will work together to develop the KPIs at their campus. The IT staff members write the performance metric queries, and the functional staff, as the subject matter experts, help determine the data sets necessary for the measures in the defined business outcomes. The quantitative and qualitative results of the KPI query are then put through substantial testing and documented.
Phone calls and web seminars follow the boot camp to explain the intricacies of the process and the future work. There are also bimonthly phone calls with all participating institutions. Training sessions are held every month through our Institutional Research office on a range of topics, including ODS function, data discovery, and reporting tools. Additionally, a TBR project wiki page shows which KPIs are currently available in the KPI inventory repository, as well as which KPIs have been assigned to which school. The wiki page also contains a BI project status report. Clippard makes it a point to stay in constant contact with each BI team. Providing resources and support as needed, and creating a team experience, are vital to maintaining the project's momentum.
If during a KPI development we need an additional subject matter expert to review or test the KPI content (for example, someone from Student Affairs), we can pull in resources from other TBR institutions. We work closely with them to ensure that all necessary elements are included and that we are filtering the data appropriately. In this way, many more of our institutions than just the core seven are involved. Tapping into the broad resources and knowledge available within the TBR is a great benefit of the collaboration that improves the quality of the KPIs. Similarly, we rally resources to address IT-related and strategic questions, such as how we can pull in data from an outside tool or cost study. Clippard and members of the TSU staff make on-site visits when hands-on resources are needed.
When an institution completes a KPI, it is sent to other TBR schools to test. This is a challenge, because the elements within a KPI will vary depending on the institution; what might be appropriate for a university might need some modifications for a community college. Before making a KPI available to the larger population, we make sure it requires minimum modification and that we document them and the steps to tailor the delivered code to meet the needs of individual institutions. If we did not take a collaborative approach, the resulting KPI might not meet the needs of all participating institutions. Also, documenting the process and the makeup of the elements behind the creation of the KPI is critical to ensure that we are comparing metrics across institutions and with like results. After testing, the final KPI is sent to the TBR office and then made available to institutions via the TBR wiki page.
Maintaining Momentum
As noted earlier, participation is voluntary; this requires extra effort to keep the process moving. Executive leaders clearly support this effort, and a strong core of participating institutions adds momentum and focuses attention on the project.
Ongoing strategies include promoting the project's progress, including a dashboard on the BI project itself, and we stress to each team how its institution will benefit. Personal satisfaction is also a strong motivator: We have assigned the toughest KPIs to our most talented coders because meeting the challenge can motivate each team. Simply saying "please" and "thank you" also goes a long way, as does showing appreciation for the commitment each campus is making and respecting each member's contribution.
Because the project relies on volunteers, we do not set a hard-and-fast deadline to have the KPIs completed, and we have been flexible with the 90-day deadline on commitment. When there might be a significant delay, we apply resources from the central office or other campuses to keep the KPI moving forward.
Another way we try to inspire continual progress is by publicizing the benefits of the KPIs as quickly as possible. For one of our first projects, we chose a KPI that shows every single course, along with the enrollment limit, actual student enrollment, and instructor information for each course. This KPI readily shows institutions where they might have underproducing courses. Identifying this type of strategic information delivers immediate return on investment by allowing campuses to redistribute resources effectively.
Collaborative Benefits Delivered
By working collaboratively, we have gained numerous significant benefits. They include:
- Realizing hard cost savings: Had this initiative gone out to a competitive bidding process, we estimate that the costs for a consultant-led KPI development effort would have been between $457,000 and $507,000. We also realized a cost savings in shared training on our reporting software. Initially we wished we had the budget to develop the KPIs, but in retrospect, it forced us to look at our resources and leverage our existing software capabilities. Our institutions already have Banner, an ODS, and reporting tools, and some have the SunGard Higher Education Luminis Platform.
- Distributing soft costs: The development of KPIs requires a significant investment in the form of technical and functional staff members who code and test the KPIs. Distributing the workload among multiple institutions ensures that no single institution is overburdened by the level of effort. Also, the technology involved has a steep learning curve. By working collaboratively, we leveled that curve at participating institutions as they joined the project.
- Speeding development: With multiple institutions working on the project, KPIs can be developed in parallel instead of serially, reducing the time to completion.
- Improving KPI quality: Involving multiple institutions in the effort enables management to identify and recruit the most talented staff members to build out selected KPIs (for example, an institution with exceptional financial staff would be assigned financial KPIs). Additionally, with multiple institutions, more technical and functional experts are available to poll and seek help from when issues arise, and more testers ensure better quality control. Multiple contributors give us fresh eyes to identify any gaps in the analysis of the performance metrics (for example, one of our institutions identified an additional five to eight metrics to be added to the human resource KPI list).
If the TBR had not initiated this project in a collaborative fashion, some institutions might have started their own BI initiatives or continued measuring outcomes as before. Collaboration moved them away from individually reinventing KPIs to a more effective and better-defined method of measuring institutional performance. Overall, the collaboration has had a far-reaching and positive cascade effect.
Establishing Measurement as an Executive Priority
Unlike most software projects, which address the particular needs or requirements of specific business needs or processes, TBR's all-encompassing BI project affects institutional leadership and management. It enables multiple participating institutions to address issues related to their functional investment portfolios and strategies, and even employee performance. Perhaps the most significant impact will be in sending the message that measuring performance and outcomes, along with accountability, has become an executive priority for the TBR and its institutions. That alone would be a significant achievement.
The effectiveness and value of our BI project has increased tenfold by making it collaborative. The additional talent and new perspectives are increasing the quality and quantity of valuable metrics that can be used by participating institutions, much more cost-effectively and quickly than any one institution could do on its own.
© 2011 Thomas Danford and Pamela Clippard. The text of this EQ article is licensed under the Creative Commons Attribution 3.0 license.