
Key Takeaways
- Offices of information technology should use multiple metrics and data collection tools to determine the needs of various stakeholders at their institutions.
- Best practices for surveying stakeholders include ensuring survey salience, using multiple contacts, creating an applicable sample frame, personalizing messages, and using prepaid incentives.
- The implementation of research-based best practices can result in dramatic improvement of response rates for web-based surveys and provide a base of trustworthy data that IT professionals can consult in making decisions about IT on campus.
An office of information technology at any institution of higher education must not only maintain and extend operations and services but also innovate. Under budgetary pressures current and future, goals for support and visioning face increased scrutiny and a demand for return on investment. Decisions, therefore, must be made based on a careful accounting of an organization's needs — the gap between "what is" and "what is not." Because IT staff serve constituents with a wide range of needs, however, these needs are not always easily identified.
The 2008 IT budget of a midsize state university on the East Coast, shown in Figure 1, demonstrates the amount of money at stake, even though the $2.1 million budget is modest compared to the budgets of larger institutions. Decisions about where and how much money to spend cannot be left to traditional models or "gut feelings." A solid understanding of needs, however conceptualized, is the critical first step in providing an IT office with data crucial for sustainable innovation, as well as helping it solve and forecast problems.
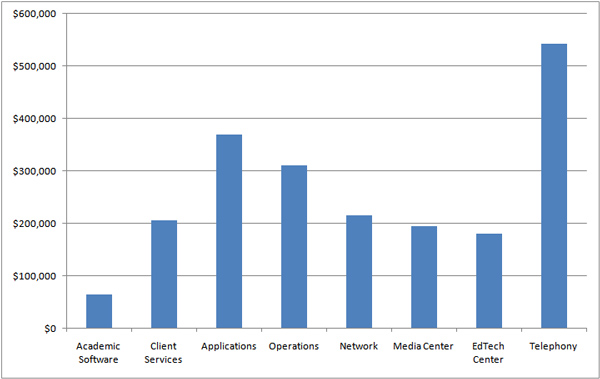
Figure 1. A Midsize University's Annual IT Budget
An Imperative for Data-Driven Decision Making
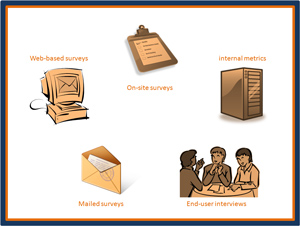
Capturing the data that help define faculty, administrative, and student needs is but one of the many critical functions of IT professionals. Any number of means can be employed to gather the data, including physical equipment inventory, software metrics, community forums, and surveys. However, the survey, particularly the web-based survey, presents something of a problem for many public universities and colleges. While they are relatively easy to make and distribute, survey response is typically weak. Research actually shows a decline in response rates for surveys of all kinds over the past dozens of years.1 The paucity of feedback from such low response rates seems to encourage "guess-based decision making" more than data-driven decision making. So, even before an IT office can go about determining needs, it faces the problem of trying to elicit responses in a manner that is not as enthusiastically received as many would hope.
This article provides advice about survey administration based on findings from the literature as applied to an empirical survey study conducted at Boise State University. The results of the survey gave university IT officials important data about student use and perceptions of campus IT resources, particularly its campus-based computer labs and other support mechanisms. More importantly, the evidence seems to illustrate that adherence to research-based "best practices" can increase response rate for web-based surveys. The survey was administered electronically; no printed materials were used to advertise it, solicit participants, gather responses on campus, etc. The overall response rate exceeded even the most optimistic estimates of those involved with its creation and oversight. A total of 46.3% of students (n = 739) opened the survey, and 45.6% (n = 728) completed it — nearly triple the average reported response rate for other web-based campus surveys (see Figure 2).
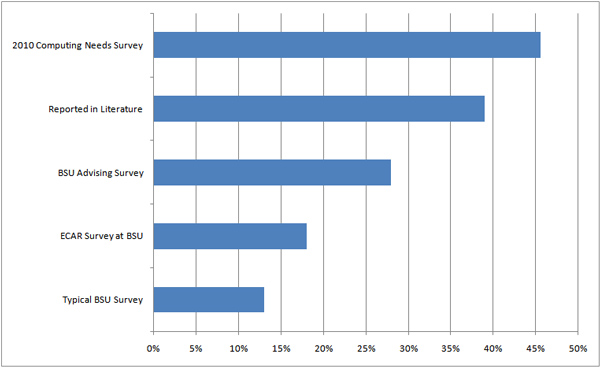
Figure 2. A Comparison of Response Rates for Surveys at Boise State University
Research-Based Best Practices for Survey Administration
A critical goal of survey administration is to increase the credibility of results,2 which can be done in a variety of ways. A number of interventions have been investigated with regard to increasing response rate. Those shown to make a significant difference in response rates include:
- Using incentives3
- Increasing the number of contacts with participants4
- Personalizing invitations5
- Crafting invitation messages with skill, which takes into consideration the trustworthiness of the sender6
However, none of these interventions, by itself, trumps the others with regard to effectiveness, and conflicting reports of effectiveness exist. Therefore, researchers recommend a multifactorial solution to yield better response rates for web-based surveys.7 Some of these interventions are not possible in every instance, but such decisions depend largely on the setting in which the survey is developed and given.
Research on the effectiveness of web-based or electronic surveys is conflicting. In one meta-analysis of web surveys,8 response rates averaged 39.6 percent. Another study9 found that of a variety of survey types, a web-based needs assessment resulted in a similar rate of response. The literature does not seem to suggest that response rates of college student populations would differ from those of the general population,10 yet looking at response rates from some national collegiate surveys,11 response rates are a good deal lower, especially at public institutions. Some reports show that electronically administered surveys — a favorite of many university officials given the ease with which they can be produced, sent, and used to automatically collect data — show consistently lower response rates than other forms of surveys.12 But this too is contested, because depending on the content, web-based surveys are actually shown to increase response rates, at least among college students.13 In a different meta-analysis, researchers14 found that web-based or electronic means of administering surveys actually increase response rates. While the mechanism used to communicate the survey — web, e-mail, phone, or other — is important, it cannot be used as the sole factor for increasing participation. Instead, other measures must be taken, as follows.
Quick One-Question Survey 1
Of the various aspects of IT listed, where do you believe user-feedback
would be most helpful for your institution or organization?
The Application of Best Practices
At Boise State University, survey response rate has been a serious concern; the average rate is reported to be 12–20 percent.15 The participation rate of the ECAR survey for its study of undergraduate students, conducted at the university in 2009, was 18 percent. Participation in student advising surveys historically has been higher, but it is the exception rather than the rule. The advising surveys tend to be hybrid, and participation is verbally encouraged by advisors with whom the students have regular contact. The typically low response rate to our surveys motivated us to follow the leading "best practice" guidelines for survey administration. Since decisions about campus-based technology resources would be based on the data, it was important to gather as much input from students as possible. The impetus for the study, then, was to see what kind of response rate was possible under optimal conditions. One area not addressed in this particular survey was using research-based practices on the page layout or selection of question type (multiple choice versus sliders, number of questions per page, etc.). Note, though, that content validity was important, and below I explain our attempts to ensure it.
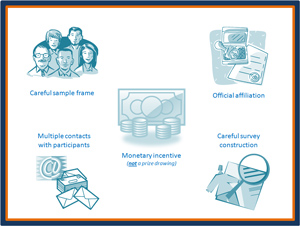
The attempt to garner wider participation from university students resulted in a focus on the following aspects of research-based best practices for survey administration:
- Ensuring that the sample frame includes likely stakeholders
- Creating multiple contact opportunities with selected participants
- Crafting a survey that only includes questions germane to the actual topic
- Using prepaid monetary incentives
- Establishing a trustworthy message
- Personalizing the messages
The hypothesis was that these steps together would result in a higher response rate. Each of the steps is explained below as it applies to the study reported here.
Refining the Sample Frame
Survey research is consistent in its acknowledgment that response rates increase as respondents' affinity to the message increases. No amount of message crafting can make a student who would never use a particular service decide to complete a survey (unless deceit was employed, which introduces a host of other issues). It is thus incumbent on those administering the survey to ensure that the people receiving the message are those most likely to be affected by the issue under investigation. In the case of this study, we knew that the students most likely to use the campus-based labs fit a certain profile. Thus, at our request, the staff member at the institutional research office applied a number of filters to ensure a sample that represented those who could actually be considered stakeholders from among the university's total of just over 18,000 students in spring 2010. Given the plan to use a prepaid incentive, it was not economically feasible to credit the entire student body with the funds. Beyond the actuarial consideration, however, was the fact that a sufficient response from a true random sample would allow for the most accurate portrayal of campus IT needs.
Students in the sample frame had to be:
- 18 years of age and older
- Degree-seeking students (initial or second degree)
- Classified as a freshman, sophomore, junior, senior, graduate student, or second degree–seeking student
- Taking at least one three-hour course on the main campus
- Not previously oversampled for survey participation
The filters resulted in a sample frame of nearly 11,000 students. From this narrower, more appropriate frame, a random sample of 1,600 students was generated by a staff member in the university's Institutional Assessment office using standard random sampling techniques. An inspection of the sample showed that student demographics were consistent with those of the university's student population.
Prepare Multiple Contacts
Another clearly stated best practice in survey administration is to ensure multiple contacts with participants. Researchers typically recommend presurvey notification, a link to the survey, and reminder messages.16 In our survey, all participants were sent an "alert" survey that informed them of an upcoming survey and provided details about the monetary incentives. Participants then received an e-mail with the survey link approximately 10 hours later. Three reminders were sent in total: three days following the initial solicitation; five days following the first reminder; and one week after the second reminder (nearly two weeks after the initial reminder), which happened to fall on a day during spring break. No student who had completed the survey received a follow-up reminder, only those who had not yet opened the link. The survey was closed to input approximately four weeks after it was opened (by that time, responses had significantly tapered). Students who completed the survey received a final thank-you message with details about the random prize drawing.
Of the total completed responses, 56.2 percent (n = 416) were submitted following the initial solicitation and before the first reminder. The first reminder note, sent three days after the initial e-mail, resulted in an increase of 181 responses, or 24.5 percent of the total completed responses. The second reminder was sent eight days after the initial e-mail, meaning that within approximately one week, more than 81 percent of the total completed responses had been collected. The second reminder e-mail brought in another 91 responses (12.3 percent of total), increasing total percentage of responses received to 93 percent by the end of the second week. The final reminder message, sent on the third day of the 2010 spring break, saw a final 41 responses (5.54 percent of the total). Just 11 students (1.5 percent) opened the survey but failed to complete it. Figure 3 shows the survey responses within each message wave.
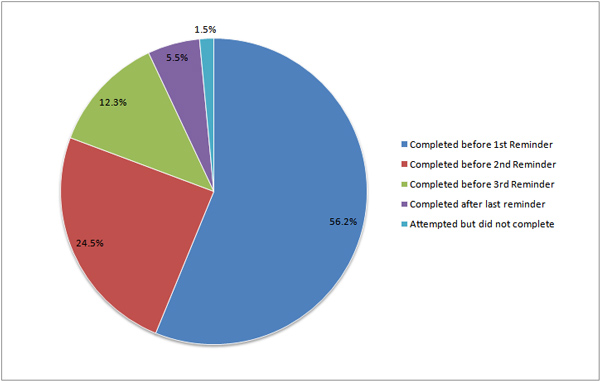
Figure 3. Percent of Total Responses by Message Wave
Creating Surveys Carefully
In the end, response rates only matter if a participant has actually completed the survey. Survey research shows that participants are more likely to complete a survey if they perceive that the questions are salient and if the survey does not impose too much of a load on their time. For web-based surveys in particular, the navigation must not frustrate the user. Since our survey instrument was created "from scratch," it was important to ensure its content validity at the very least. To do so, a number of drafts underwent various formative evaluations. An example of those steps included:
- The oversight committee, which included staff from Information Technology, provided input and feedback about type and wording of questions.
- Subsequent drafts were then reviewed by a university staff member with expertise in survey data analysis.
- A one-to-one formative evaluation with a university student was conducted on a "pre-final" draft.
- A small group formative evaluation was conducted by a small group of student volunteers.
- The survey questions were reviewed by an administrator in the Student Affairs office.
In the end, the survey included questions deemed most salient to the topic. A number of demographic questions were eliminated because we could access that information via university databases and merging it with the data collected. The survey mandated responses on 31 total items, but with logical branching, a student might have been asked to answer up to 40. Because only 11 students failed to complete the survey (and of these, two completed nearly all of the questions), we deemed the survey not to have caused much inconvenience. The average time needed to complete the survey was approximately 15 minutes, as predicted based on the small group evaluation results.
Implementing Incentives
Though the amount and type of incentives17 used are the subject of debate in the survey research community, there is near unanimous agreement that prepaid incentives consistently produce higher response rates, and the more that is paid correlates directly to the rate of response. Even modest amounts can have a significant impact on response rates. Some hold the unfortunate assumption that money alone will increase response rate. Based on all the research on survey administration in general, and on incentives in particular, we know this not to be the case. Deciding to use a monetary incentive should not give anyone an excuse for not giving close attention to all other aspects of survey development.
In most research done on prize drawings (for example, random drawings to win $100), the impact of lottery incentives on response rates proved negligible. Using randomly drawn prizes does not decrease participation but also does little to increase it. Participants want immediate and tangible rewards, not a delayed or low chance of reward. Even though drawings are not a best practice, students who completed the spring 2010 survey at Boise State became eligible for a $250 prize drawing following the survey. We included this additional reward at the request of some of the survey collaborators who thought that since the point was to maximize conditions to increase response rate, it could not harm and might help.
Not all agree with the use of incentives despite literature that clearly shows it has a positive impact. Some reasons are based on straightforward actuarial and logistic concerns, such as not having enough money in a budget to cover the cost or not having a way to easily implement a prepayment plan. Other concerns are more philosophical in nature and, though valid, cannot be addressed within the scope of this article.
For the survey on student computing needs, the randomly selected participants each received a $5 payment, electronically added to their BroncoCard accounts. All told, the final cost was around $8,300. The monies used to pay for the survey came from a surplus account built from previously collected student technology fees. The cost was a fraction of the overall IT budget, and the survey provided information that became quite helpful in informing decisions made by IT over the course of the next year.
Quick One-Question Survey 2
How do you typically collect information related
to IT needs or use?
Establishing Message Trustworthiness
Another best practice based on survey research focuses on the issue of trustworthiness. Respondents who see names and organizations that they do not recognize are much less likely to respond to questionnaires. To establish trustworthiness, we instituted these procedures:
- All notifications were sent via an e-mail address with the Boise State domain name.
- The prefix of the e-mail address was a specially created account with the acronym of the oversight committee.
- All messages had as a final line that they had been approved the Office of the Vice President of Student Affairs.
- The e-mail was signed with a committee title name, as this looked more official.
- A single web page, created on the university's domain, provided information about the survey. The page was linked from the solicitation messages, reminder messages, and the front page of the survey itself.
- I personally responded to any inquiries by students about the survey
- The URL for the university's survey software included the university name (http://www.qualtrics.com/academic-solutions/boise-state-university).
Creating Personalized Messages
An important aspect of increasing response rates is ensuring personalization of the solicitations to potential respondents. Considering the capabilities of various web-based survey mechanisms, especially the ability of the university-based surveyors to use institutional databases, makes possible a good deal more personalization.18 Thus, taking advantage of the student demographic information stored in the university database, and due to affordances of the university's subscription to a web-based survey tool (Qualtrics), it was possible to create a spreadsheet with data that would be merged into the survey itself, as well as into any messages sent to students (see Figure 4). The demographic data allowed for the use of each student's name, major, department, level in school (sophomore, junior, etc.), and status (undergraduate, graduate, etc.). The messages always included the student's first name in the message, and selected messages contained other bits of information.
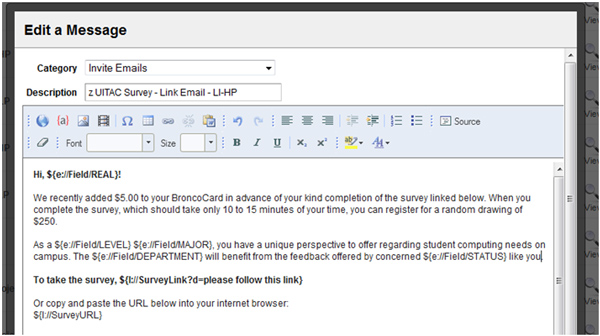
Figure 4. A Screen Capture Showing Part of One Solicitation Message Crafted for the Survey*
How much personalization is necessary? That remains an open question, as one must strike a balance between making the respondent comfortable with the fact that the organization "knows" him or her and appearing to breach boundaries. In our survey, it became clear that a high degree of personalization required a great deal of time; it is probably sufficient to simply include the recipient's name in messages. Another advantage that the database provides in addition to personalization is avoiding demographic questions, which reduces the time burden on the respondent.
Does Response Rate Really Matter?
Is there really a difference between what 43 percent of a sample would say versus what 18 percent might say? After all, some might think that in the end this difference is not terribly important. The full answer to questions about the impact of nonresponse is nuanced.
The primary challenge faced by survey administrators is to reduce sources of survey error as much as possible. It is beyond the scope of this article to address these sources in detail, but there are two pertinent points to make. First, from a statistical perspective, the better the response rate of the sample, the better one's ability to make a prediction about the population. Generalizing results from a survey with a low response rate is problematic, and accurate predictions can only be made if the sample is truly random. For example, on a particular question about the level of satisfaction with the number of places available to sit and work on one's laptop computer (see Table 1), there is a statistically significant difference between the groups. The first group seems more satisfied with the current state of affairs, while the latter group was less willing to indicate satisfaction (only those who indicated owning a laptop saw and answered this question, or approximately 89 percent of all participants).
Table 1. Comparison of Groups Answering Satisfaction Question
| How satisfied are you with the number of places where you can sit and work on your laptop/netbook on campus?* | ||
|
| First 18% of Total Sample | All Other |
| Very dissatisfied and dissatisfied | 45 (16%)** | 58 (16%) |
| Neutral | 67 (23.5%) | 121(33.3%) |
| Satisfied and very satisfied | 172 (60.5%) | 184 (50.7%) |
| Total n for column | 284 (100%) | 363 (100%) |
* Mann-Whitney U test, z = -2.04, p < .05
** Percentages signify percent of total response for the column
One type of survey error arises from what is known as nonresponse bias. This is the idea that what one learns from those who did respond may differ significantly from what might be learned from those who did not respond. It stands to reason that nonresponse bias would be higher for surveys where overall response rate was low. Some studies19 show that nonresponse bias leads to data on organizational surveys that trend toward more positive views. Others argue that a high response rate is not the single-most important factor in ensuring quality data.20 Some state that the representativeness of the sample is more important than the response rate itself.21 Others report that error introduced by participant nonresponse is negligible depending on the context of the survey.22
While debate about response rates needs to be fully considered, the studies noted above were justifying a "low" response rate of 40 percent or higher. It is difficult to see how one could make the argument that nonresponse bias is not a factor for participation that is sometimes much lower (that is, less than 25 percent). Low response rates raise the specter of nonresponse bias,23 which is an issue that should be addressed through careful survey administration. Therefore, the advice presented here about how to increase response rates should be interpreted as an important, but not entirely sufficient, means of mitigating response bias.
Concluding Thoughts
Could the response rate to our survey have been even higher? Certainly the use of paper-based surveys distributed at lab locations, further reminders, and follow-up mail surveys might have increased the response rate to some degree. The cost would have gone up as well given the printing and postage costs. But based on what we know about the demographics of the respondent versus nonrespondent sample, it is likely that a higher response rate would not have yielded data much different from what we collected.
Was it worth the money? In an environment under constant budgetary pressure, especially over these past few years, IT offices must focus on data-driven decision making to fulfill their mission as stewards and visionaries for the institutions they serve. The record-breaking response rate (as far as Boise State was concerned), as well as analysis of the respondent characteristics versus nonrespondents, leads us to believe that we have gotten trustworthy results. It may seem extravagant to some that the total cost of the survey was, in the end, more than $11 per person (factoring in the nonrespondents), but the data obtained about the university's technology infrastructure was deemed worth the cost.
As an example of the ROI, consider this short anecdote: Prior to the survey, based on early data that students owned their own laptops, some folks advocated decreasing funding for campus labs given their need for personnel and equipment. The evidence from the survey showed that despite a nearly 90 percent penetration of laptops, fewer than half of students bring them to campus. When asked why, they indicated that they did not like the weight (Boise State is primarily a commuter campus), could not find enough places to recharge the machines (or the outlets were too far from desks in most classrooms), and some instructors asked that laptops not be used in class. Additionally, since students could not (at the time) print to a remote printer from their laptops, most students used the labs to access a printer for class-related work. These data helped university IT officials understand how resources might be designated in the future.
In summer 2011, IT chose to implement the following changes, noting that these decisions were influenced by needs that students expressed in the survey:
- Consolidate some of the on-campus labs in central locations, such as the Student Union
- Adopt a system where students could push print jobs to selected locations
- Implement a system that allows mobile computer users to print to university-owned printers
- Acquire furniture that allows students to plug in mobile devices
- Standardize software licenses across all computer labs
- Extend computer lab hours for selected locations
- Install "quick check" stations so students can quickly print papers, check course schedules, check e-mail, etc.
All best practices implemented in the survey have been researched in other studies. We saw no need to replicate investigation on such factors as the salience of the message, up-front monetary incentives, trustworthiness, and so on. The logical choice was to combine the various research-based recommendations to create a highly concentrated approach to survey administration. The dramatic increase in response rate gives credence to the idea that combining these factors can garner much greater participation. Increased response rates are an important factor (but not the sole factor) in establishing a base of trustworthy data from which IT professionals can make decisions based on fact.
Quick One-Question Survey 3
Which of the best practices are you likely to put in place for upcoming surveys
about IT needs or use at your institution or organization?
- Edith de Leeuw and Wim de Heer, "Trends in Household Survey Nonresponse: A Longitudinal and International Perspective," in Survey Nonresponse, R. M. Groves, D. A. Dillman, J. L. Eltinge, and R. J. A. Little, eds. (New York: Wiley, 2002); and Roger Tourageau, "Survey Research and Societal Change," Annual Review of Psychology, vol. 55 (2004), pp. 775–801.
- Jacquelyn Burkell, "The Dilemma of Survey Nonresponse," Library and Information Science Research, vol. 25, no. 3 (2003), pp. 239–63; and Yehuda Baruch and Brooks C. Holton, "Survey Response Rate Levels and Trends in Organizational Research," Human Relations, vol. 61 (2008), pp. 1139–60.
- Michael Bosnjak and Tracy L. Tuten, "Prepaid and Promised Incentives in Web Surveys: An Experiment," Social Science Computer Review, vol. 21, no. 2 (2003), pp. 208–17; Allan H. Church, "Estimating the Effect of Incentives on Mail Survey Response Rates: A Meta-Analysis," Public Opinion Quarterly, vol. 57 (1993), pp. 62–79; Don A. Dillman, Mail and Internet Surveys: The Tailored Design Method, 2nd ed. (Hoboken, NJ: Wiley, 2007); and Dirk Heerwegh, "An Investigation of the Effect of Lotteries on Web Survey Response Rates," Field Methods, vol. 18, no. 2 (2006), pp. 205–20.
- Casey A. Klofstad, Shelley Boulianne, and Danna Basson, "Matching the Message to the Medium: Results from an Experiment on Internet Survey Email Contacts," Social Science Computer Review, vol. 26, no. 4 (2008), pp. 498–509; and Dillman, Mail and Internet Surveys.
- Dirk Heerwegh and Geert Loosveldt, "Personalizing E-Mail Contacts: Its Influence on Web Survey Response Rate and Social Desirability Response Bias," Public Opinion Research, vol. 19, no. 2 (2007), pp. 258–68; Adam N. Joinson, Alan Woodley, and Ulf-Dietrich Reips, "Personalization, Authentication, and Self-Disclosure in Self-Administered Internet Survey," Computers in Human Behavior, vol. 23 (2007), pp. 275–85; and Dillman, Mail and Internet Surveys.
- Stephen R. Porter and Michael E. Whitcomb, "Mixed-Mode Contacts In Web Surveys: Paper Is Not Necessarily Better," Public Opinion Quarterly, vol. 71 (2007), pp. 635–48; Alex R. Trouteaud, "How You Ask Counts: A Test of Internet-Related Components of Response Rates to a Web-Based Survey," Social Science Computer Review, vol. 22, no. 3 (2004), pp. 385–92; and Tracy L. Tuten, "Getting a Foot in the Electronic Door: Understanding Why People Read or Delete Electronic Mail," rep. no. 97/08. (Mannheim, Germany: Zentrum fuer Umfragen, Methoden und Analysen, 1997).
- Weimiao Fan and Zheng Yan, "Factors Affecting Response Rates of the Web Survey: A Systematic Review," Computers in Human Behavior, vol. 26, no. 2 (2010), pp. 132–39; Bernd Marcus, Michael Bosnjak, Steffen Lindner, Stanislav Pilischenko, and Astrid Shutz, "Compensating for Low Topic Interest and Long Surveys," Social Science Computer Review, vol. 25, no. 3 (2007), pp. 372–83; and Dillman, Mail and Internet Surveys.
- Colleen Cook, Fred Heath, and Russel L. Thompson, "A Meta-Analysis of Response Rates in Web- or Internet-Based Surveys," Educational and Psychological Measurement, vol. 60, no. 6 (2000), pp. 821–36.
- Thomas M. Archer, "Response Rates to Expect from Web-Based Surveys and What to Do About It," Journal of Extension, vol. 46, no. 3 (2008).
- Stephen R. Porter and Paul D. Umbach, "Student Survey Response Rates Across Institutions: Why Do They Vary?," Research in Higher Education, vol. 47, no. 2 (2006), pp. 229–46.
- The average response rate on the ECAR Study of Undergraduate Students and Information Technology from 2004 to 2010, for example, is 14 percent (n = 532). Taking out private institutions, the response rate falls to 11.3 percent (n = 498).
- Renske Spijkerman, Ronald Knibbe, Kim Knoops, Dike van de Mheen, and Regina van den Eijnden, "The Utility of Online Panel Surveys Versus Computer-Assisted Interviews in Obtaining Substance-Use Prevalence Estimates in the Netherlands," in Addiction, vol. 104, no. 10 (2009), pp. 1641–45.
- Kypros Kypri, Stephen J. Gallagher, and Martine L. Cashell-Smith, "An Internet-Based Survey Method for College Drinking Research," Drug and Alcohol Dependence, vol. 76 (2004), pp. 45–53.
- Baruch and Holton, "Survey Response Rate Levels," pp. 1139–60.
- The 12–20 percent response rate is reported by colleagues at the university who regularly work with survey administration.
- Dillman, Mail and Internet Surveys.
- For example, monetary versus gift-in-kind. See Erica Ryu, Mick P. Couper, and Robert W. Marans, "Survey Incentives: Cash vs. In-Kind; Face-to-Face vs. Mail; Response Rate vs. Nonresponse Error," International Journal of Public Opinion Research, vol. 18, no. 1 (2007), pp. 89–106.
- Joinson et al., "Personalization, Authentication, and Self-Disclosure," pp. 275–85.
- Toon W. Taris and Paul J. G. Schreurs, "How May Nonresponse Affect Findings In Organizational Surveys? The Tendency-to-the-Positive Effect," International Journal of Stress Management, vol. 14, no. 3 (2007), pp. 249–59.
- Ryu et al., "Survey Incentives," pp. 89–106.
- Cook et al., "A Meta-Analysis of Response Rates," pp. 821–36.
- Robert M. Groves, "Nonresponse Rates and Nonresponse Bias in Household Surveys," Public Opinion Quarterly, vol. 70, no. 5 (2006), pp. 646–75; and Kristen Olson, "Survey Participation, Nonresponse Bias, Measurement Error Bias, and Total Bias," Public Opinion Quarterly, vol. 70, no. 5 (2006), p. 737–58.
- Nir Menachemi, "Assessing Response Bias in a Web Survey at a University Faculty," Evaluation & Research in Education, vol. 24, no. 1 (2011), pp. 5–15.
© 2011 Ross A. Perkins. The text of this EQ article is licensed under the Creative Commons Attribution-Noncommercial-No Derivative Works 3.0 license.