
Key Takeaways
- Backing off on strategic planning and process improvement in the face of economic woes is a mistake - organizational improvement is essential in a crisis, not a luxury.
- Real, measurable, process improvement reaps benefits that can turn your institution’s fate around.
- Metrics can show where improvement is needed, help track improvement efforts, and show the likely return on investment of improvement initiatives.
According to statistics on the current economic recession, the United States is hemorrhaging jobs at an alarming rate, with 28,000 businesses failing last year and 68,000 this coming year.1 According to U.S. News and World Report, the U.S. had lost more than 5 million jobs as of April 2009.2
The nation’s economic woes have not bypassed educational institutions. Moratoriums on travel, job postings pulled from the web, and budget cuts reflect a harsh reality in many universities today. Resources are tight everywhere. So, where and how should higher education institutions spend money when funds are so tight?
Most organizations hunker down in times of fiscal crisis. They look for ways to save money and jobs. They refrain from filling positions that become vacant through natural attrition, and they cut programs. Strategic planning, metrics collection, and process improvement - efforts that enable organizational improvement - are set aside. That is a mistake. According to preliminary research by Ranjay Gulati, Jaime and Josefina Chua Tiampo Professor of Business Administration at the Harvard Business School, 40 percent of companies fail during a recession, 54 percent just survive, and only 6 percent take the opportunity to improve - "achieving breakaway success" compared to their peers.3
Do More with Less — How?
The mantra "do more with less" isn’t new. Unfortunately, this demand reappears when staff are expected to work longer hours or pick up the workload of team members who have left the organization. How, other than by working double shifts, are the same people, doing the same things in the same ways, supposed to do more with less?
Rarely does a crisis prompt process improvement efforts, which make it possible to do more with less. In most cases, organizational improvement initiatives are among the first things dropped. Improvement itself is considered a nonessential activity despite the likelihood of providing a positive return on investment (ROI).
In trying times, leaders look to cut costs and limit expenditures. The predictable outcome is that nothing changes - or things get worse. Although organizations normally react this way, this approach is not logical and not the best course of action.
How We SHOULD React
What if, instead of reacting by cutting - jobs, programs, and improvement initiatives - the organization invests money into improving processes? Adversity should catalyze improvement and innovation. What if we in higher education IT look at the crisis as an opportunity, specifically by finding savings through improving IT processes? The improvements would continue to pay dividends even when the economy stabilizes.
This isn’t a new concept. The premise behind quality improvement has always been savings - in time, money, or improved quality.
- Fewer defects = more revenue, happier customers, and better reputation
- Quicker delivery = more deliveries = more revenue, happier customers, and better reputation
- Delivering products and services at lower costs means more funds to invest in more improvements = more revenue, happier customers, and better reputation
So, why isn’t everyone doing this? Why are improvement efforts ignored when needed most? I believe we in IT have failed to demonstrate the value of improvement efforts. If an organization is serious about improvement, it will measure its current situation and determine what needs improvement and how much. The data will help determine where to find the best ROI.
Views of Organizational Health
There are four major viewpoints to take when looking at an organization’s health and potential for the future:
- Effectiveness - how well we satisfy our customers’ needs
- Efficiency -how well we are doing as stewards of the institution’s resources
- Employee satisfaction -how well we satisfy our employees’ needs
- Project visibility -how well we manage our projects
Most organizations focus on the first two areas, effectiveness and efficiency, because they are the most directly related to visible success.
How Metrics Can Help
Proper use of metrics can:
- Reveal where improvement is needed
- Track improvement efforts
- Demonstrate ROI
Metrics are useful tools, helping us see a clear and total picture - when we design them that way. First we need to select the areas to improve. Then we must consider which processes to improve, what training is needed, and what programs to develop.
To determine where improvements are needed requires collecting some basic data:
- What processes - on the largest scale - do we already implement?
- How efficient are those processes? In other words:
- How much do they cost?
- How long do they take?
- How well do we do them?
- How important are they to our business?
- Do we have fully defined, clear process definitions?
- Do we all follow the processes the same way?
- Do the processes require special skill sets?
Answering these questions might find savings right away. For example, what if half the server administrators don’t follow established procedures for maintenance? Just by having staff follow the procedures created for that purpose gains efficiencies.
If a process definition (prose and diagrams) are not in place, start there. While defining a process (how we do it), identify the probable junction points for collecting measures on the process’s efficiencies. Just capturing the process will reap benefits - diagramming the process often elicits insights the process owner normally overlooks.
Managing business processes doesn’t just mean changing processes, but measuring the outcomes of those changes. When we challenge the workforce to develop efficiency improvements, like how to do things faster, cheaper, or better with the same set of resources, they’ll need a way to show that improvements actually result in positive ROI. This requires measuring the standard areas of efficiency:
- Cost - what it costs to do what we do
- Time - how long it takes to do it
- Quality/rework - how well we do it the first time, or how much effort is wasted on defective products
The priority when capturing these measures is to determine improvements in the processes, not to evaluate staff. So, if computer labs use an imaging process to set up the computers, how long does it take to prepare the image? How long does it take to put the image on the lab computers? What other costs are involved? How many defects affect the image, and how much rework is involved?
We collect this knowledge to accomplish two basic goals
- Identify possible areas of improvement: Where are the largest costs? What processes take the longest time? Where are the biggest deficiencies in quality? Of course, this must be balanced with the processes being measured - it might be more logical to improve some more than others.
- Identify how well we’ve improved our processes: We need to show how much money, resources, and time we’ve saved and how much the quality has improved.
If we target improvement - not evaluation - we need to measure more than the overall efficiency levels, such as how long a process took before and after improvement. To really improve, we need to analyze the processes to allow us to increase our ability to improve them.
Process metrics have to be designed in conjunction with process definitions. When we lay out a process, step by step, and look at it under a bright light, we invariably improve it. When we add metrics at the correct points, we can improve it exponentially.
We usually know what the initial input is (a request, a date, or completion of another process) and we know the expected final outcome - but we have absolutely no idea what goes on inside the process (see Figure 1). The only things we can measure initially are the inputs (were the requests entered on time, did we start on the date planned, did the other process have all of its deliverables?) and the outputs (did we deliver what we said we would?).
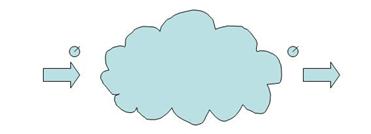
Figure 1. Inputs and Outputs
These rudimentary measures can be useful in telling us where to expend our energy.
From this level of process understanding we can determine if an overall process seems to take longer than expected. We can determine if the process produces the expected outcomes. If the inputs seem to meet expectations but the outputs fail to live up to our needs, this process might be one of the first we choose to analyze.
The first step is simply to understand the bigger process steps. That means identifying the handoffs is often critical.
Each of the boxes in Figure 2 can represent a process carried out by different departments (or people). Each arrow may represent a handoff between these process owners. With this slightly deeper view we can measure the inputs and outputs between each step.
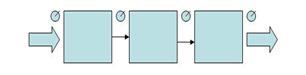
Figure 2. Bigger Process Steps and Handoffs
The reason we work stepwise from a high level toward a fully detailed view is that we may save a lot of effort by NOT focusing on areas that don’t require scrutiny. This stepwise process also allows management time to become accustomed to working with data. If we decide that one (or more) of the boxes warrant a deeper dive, we’ll start looking at the subprocesses contained within that box (Figure 3). Each set of processes generates the possibility of measures that might be useful for improving the step, procedure, or overall process.
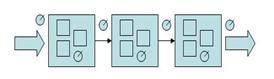
Figure 3. Subprocesses
Finally we can break down the process into its various branches and the details within each (Figure 4). Again, we only want to expend the energy to measure the components of the process that warrant our attention. Most of us don’t have time to conduct large-scale research or analysis efforts on our IT services, departments, and processes. We have to be more selective up front. No wasted effort. No wasted data.
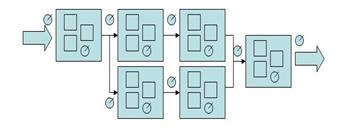
Figure 4. Processes, Subprocesses, and Branches
Conclusion
So, you don’t have time to read the entire article, and you’ve jumped to the end hoping for a simple summary of the pertinent points. Well, I aim to please.
When the next economic crisis hits, use it as an opportunity to leapfrog ahead of your peers. Rather than follow the "normal" organizational behavior of making cuts across the board to survive the rough times, be daring and take the risk of championing improvement within your organization. Push for real process improvement that can reap benefits you can measure. Invest in improvement, in your workforce, and in your business.
The key steps for leadership to follow are:
- Take process improvement seriously. Attack the change effort as you would any other problem. Don’t whitewash the fence if it needs to be torn down and rebuilt.
- Don’t look for the easy way out - don’t simply cut things to save money. In the long run, the most you can hope for is to not fall too far back. This is equivalent of playing to "not lose." Even if you succeed, you won’t "win."
- Don’t settle for just tearing down the fence unless the need for it is gone. In other words, you will have to risk improving the large, cumbersome, expensive processes, not just the small, easy ones.
- Measure before, during, and after the improvement efforts. These efforts should turn your institution’s fate around, creating new jobs, attracting new customers, and increasing revenue. These efforts have to become your top priority. Leadership should be watching progress closely.
- Expect real improvement. You get what you expect, so expect the best possible outcome. Demand it. Support it. Reward it.
So, rather than striving to survive, take a risk and strive to thrive!
- Richard Milne and Anousha Sakoui, "Company Crashes Set to Hit Record Next Year," Financial Times.com, December 7, 2008.
- Amanda Ruggeri, "Unemployment Rate Jumps to 8.5 Percent in March," U.S. News and World Report, April 3, 2009.
- Personal e-mail communication with the author June 19, 2009.
© 2009 Martin Klubeck. The text of this article is licensed under the Creative Commons Attribution-Noncommercial-No Derivative Works 3.0 license.