
The rapid pace of change in technology can be dizzying. Keeping up with these changes can be daunting for institutions of higher education, where the technological needs of constituents are as diverse as the number of available technologies.
In this climate of constant change, understanding how the university community becomes aware of and employs new technologies is critical. While personal anecdotes and the perspectives of early adopters are readily available, it is much more difficult to understand the general technology climate. A well-planned technology survey can provide evidence that extends beyond anecdote, allowing technology units, administrators, and other interested parties to make informed decisions that better meet the needs of the community.
Institutional surveys have become fairly common for acquiring information about educational technology. Over the past few years several institutions of higher education have conducted such surveys and shared their results.
The University of Wisconsin–Madison, for example, conducts two annual computing surveys: one for faculty and staff, and one for students. The university's 2007 student survey included a question asking respondents to prioritize potential IT service changes; more students gave priority to increased wireless access than to a new computer lab.1
Since 2001, the University of Minnesota, Twin Cities, has engaged in a longitudinal research project to understand faculty attitudes about digital technology.2 A finding of note from the 2007 survey was that faculty selected information design (how to organize and present information) as the primary topic they wanted to learn more about. Based on this and similar data, the researchers remarked on a general tendency for faculty "to focus on the educational rather than the technical aspects of digital technology."3
The EDUCAUSE Center for Analysis and Research (ECAR) conducts an ambitious multi-institution survey annually, reaching students at more than 100 colleges, universities, and community colleges. The 2007 ECAR student survey found that even though undergraduates used a variety of technologies to support their academic lives, the majority wanted only a moderate amount of instructional technology in their courses. This finding agrees with ECAR study data from the previous three years.4
The University of Washington (UW) conducts educational technology surveys that complement the investigative efforts described above. In 2005, representatives from six UW units collaborated to survey instructors and students about their use of, expertise with, and perspectives on educational technology. The goal was to better understand current technology use to help us make informed decisions on where to allocate time and resources.
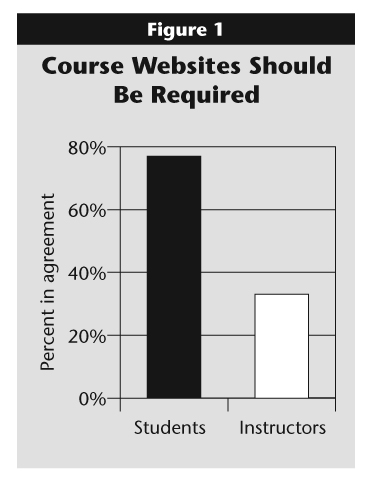
One of the more interesting findings from the UW surveys was the difference in opinions about potential technology requirements expressed by instructors and students. For instance, Figure 1 compares instructor and student responses to a question about requiring course websites; 77 percent (n = 725) of student respondents indicated that they strongly agreed or somewhat agreed with making course websites a requirement, compared with 33 percent (n = 447) of instructor respondents.5
Click image for larger view.
The findings from the UW surveys, and from similar surveys elsewhere, offer useful insights into how educational technology is used, help identify barriers to expanding use, and reveal goals for future use. Information in all areas enables institutions to make evidence-based decisions on where best to allocate time and resources to meet evolving technological needs.
The UW survey findings represent just one component of what we learned, however. We also discovered the opportunities and challenges inherent in conducting large-scale, committee-based research. We believe the circumstances we encountered during the survey process resemble those other institutions have faced or will face in similar endeavors, and in this article we share the lessons learned. While some of these lessons include research findings, the majority involve the implications of the methodologies selected and the decisions made.
We discuss the strengths and weaknesses of the approaches we used to determine the focus of our survey, to define technology within the survey, and to select a sample of the UW population. We conclude with a description of how we applied what we learned to the development of our 2008 Faculty, Teaching Assistant, and Student Surveys on Learning and Scholarly Technologies, which, at the time of this writing, are being distributed to the UW community.
Our aim in sharing stories from the front line of educational research is to start a dialogue about practical methodologies and strategies for conducting research in everyday educational contexts. This discussion will be useful for individuals or groups interested in employing an evidence-based approach to facilitate the integration of learning and scholarly technologies at their institutions.
Methods
The research team for the UW's 2005 educational technology surveys consisted of partners from the Office of Educational Partnerships and Learning Technologies (now Learning & Scholarly Technologies), Computing & Communications (now UW Technology), UW Libraries, the Office of Educational Assessment, Classroom Support Services, Educational Outreach, and the Student Technology Fee Committee. This team was united by a shared responsibility for supporting various aspects of technology use, from designing web applications to conducting training sessions to funding new technological endeavors. All research decisions, including writing survey questions, were made by a committee of representatives from these units.
The 2005 instructor survey contained 19 questions in four sections: about you, your use of technology, your use of campus resources, and your perspective on educational technology. The first section contained basic demographic questions. In the technology use section we asked instructors to rate their general expertise with technology and to indicate their level of expertise on 14 different technical tasks. We also asked instructors to indicate how often they used 31 different types of technology to support their instruction. The section on campus resources included questions about the use of multimedia and computer classrooms, as well as UW–provided e-mail. The questions in the perspectives section identified the supports and obstacles instructors encountered when using technology; asked about when and how instructors taught technical skills to their students; and gathered opinions on the future direction of educational technology at the UW.
The student survey had an almost identical structure, with 20 questions in the same four sections. There were three main deviations from the instructor survey:
- The technology-use section in the student survey focused on how students use technologies to support their learning.
- The campus resources section included questions about UW computing labs.
- The perspectives section asked students to identify the modes of instruction that help them learn the technologies required for their coursework.
The sample for the 2005 instructor survey consisted of all individuals listed as the instructor of record for at least one course section at the Seattle, Bothell, and Tacoma campuses of the UW during spring 2004, fall 2004, or winter 2005. Our final sample included 4,390 instructors. This sampling approach included graduate students who held teaching assistantships. We e-mailed the link to the online survey to the individuals in our samples, and then one week later we mailed a paper copy of the survey to nonrespondents. Later still we sent one e-mail reminder and one paper reminder. During this process, we found that we had incorrect or incomplete contact information for 350 instructors, mainly adjunct faculty. The response rate for the instructor survey was 34.4 percent.
A random sample of 3,500 students was generated from a list of undergraduate and graduate students enrolled for credit as of the tenth day of spring 2005 at any of the three UW campuses. The sample excluded graduate students with teaching appointments, since they were included in the instructor sample. The number of students selected for our sample was the result of our effort to minimize survey fatigue by surveying students who had not recently received other large-scale surveys. The student response rate was 28.2 percent.
In spring 2005 we also conducted focus groups with instructors and students. The goal was to gather more in-depth information about individuals' experiences using educational technology. Questions focused on types of technology used, obstacles to using technology, supports for technology use, and types of technology or support that the UW should provide in the future. Each focus group had three to six participants and lasted for 60 to 90 minutes. Participants were recruited from a list of survey respondents who had indicated on a separate form that they were willing to be contacted about focus groups. Due to difficulties recruiting student focus group participants, we also advertised in student computer labs. Overall, 40 instructors and 25 students (3 of whom responded to the lab announcements) participated in focus groups.
We did not maintain a link between focus group responses and survey responses. We audio-recorded the focus group sessions and had the recordings transcribed.
Lessons
The lessons learned from the survey process fit into three main categories: determining the survey's focus, defining educational technology, and choosing a sample.
Determining the Survey Focus
The UW's 2005 instructor and student surveys had a deliberately broad focus. They not only examined technological expertise and technology use but also explored perspectives on technology. The driving force behind this range of topics was the differing needs of the various members of our collaborative team. Several of the partnering units had conducted surveys in the past, including a collaborative student survey in 2002, and wanted to ask the same or similar questions on these surveys; others were grappling with technological issues that needed immediate answers. To keep the surveys to a manageable length (approximately 20 minutes), the committee set limits on questions allowed per group: each partner could create up to three questions for each survey.
Despite the wide variety of topics examined, the survey questions were united by a focus on practical information of direct relevance to technology support issues. For instance, Computing & Communications (now UW Technology) needed to know how often students read UW e-mail. In the student survey, 87 percent (n = 791) of respondents reported reading UW e-mail daily. The Office of Educational Partnerships and Learning Technologies (now Learning & Scholarly Technologies), which had a long history of surveying students about their use of campus computing labs, wanted to learn what factors influenced students' use of campus labs. Location, rather than available software or services, had the greatest influence on use. Of the 62 percent (n = 566) of student respondents who reported using general-access computing labs, 71 percent (n = 401) listed "location is convenient" as a reason for their choice to use these labs, while only 28 percent (n = 156) reported using the labs to access "hardware I do not have access to elsewhere."
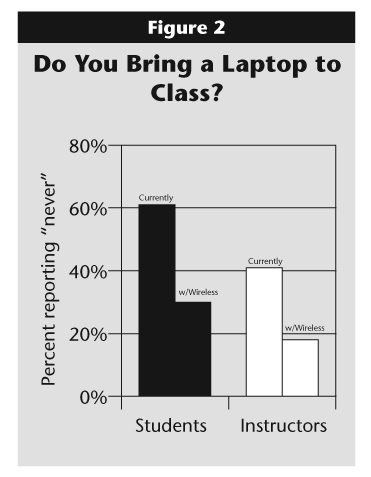
All partners were curious to know the likely effect of the UW's initiative to provide wireless access across the main Seattle campus. The survey results indicated that the expansion of wireless was likely to significantly increase the percentage of instructors and students who brought their laptops to class. In response to a question asking how often they currently bring a laptop to class, 61 percent (n = 543) of student respondents reported they never bring a laptop to class; however, "if more classrooms had wireless access," that dropped to 30 percent (n = 258). In comparison, 41 percent (n = 553) of instructor respondents reported never bringing a laptop to class; that dropped to 18 percent (n = 232) with the availability of wireless in more classrooms (see Figure 2).
Click image for larger view.
While these examples illustrate the type of practical data the surveys generated, another example reveals some of the limitations of our approach to writing survey questions. In focus groups, all 40 instructors who participated expressed concerns about technology in university classrooms. The same concerns emerged in the qualitative data from the instructor survey, which had an open-ended comment space at the end. Approximately half of the instructors who completed the survey wrote comments, nearly one-third of which involved classrooms (n = 241). The most common concerns raised included the lack of computers and data projectors in many classrooms, encounters with unreliable equipment, inconsistencies between classrooms, and frustration with hauling equipment (such as laptops and small data projectors) across campus.
Although concerns about classrooms dominated the qualitative data, they did not have the same prominence in the quantitative data. This disparity arose because the survey asked only two questions about classrooms, both on specific types of classrooms. The first asked about instructors' use of special multimedia classrooms and collaboratories (classrooms with a computer on every desk). A majority of instructors who had taught in these rooms frequently used their multimedia capabilities. Of the 58 percent (n = 792) of instructors who reported using multimedia classrooms, 83 percent (n = 635) sometimes, usually, or always used the multimedia capabilities, while 17 percent (n = 133) reported seldom or never using them. While the latter percentage is significantly smaller than the former, it is still notable because advanced computing spaces are scarce on campus. A quote from an instructor in a focus group offers a possible explanation for this pattern:
The second question on classrooms asked about the types of technologies that instructors felt enhanced or detracted from student learning in seminar classrooms (rooms for classes with fewer than 30 students). Notably, 84 percent (n = 1,122) of instructor respondents felt that the availability of a computer with projection enhanced student learning, while only 35 percent (n = 406) felt that wireless access for student laptops enhanced student learning.
In a related note, focus groups revealed that instructors had concerns about student laptops becoming a distraction during class, and students were concerned that instructors would not develop course activities to take advantage of classroom wireless access.
While the statistics from the survey questions coordinated with what we learned from qualitative sources, they did not address the scope of classroom issues that emerged in the qualitative data. Because of the limitations in our survey questions, we could not fully report on general trends regarding classrooms.
In developing the 2008 surveys on learning and scholarly technologies, we responded to this limitation in the 2005 data by instituting several changes in the survey process. One substantial change was our decision to conduct focus groups prior to developing the survey. We used findings from the focus groups to help us craft survey questions that responded to the key issues identified by faculty, teaching assistants, and students.
We also implemented a new committee structure. Members of a steering committee, consisting of leaders within the partnering units, determined three priority topics for the surveys: identifying the types of support most useful to instructors and students, the obstacles instructors and students encounter when they use currently supported technologies or try to use new tools, and new technologies that faculty and students would like to use in the future. Then a group of representatives from the partnering units helped generate focus group questions on these topics and later used focus group data to develop potential survey questions. Finally, a smaller team of researchers finalized the survey structure and question wording.
This approach allowed brainstorming by a larger committee while enabling individuals with survey expertise to maintain control over the survey instrument. Ultimately, it also allowed us to develop a more focused survey, which went into depth on a few key issues rather than a smorgasbord of technology trends.
Defining Educational Technology
Deciding which aspects of educational technology to examine was one of the most significant challenges for the 2005 surveys. Were we interested in the exact technologies used, the reasons for their use, or how they were integrated into various learning contexts? In the end, we decided to focus on the specific technologies used in the service of instruction and learning. We asked about a wide array of technologies, both new and established, and listed particular technologies in our questions rather than asking about tasks accomplished with technology or motivations for technology use. This approach to measuring educational technology was consistent with the specific support-related information that the partnering units sought to obtain.
To gather this information, we asked questions that included details about particular technologies. For instance, we asked respondents to indicate how frequently they used 31 different types of technology: word-processing software, audio editing software, collaborative web-editing software, RSS readers, and many others. We learned that 75 percent (n = 1,678) of all respondents (instructors and students combined) used presentation software, such as PowerPoint, versus 5 percent (n = 106) who used RSS readers.
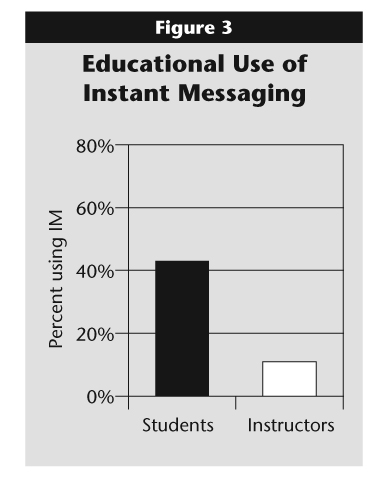
These results enabled us to make comparisons between different populations. One interesting finding was that 43 percent (n = 408) of students reported using instant messaging to support their learning versus only 11 percent (n = 156) of instructors who reported using instant messaging to support their instruction (see Figure 3). This type of information allowed us to identify which technologies were the most established at the UW, which ones were beginning to be used by a small number of users, and which ones were favored by particular segments of the UW community.
Click image for larger view.
Although knowing exactly what technology is used is a distinct advantage to this approach, it also has several disadvantages. The most pronounced limitation is the ability to compare information over time. In crafting the 2005 student survey, we based some questions, including the technology use questions described above, on a 2002 student survey. However, only seven of the 24 items on the 2005 technology list had been included in 2002 survey. Some of the technologies removed included scanning software and e-mail; technologies added included cell phones, wikis, and instant messaging. Given the exponential pace of change in technology, the list of technology types we defined for the 2005 surveys is already somewhat out of date. The 2005 list does not include podcasts or online simulations, for example. A tension emerges between the desire for meaningful longitudinal comparisons and the desire to reflect the most relevant technologies in the current technology climate. We chose to focus on the latter.
Another limitation of our approach to defining educational technology is that it does not provide information about how or why individuals use (or do not use) particular technologies. In addition, we do not know how satisfied individuals were with the technologies they did use. We were able to gather some of this information in focus groups, however. A common refrain in the instructor focus groups was how difficult it was for instructors to find time and opportunities to learn new technologies. According to one instructor, "I think just because of the time commitment to go through a learning curve it is going very, very slowly."
The focus groups helped provide details to illuminate some of the technology choices instructors reported in the surveys. Nonetheless, the focus on technologies at the expense of contexts of use made it difficult to paint a full picture of technology use.
In 2008, we have complicated the issue of defining educational technology even further by focusing on technologies used for research activities as well as for instruction and learning. Therefore, we changed the name of our surveys to the "2008 Faculty, Teaching Assistant, and Student Surveys on Learning and Scholarly Technologies." This change reflects a larger cultural and organizational shift within the UW, where over the course of the past few years significant attention has been paid to how teaching and research activities converge. A series of six questions at the end of the 2008 faculty survey focus specifically on research computing needs. In these questions we ask faculty to identify the type of research projects they work on, the specific research management and collaboration tasks that are important to their research, and the technologies they rely on to accomplish those tasks.
Another major shift in 2008 has been our decision to create a survey that contextualizes technology use. Rather than simply asking faculty members and teaching assistants what technologies they use for their instruction, we first asked them to select one of 20 different instructional contexts (for example, small lecture, field experience, or research team). Next, we asked respondents to select an instructional goal that is important within this context (such as to help students develop their thinking skills or to cultivate community and connection).
These lists of contexts and goals were generated from our focus group data. After selecting a context and goal, instructors then select all the technologies they use within that context and specify which of those technologies they use to meet their chosen goal. This approach allows us to recognize the wide range of formal and informal environments in which teaching and learning occur and to identify which technologies instructors use to meet particular goals. Students are asked similar questions about their learning contexts and learning goals.
While the list of technologies may change, the contexts and goals are likely to provide a foundation for meaningful analysis of where and how various technologies are used over time. More importantly, this approach allows us to consider technologies within the context in which they are used, giving us a richer understanding of the complexities of their application.
Selecting a Sample
The 2005 instructor and student surveys at the UW used an extremely broad sampling approach, giving us a comprehensive sample of instructors at all tenure levels and students across all academic levels. We chose to employ a broad sample in order to collect representative data and to make high-level comparisons between segments of the UW community. Because the partnering units that developed the survey aim to serve all of the UW community rather than members of a particular department or program, this sampling approach was in keeping with the surveys' exploration of a range of topics important across the university.
In many aspects, our data were representative of the institution, reflecting the general UW breakdown in rank and class standing. For instance, looking at the 648 undergraduate students who completed the survey, 70 percent were upperclassmen and 30 percent were lowerclassmen. This breakdown accurately reflects the institution. Various factors contribute to this division: large numbers of transfer students, students with additional credits from advanced placement courses or other sources that influence their class standing, and students who need more than four years to complete their degrees. We were overrepresented in juniors, however, who accounted for 36 percent of undergraduate survey respondents compared to 29 percent of the student population. Similarly, seniors were underrepresented, accounting for 34 percent of undergraduate respondents compared to 41 percent of the university population. Our data on faculty also mirrored the general rank divisions on campus.
Our approach also had significant limitations. One of the most important involved the division of graduate students across the two surveys. In our study, graduate students were defined as instructors or students based on whether they had taught a course or discussion/lab section as a teaching assistant within the past year. However, graduate students significantly influenced findings on both surveys. On the student survey, 286 graduate students responded, accounting for 29 percent of total responses; for the instructor survey, 411 teaching assistants responded, accounting for 30 percent of total responses. The inclusion of graduate students on both surveys tended to mask the differences between faculty and undergraduate student perspectives. When we separated graduate student responses from both surveys, we found more striking differences.
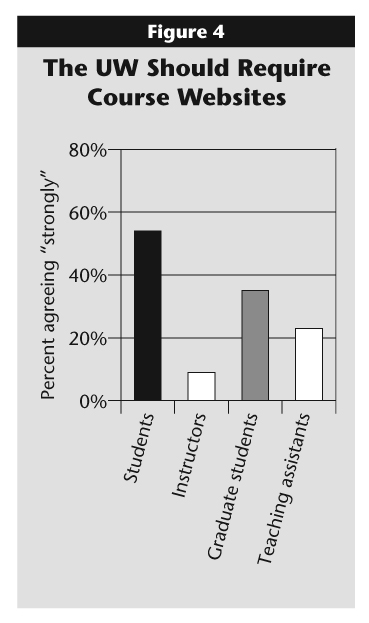
A close analysis of data from the question about requiring course websites illustrates this pattern. We asked all respondents to rank their level of agreement with the following statement: "The UW should require all courses to have a course website." On a five-point scale (agree strongly, agree somewhat, neutral, disagree somewhat, disagree strongly), 47 percent (n = 441) of student respondents and 14 percent (n = 186) of instructor respondents indicated that they agreed strongly with this statement. When we separated graduate student data and looked at faculty members and undergraduate students separately, however, we found that 54 percent (n = 333) of undergraduate students and 9 percent (n = 77) of faculty agreed strongly with making course websites a requirement (see Figure 4). Isolating faculty and undergraduate student data reveals that the difference in opinion on this issue is five percentage points greater for faculty and seven percentage points greater for undergraduate students.
Click image for larger view.
Although graduate students, whether they completed the instructor or student survey, more often than not gave responses that fell between faculty members and undergraduates, this pattern did not equate to a similarity of responses between teaching assistants and their nonteaching graduate student counterparts. For example, 72 percent (n = 196) of graduate students who completed the student survey somewhat or strongly agreed with requiring course websites, as opposed to 45 percent (n = 179) of those who had taught a course, with 35 percent (n = 96) of graduate students that do not teach and 23 percent (n = 94) of teaching assistants expressing strong agreement (see Figure 4). Because the student survey asked graduate students to think of themselves as students and the instructor survey asked them to think of themselves as instructors, this difference can be readily explained. Given the different focus of the surveys, it was impossible to combine the responses of graduate students across the two surveys and understand them as a distinct population.
In 2008, we decided to stop surveying graduate students across two instruments based on their teaching experience. Instead, we surveyed all non-student instructors of record for the faculty survey. We then sent a separate survey, modeled after the faculty survey, to 1,000 teaching assistants. For the student survey we sampled 5,000 undergraduate and graduate students, including both teaching assistants and non-teaching graduate students. We made sure no students were included in the samples for both the teaching assistant and student surveys. Like the other changes introduced in 2008, this new sampling technique should allow more meaningful comparisons across the population we serve.
Discussion
Two developments related to the 2005 surveys demonstrate their value. First, the partnering units drew on data from the surveys to help secure funds for technology improvements on the Seattle campus, earmarking the majority of the funds for classroom upgrades. Second, the collaborative process employed for the 2005 surveys paved the way for additional projects among technology support units. Several of the survey partners collaborated to address faculty concerns about the impact of wireless access on instruction by leading a campus-wide discussion of pedagogical strategies. Many of the same units came together again to pilot and evaluate the use of podcasting in large-lecture courses.6
We intend to survey the UW community every three years using the 2008 method, drawing on lessons learned from the 2005 surveys but with questions that reflect current needs. Although data are still being collected for the 2008 survey cycle, the focus group process has already helped us identify some important trends. For instance, there was a general perception that the UW offers adequate technological resources but that the many available tools and lack of standardization across campus can overwhelm instructors and students.
Student focus groups taught us that although students use a wide range of technologies in their personal lives, mostly for communication and entertainment, they tend to learn how to use technologies for learning such as discussion boards, electronic homework submission, or database searching tools primarily in their courses. Faculty focus groups expressed a desire for more opportunities to participate in collegial discussions about teaching and technology so that they can share ideas and information with their peers. Once we have completed our analysis of the 2008 survey data, we will better understand how well the opinions of our focus group participants reflect the views of their peers across campus.
Conducting a university-wide technology survey is both informative and challenging. Maintaining a clear focus, defining technology in a strategic manner, and selecting a useful sample can maximize the benefits of the process. We encourage others doing similar surveys to supplement their presentation and publication of study findings with candid insights into what they have learned from the process of conducting such studies. The lessons learned benefit all of us.