
Key Takeaways
-
Relying on SAT/ACT scores only to indicate college readiness and control decisions on admission and scholarships may steer qualified students away from higher education.
-
Using high school percentiles to make decisions on admissions and scholarships tracks better with the data on increasing retention at Texas A&M University–Commerce.
-
If the university had used high school percentiles over the past seven years, scholarship awards to minority students could have increased by 45 percent.
Nationwide a record number of schools have decided to move to an "optional" ACT/SAT admissions policy. Growing research shows a strong positive correlation between test scores and socioeconomic status and how this negatively affects college acceptance of minorities and low-income students. At Texas A&M University–Commerce (TAMU-C), we already automatically admit all students ranked in the top 25 percent of their graduating class, but our scholarship awarding policies for first-year students have historically focused on SAT/ACT scores at a three-tier scholarship level as displayed in table 1 — a fairly common practice among higher education institutions nationwide. However, co-author Ricky Dobbs, associate provost for Academic Foundations, has always had a hunch that high school class percentile is a better indicator of student persistence than test scores at our university. With that statement in mind, we set out to validate or disprove this institutional hunch using our predictive analytics model, supported with an in-depth analysis of our historical data.
Table 1. Scholarships awarded by test scores
|
Scholarship |
ACT/SAT Scores |
Scholarship Amount |
|---|---|---|
|
Presidential |
28/1270 |
$2,500 per year/$1,250 per semester |
|
Academic Excellence |
25/1180 |
$1,500 per year/$750 per semester |
|
Blue & Gold |
23/1050 |
$1,000 per year/$500 per semester |
We mined the data in table 1 using Civitas Learning's predictive analytics platform, Illume, and then used that platform to test the validity of our hypothesis. We first surfaced the top variable, the one most predictive for first-time full-time students enrolled for at least three terms. High school class percentile ranked in the top five most powerful predictors for this particular group as seen in figure 1. Performing a quick query for both SAT and ACT predictors for this student population, no test score predictor appeared until a distant 34th position in our ranking.
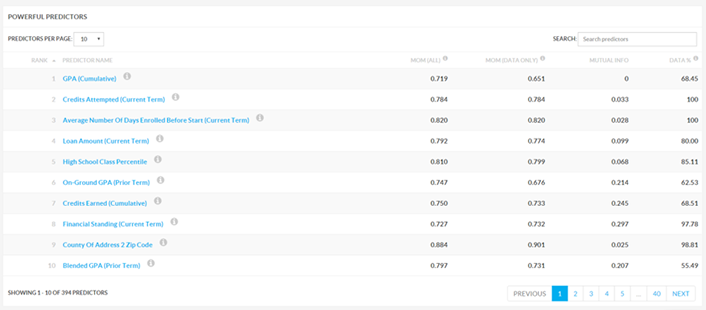
Figure 1. Top 10 predictors of persistence for first-time full-time students at TAMU-C
Looking at eight years' worth of historical data, figure 2 shows the persistence trends of first-time students who enrolled full time for at least three consecutive terms based on high school class percentile. At or above the 80th percentile, this predictor showed an inverse relationship: persistence dramatically increases and non-persistence decreases. Students at or above the 80th percentile persist 7.16 percentage points above the average for entering first-time, full-time students overall. Thirty-seven percent of all who persist in their educational journey with TAMU-C graduated high school at or above the 80th percentile of their high school class. We see a strong correlation between persistence and high school class percentile at our institution.
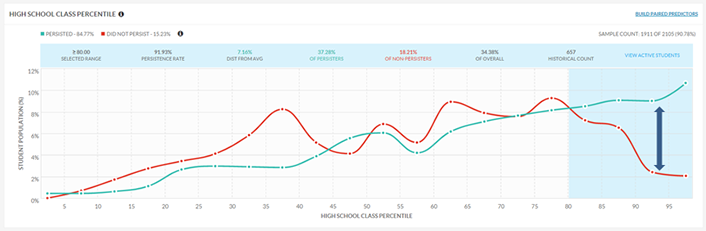
Figure 2. Persistence probabilities for first-time full-time students by high school class percentile
Figure 3 uses a paired predictor plot tool that compares high school class percentile (X) with the maximum ACT composite score (Y) using the same data set. The top right quadrant tells us that a combination of both predictive indicators is the best indicator of student success. The top left quadrant shows that the maximum ACT composite score alone is 5.19 percent below the average persistence for this student population. The bottom right quadrant demonstrates that high school class percentile by itself is slightly above the average historical persistence for these students. The heat map on the right shows that the highest concentration of persistence is in the right two quadrants at 75 percentile or above. Persistence falls off dramatically for those students represented in the upper left quadrant of the same heat map, whose ACT composite score actually exceeds the campus average, but whose high school class percentile is below the 70th percentile. This analysis supported our hypothesis that high school class percentile is a better indicator of student success at TAMU-C. We ran the same analysis multiple times with SAT predictive indicators as well, displaying similar results.
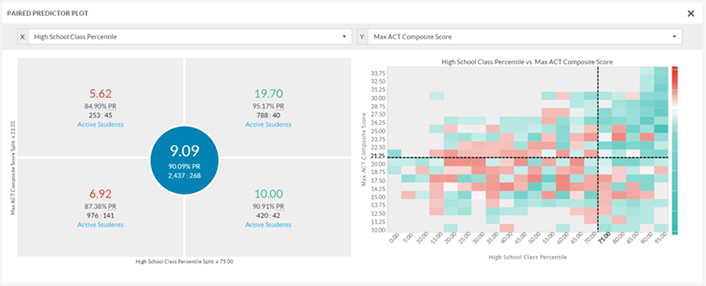
Figure 3. Maximum ACT composite score vs. high school class percentile
We also performed a what-if analysis to compare what might have happened if we had used high school percentile during the last seven years instead of awarding scholarships based on test scores. The hypothetical insights we found include:
- We could have awarded scholarships, on average, to six percent more students in each first-time freshmen cohort.
- We would have awarded scholarships, on average, to 45 percent more minority students in each first-time freshman cohort, with a particularly large boost in funds for new Hispanic students.
- Our retention of first-time freshmen would have been at least three percentage points higher after three years.
We want to emphasize the second point in particular, which highlights how important it is to revisit institutional policies periodically. Looking at the Commit! school district data for Dallas ISD, we can visualize how far behind our minority high school students are in comparison to white students in the same district. Figure 4 shows that white students outperform minority students in every metric when it comes to test scores: 54 percent of all white students score above 1110 on the SAT or above 24 on the ACT, compared to a distant 6 percent for Hispanic students and 8 percent for African-American students. Our data analysis shows that using high school percentile would be a more inclusive policy for minority students.
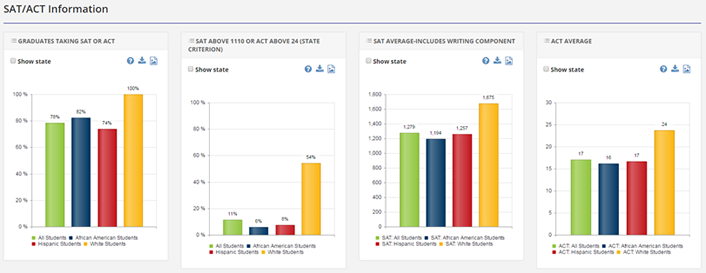
Figure 4. Dallas ISD SAT/ACT information by student demographics
Figure 5 shows the importance of identifying new ways to award scholarships to students based on demographic trends that may impact your institution. As indicated by the pie chart, it is clear that Hispanic students represent the majority of students in our immediate service area. Sixty-six percent of all annual graduates from Dallas ISD and 70 percent of all enrolled students are Hispanic. African American students also represent almost 26 percent of graduates and 23 percent of enrolled students in Dallas ISD. This means that the majority of students we will serve today and in the near future are minorities. Furthermore, of the 160,148 students in the district, 86 percent come from low-income families. Some of these students do not have the proper preparation for these tests, such as SAT workshops, or parents who fully understand the importance of these tests or the college admissions processes in general. We encourage you to read Who Gets to Graduate? by Paul Tough, which clearly explains the graduation gap between students from different economic quintiles. There is pretty clear disparity in who takes these tests and in the results themselves. If we hype the tests as determining college readiness, and then the tests cost $80 each to take (not counting prep courses), then as institutions we discourage qualified students with good grades and class ranks. We need to use tools and analytics to make sure standardized testing does not steer talented students away from higher education. We also need to do everything within our power to provide students the necessary resources to enable them to have a successful college experience from initial enrollment to completion and beyond.
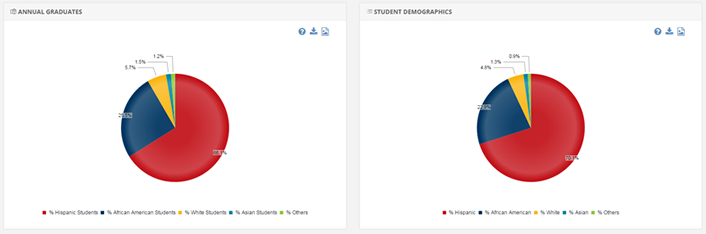
Figure 5. Dallas ISD annual graduates and enrolled students by demographics
These predictive factors were too powerful to ignore given the growing representation of minority students at TAMU-C. Our leadership team decided to act immediately on these insights. Backed by analytics, we have developed a two-tier scholarship level that will be distributed among students in the top 25th percentile of their graduating class, regardless of test scores (see table 2). We also have built a GPA-to-percentile converter calculator to make sure we can award scholarships to students who do not have high school ranking. However, our efforts will not stop there; we will continue to analyze trends to make sure scholarship dollars are allocated to those students most likely to succeed at our institution.
Table 2. Scholarships awarded by high school percentile
|
Scholarship |
High School Percentile |
Amount |
|---|---|---|
|
Presidential |
Top 10% |
$2,750 per year/$1,375 per semester |
|
Academic Excellence |
11%–25% |
$1,500 per year/$750 per semester |
Before you begin to tell colleagues that your "hunch" about high school percentile was right all along, remember that these insights arise from TAMU-C's specific predictive model. Depending on your institution's characteristics you might find the opposite to be true for your students. Most importantly, if you are not doing anything with your data but reporting, you must have these conversations with your leadership teams in order to implement changes in policies that have the potential to enable student success at your institution through analytics-based decision making. Analytics alone will never change the game; it is up to us to act on this information to truly make a difference in our students' lives.
Carlos Rivers, MBA, is operations research analyst, Texas A&M University–Commerce.
Ricky Dobbs, PhD, is associate provost for Academic Foundations, Texas A&M University–Commerce.
© 2017 Carlos Rivers and Ricky Dobbs. The text of this article is licensed under Creative Commons BY-NC-ND 4.0.